Interval-value Based Particle Swarm Optimization algorithm for
cancer-type speci
fi
c gene selection and sample classi
fi
cation
D. Ramyachitra
⁎
, M. So
fi
a, P. Manikandan
Department of Computer Science, Bharathiar University, Coimbatore 641046, India
a b s t r a c t
a r t i c l e i n f o
Article history: Received 8 April 2015
Received in revised form 27 April 2015 Accepted 29 April 2015
Available online 23 May 2015 Keywords:
Microarray Gene selection
Tissue sample classification Particle swarm optimization Interval-value classification
Interval-value based Particle Swarm Optimiza-tion classificaOptimiza-tion
Microarray technology allows simultaneous measurement of the expression levels of thousands of genes within a biological tissue sample. The fundamental power of microarrays lies within the ability to conduct parallel surveys of gene expression using microarray data. The classification of tissue samples based on gene expression data is an important problem in medical diagnosis of diseases such as cancer. In gene expression data, the number of genes is usually very high compared to the number of data samples. Thus the difficulty that lies with data are of high dimensionality and the sample size is small. This research work addresses the problem by classifying resultant dataset using the existing algorithms such as Support Vector Machine (SVM), K-nearest neighbor (KNN), Interval Valued Classification (IVC) and the improvised Interval Value based Particle Swarm Optimization (IVPSO) algo-rithm. Thus the results show that the IVPSO algorithm outperformed compared with other algorithms under sev-eral performance evaluation functions.
© 2015 The Authors. Published by Elsevier Inc. This is an open access article under the CC BY-NC-ND license (http://creativecommons.org/licenses/by-nc-nd/4.0/).
1. Introduction
Cancer classification using gene expression data usually relies on tra-ditional supervised learning techniques, in which only labeled data (i.e., data from a sample with clinical follow-up) can be exploited for learning, while unlabeled data (i.e., data from a sample without clinical
follow-up) are disregarded[1]. Recent research in the area of cancer
di-agnosis suggests that unlabeled data in addition to the small number of
labeled data can produce significant improvement in terms of accuracy
by using a technique called semi supervised learning. Indeed, semi su-pervised learning has proved to be effective in solving different biolog-ical problems including protein classification, prediction of transcription
factor–gene interaction and gene-expression based cancer subtype
dis-covery. Microarray technology allows simultaneous measurement of the expression levels of thousands of genes within a biological tissue sample. An important application of gene expression is to classify sam-ples according to their gene expression profiles, such as the diagnosis or the classification of different types or subtypes of cancer[2,3]. Different
classification methods from statistical and machine learning have been
applied to the classification of cancer. However, high dimensionality
and possibly a small number of noisy samples pose great challenges to the existing methods. The main approach to this problem was based on the existing algorithms to analyze gene expression data. Most of
the classifiers involve complex models containing numerous genes.
This has limited the interpretability of the classifiers and this lack of
in-terpretability hampers the acceptance of diagnostic tools. Classification
models based on numerous genes can also be more difficult to transfer
to other assay platforms, which may be more suitable for clinical
appli-cation. Several researchers pointed out that the classifiers might be
de-veloped to contain a small number of genes that provide classification
accuracy comparable to that achieved by models that are more complex
[4]. Moreover, some more complex algorithms based on numerous
genes for classification often overfit the data[5].
Prior to classification, a variety of gene selection strategies have been used. The aim of gene selection is to select a small subset of genes from a larger pool[6,7]. Gene selection methods are classified into three types:
(1)filter methods, (2) wrapper methods and (3) embedded methods.
Filter methods evaluate a subset of genes by looking at the intrinsic characteristics of data with respect to class labels, while wrapper methods evaluate the goodness of a gene subset by the accuracy of its
learning or classification. Embedded methods are generally referred to
as algorithms, where gene selection is embedded in the construction of the classifier. In the gene selection process, an optimal feature subset is always relative to a certain criterion. Every criterion measures the discriminating ability of a gene or a subset of genes to distinguish differ-ent class labels. To measure the gene–class relevance, different statisti-cal and theoretistatisti-cal measures such as the t-test, entropy and mutual information are typically used, and different metrics including the
Euclidean distance and correlation coefficient are employed to calculate
the gene–gene redundancy[11,15].
⁎ Corresponding author. Tel.: +91 99 943 74 370. E-mail address:[email protected](D. Ramyachitra).
http://dx.doi.org/10.1016/j.gdata.2015.04.027
2213-5960/© 2015 The Authors. Published by Elsevier Inc. This is an open access article under the CC BY-NC-ND license (http://creativecommons.org/licenses/by-nc-nd/4.0/).
Contents lists available atScienceDirect
Genomics Data
Infilters, the characteristics in the feature selection are uncorrelated to those of the learning methods, therefore they have a better
generali-zation property[1]. Thefilters, wrapper and embedded are then
ana-lyzed to identify the most frequently appearing genes which would
correspond to the most predictive genes[2]. The Genetic Algorithm
combined with a Support Vector Machine classifier is used for selecting
predictive genes and forfinal gene selection and classification. The anal-ysis of gene expression data is to identify the sets of genes as classifi ca-tion or diagnosis platforms. Machine learning techniques, such as
artificial neural networks (ANNs), present a moreflexible‘model-free’
approach for classification and frequently yield good results[6]. The ad-vantage of selecting a combination of genes with small redundancy, fa-vors the selection of mutually uncorrelated genes. The selected set of
paired genes was used as a new feature set for the classification.
In wrapper type methods, feature selection is“wrapped”around a
learning method and a feature is directly judged by the estimated
accu-racy of the learning method[11]. One can often obtain a set with a very
small number of non-redundant features, which gives high accuracy, because the characteristics of the features match well with the
charac-teristics of the learning method[14]. Wrapper methods can use
differ-ent performance metrics and objective functions. And also the
wrapper methods select the“minimum”subset of features that
pro-vides the highest sensitivity. Embedded methods differ from other fea-ture selection methods in the way that feafea-ture selection and learning
interact[14]. In contrast tofilter and wrapper approaches, in embedded
methods the learning part and the feature selection part cannot be
separated—the structure of the class of functions under consideration
plays a crucial role[22].
2. Experiments
In this section, we evaluate the discriminative performance of our
selected gene set on different classifiers. We also compare the
perfor-mance of our proposed classification method to a wide range of
stan-dard classifiers: Support Vector Machine (SVM), K Nearest Neighbor
(KNN), Particle Swarm Optimization (PSO) and Interval Value Classifi
-cation (IVC). A set of experiments is conducted on the dataset by
vary-ing the number of genes selected to receive the highest classification
accuracy.
2.1. Results on the leukemia dataset
To evaluate the performance of the proposed method in practice,
this research used the datasets containing gene expression profiles
from patients with acute lymphoblastic leukemia (ALL) and acute mye-loblastic leukemia (AML). The leukemia dataset is collected from the UCI Repository. In the leukemia dataset 72 samples are used for the training set and 32 samples are used as the testing set. This dataset have compared with the leukemia dataset that contains the ALL/AML types. The ALL portion of the dataset is derived from two cell types, B-cells and T-B-cells, while the AML part is split into two types as bone
mar-row (BM) samples and peripheral blood (PB). The correctly classified
in-stance for the leukemia dataset is 8.0 and incorrectly classified instance is 1.0. The comparison has been done with proposed IVPSO and several existing algorithm such as SVM, KNN, IVC. It has been found that the proposed algorithm is better than the existing algorithm for classifying
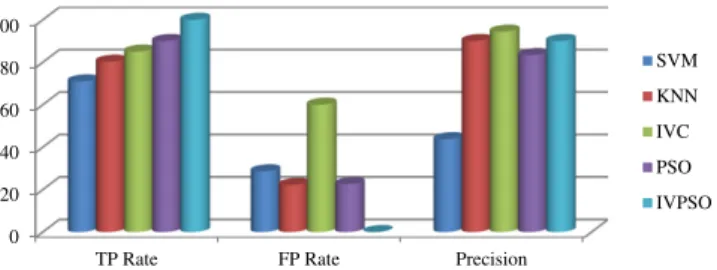
the leukemia datasets.Table 2.1shows the results for the leukemia
dataset andFig. 2shows the performance comparison of existing and
proposed algorithms for the leukemia dataset. 2.2. Results on the breast cancer dataset
To further test the performance of the proposed method the breast cancer dataset is used for comparison, and it is collected from the UCI Repository. Here the dataset consists of 69 samples from human cancer cell lines. The breast cancer dataset spans nine classes and gene
expression levels were measured for 769 genes. The prediction accuracy of 74.86 is reported in reference using one-versus-the rest IVC with 150 selected genes. To test the proposed algorithm on an external dataset, 43 samples are used for the training dataset while 18 samples as the testing dataset. Based on 150 genes selected and 12 genes selected by
PSO, the classification accuracy report of all the compared algorithms
can be predicted. The correctly classified instance for the breast cancer
dataset is 7.2 and incorrectly classified instance is 2.8. Consistent with the results on the breast cancer dataset in this experiment, the proposed
method also achieved the highest classification accuracy. ThusTable 2.2
shows the results for the breast cancer dataset andFig. 3shows the
performance comparison of existing and proposed algorithms for the breast cancer dataset.
2.3. Results on the lung cancer datasets
The performance of the proposed algorithm is calculated by using the lung cancer dataset and it can be collected from the UCI Repository which consists of 61 samples from human cancer cells. In the lung can-cer dataset, the class and gene expression levels were measured for 462 genes. The prediction accuracy of IVC is 70.55 with 72 instances and 32 attributes. To test the proposed algorithm, a dataset of 43 samples was used for the training dataset and 32 samples as the testing dataset.
The correctly classified instance for the lung cancer dataset is 7.2 and
the incorrectly classified instance is 2.8. Consistent with the results on the lung cancer dataset in this experiment, the proposed method also
achieved the highest classification accuracy. ThusTable 2.3shows the
results for the lung cancer dataset andFig. 4shows the performance
comparison of existing and proposed algorithms for the lung cancer dataset.
2.4. Results on blood cancer datasets
The performance of the proposed algorithm is also measured using the blood cancer datasets and it can be collected from the NCBI data-base. Blood cancer is an umbrella term for cancers that affect the bone marrow, blood and lymphatic system. In this dataset a total of 399 in-stances and 18 attributes were used. In this analysis, the data are based on class distribution. In 339 instances, to test the proposed algo-rithm a dataset of 48 samples were used for the training dataset and
36 samples as the testing dataset. The correctly classified instance is
7.8 and the incorrectly classified instances are 2.2. Consistent with the
results on the blood cancer dataset with this experiment, the proposed
method also achieved the highest classification accuracy. ThusTable 2.4
shows the results for the blood cancer dataset andFig. 5shows the
Table 2.1
Performance comparison of existing and proposed methods for the leukemia dataset. Algorithms/performance metrics TP rate FP rate Precision Accuracy Support Vector Machine 70.97 28.61 43.75 69.01
K-Nearest Neighbor 80.27 22.2 90.0 71.28
Interval Valued Classification 85.0 60.0 94.4 78.26 Particle Swarm Optimization 90.0 22.6 83.35 81.8 Interval Value based Particle
Swarm Optimization
100 0.0 90.0 96.88
Table 2.2
Performance comparison of existing and proposed methods for breast cancer dataset. Algorithms/performance metrics TP rate FP rate Precision Accuracy Support Vector Machine 71.26 29.45 70.75 71.87
K Nearest Neighbor 76.8 27.24 75.95 67.29
Interval Valued Classification 80.1 25.24 75.66 74.86 Particle Swarm Optimization 82.8 20.86 79.87 84.63 Interval Value based Particle
Swarm Optimization
performance comparison of existing and proposed algorithms for the blood cancer dataset.
2.5. Discussion
From the experimental results it is inferred that for the leukemia dataset the proposed IVPSO algorithm performs 29.03% better than the SVM algorithm, 19.73% better than the KNN algorithm, 15% better than the IVC algorithm and 10% better than the PSO algorithm. For the breast cancer dataset the proposed IVPSO algorithm performs 20.96% better than the SVM algorithm, 14.82% better than the KNN algorithm, 11.16% better than the IVC algorithm and 8.16% better than the PSO al-gorithm. And for the lung cancer dataset the proposed IVPSO algorithm performs 20.11% better than the SVM algorithm, 12.82% better than the KNN algorithm, 11.26% better than the IVC algorithm and 6.69% better than the PSO algorithm. Finally, for the blood cancer dataset the pro-posed IVPSO algorithm performs 18.78% better than the SVM algorithm, 11.4% better than the KNN algorithm, 30.78% better than the IVC
algorithm, and 3.72% better than the PSO algorithm. ThusFig. 1shows
the comparison of accuracy for the leukemia, breast cancer, and lung cancer and blood cancer datasets for the existing and proposed algorithms.
(1) The accuracy of the classification is highly dependent on the
clas-sification method. For instance, with the gene set selected by the
PSO method, the IVPSO classifier has an accuracy of 96.88% on the
ALL–AML dataset, the average classification accuracy.
IVPSO is 96.88%NSVM is 69.01%NKNN is 71.28%NIVC is 82.6%.
It is observed that proposed IVPSO method gets the best performance.
(2) The accuracy of the classification is also highly dependent on the
selected gene set. When the genes are selected by the PSO
meth-od, the SVM classifier has an accuracy of 91.41% on the ALL–
AML-3 dataset. On the same dataset with the gene set selected by the
IVR method, the accuracy of SVM is 97.27%. This significant
dif-ferential accuracy between the gene selection method of PSO and IVC also occurs in the other classifiers.
(3) It achieves better performance than any of the other classifiers. It is conceivable that feature selection raises the accuracy since it
can reduce the number of insignificant dimensions, thereby
overcoming the curse of dimensionality. This appears to be the
case for the KNN and SVM classifier methods. The accuracy of
KNN, Decision Tree and SVM is improved on the two datasets with genes selected by the PSO method.
(4) Remarkably, with the aid of feature selection, IVC achieves a
96.88% accuracy on the ALL–AML dataset and 92.24% accuracy
on the breast cancer dataset. For the SVM method, it is possible to achieve very high accuracy on most of the microarray datasets
[24]. However, the best performance on the experimental
datasets does not outperform the IVPSO method.
From the results shown inTables 2.1–2.4, it is inferred that the
IVPSO is the best method for sample classification based on
gene expression. It achieves better performance than any of the
other classifiers. This appears to be the case for the SVM, KNN
and IVC classifier methods. The accuracy of SVM, KNN and IVC
is improved on the four datasets with genes selected by the dif-ferent methods. For the SVM method, it is possible to achieve
very high accuracy on most of the microarray datasets[24].
These four datasets have smaller sample sizes than those of the other datasets, so one may conclude that multiclass classification based on gene expression can be effectively solved when the sample size is large. Although it is widely used in text categoriza-tion in order to perform very well for tissue classification based on gene expression using the standard feature selection method
[24]. From the experimental results above, this research
con-cludes that the proposed approach is superior to other methods. This may be due to the following advantages: interval-value based particle swarm optimization, minimum redundancy of
the selected gene subset and simple classifiers.
The experimental results show that our proposed method has
supe-rior performance. Consecutively, in this work a new classification
algo-rithm is proposed to classify the leukemia datasets. The tables and graphs represent the comparison of performance measures for the datasets such as leukemia, breast cancer, lung cancer and blood cancer.
We analyzed and compared the performance of existing classification
algorithms such as SVM (Support Vector Machines), KNN (K Nearest
Neighbor), and Interval-valued Classification (IVC), Particle Swarm
Op-timization (PSO) and the proposed PSO-IVC (Particle Swarm
Optimiza-tion–IVC). The performance is evaluated by using the parameters such
as accuracy, precision, true positive rate and false positive rate. From the experimental results it is inferred that the proposed method works better than the existing systems for classifying the datasets.
3. Gene selection and tissue sample classification methods
The particle swarm optimization is a computational method which optimizes a problem by continuously trying to enhance a candidate so-lution with regard to a given measure of quality. In every iteration pro-cess, each candidate solution is calculated by the objective function being optimized, deciding thefitness of that solution. Every particle pre-serves its position, composed of the candidate solution and its evaluated fitness, and its velocity.
3.1. Gene selection
Based on the Interval Value Based Particle Swarm Optimization, we present a method to select the genes & tissue.
Algorithm IVPSO
Table 2.3
Performance comparison of existing and proposed methods for lung cancer dataset. Algorithms/performance metrics TP rate FP rate Precision Accuracy Support Vector Machine 71.30 28.4 71.4 70.55
K Nearest Neighbor 77.8 26.24 73.95 65.29
Interval Valued Classification 79.19 24.08 76.67 79.03 Particle Swarm Optimization 83.27 21.03 79.83 80.02 Interval Value based Particle
Swarm Optimization
89.24 19.42 82.12 94.68
Table 2.4
Performance comparison of existing and proposed methods for the blood cancer dataset. Algorithms/performance metrics TP rate FP rate Precision Accuracy
Support Vector Machine 66 22.2 70 66.66
K Nearest Neighbor 72 25 72.3 72.82
Interval Valued Classification 56.25 43.75 81.2 78.26 Particle Swarm Optimization 78.6 22.1 79.2 80.26 Interval Value based Particle
Swarm Optimization 81.26 18.19 83.6 90.86 0 20 40 60 80 100
SVM KNN IVC PSO IVPSO
Classification accuracy Algorithms LEUKEMIA BREAST CANCER LUNG CANCER BLOOD CANCER
Fig. 1.Comparison of accuracy on the leukemia, breast cancer, lung cancer and blood can-cer datasets.
1. Initialize N number of particles in the swarm, each particle having a positionxiand velocityvi. Let pBest be the best known position of particle i and gbest as the best known position of the entire swarm 2. Initialize the particle's positionxi
3. For each particlei= 1, 2,…N
4. Calculatefitness value for every particle
5. Iffitness value is better than the bestfitness value (pBest) 6. Set current value as the new pBest
7. Until a termination criterion is met
8. Select the particle with bestfitness value of all particles as the gbest 9. For every particle
10. //Calculation of particle velocity
11. viðtþ1Þ ¼wvið Þ þt c2r2½~xıð Þt−xið Þt þc2r2½g tð Þ−xið Þt //Where,
the index of the particle is represented byi,við Þt is the velocity of
particleiat timet,xið Þt is the position of particleiat timet; the
pa-rameters w, c1, and c2 are coefficients
12. Update particle position 13. xiðtþ1Þ ¼xið Þ þt viðtþ1Þ
Until some stopping conditions are met.
4. Preliminaries 4.1. Microarray dataset
A microarray dataset is a gene expression data, in which each col-umn represents a gene and each row represents a sample with a class
label. Let G = {g1,… …, gn} be a set of genes and U = {s1,……, sm}
be a set of samples. The corresponding gene expression matrix can be represented, as m is the number of samples and n is the number of
genes. The matrix X is composed of m row vectorsi= 1,2,….,m. Each
vector in the gene expression matrix may be regarded as a point in n-dimensional space, and each of the n columns consists of an m-element expression vector for a single gene.
4.2. Particle Swarm Optimization
Particle Swarm Optimization wasfirst proposed by Kennedy and
Eberhart in 1995[13]. PSO is a population based evolutionary algorithm
inspired by the social behavior of birdflocking orfish schooling. In the
description of PSO, the swarm is made up of a certain number of parti-cles (similar to population of individuals in EAs). At each iteration, all
the particles move in the problem space tofind the global optima.
Each particle has a current position vector and a velocity vector for directing its movement.
The particle swarm optimization is a computational method which optimizes a problem by continuously trying to enhance a candidate so-lution with regard to a given measure of quality. In every iteration pro-cess, each candidate solution is calculated by the objective function being optimized, deciding thefitness of that solution. Every particle pre-serves its position composed of the candidate solution and its evaluated fitness along with its velocity. Furthermore, it considers the bestfitness value, which has been accomplished during the process of the algorithm that which is referred to as the individual bestfitness, and the candidate solution that achieved thisfitness, which is referred to as the individual
best position. At last, the PSO algorithm maintains the bestfitness value
accomplished among all particles in the swarm, called the global best
fitness, and the candidate solution that achieved thisfitness, called the
global best position or global best candidate solution. vkþ1 id ¼wv k idþc1rand1ðÞ pkid−xkid þc2rand2ðÞ pkgd−xkidÞ 1 xkþ1 id ¼x k idþv kþ1 id 2 p !kþ1 id ¼ x !kþ1 i :Fitness x! kþ1 i Nf itness p!kiþ1 p !k i :Fitness x! kþ1 i Nf itness p!kiþ1 8 < : 3 p !kþ1 i ¼arg maxpi!p kþ1 i : 4
PSO optimizes a problem by having solutions, here dubbed particles, and moving these particles around in the search-space according to simple mathematical formulae over the particle's position and velocity.
Each particle's movement is influenced by its local best known position
and is also guided toward the best known positions in the search-space, which are updated as better positions are found by other particles. This is expected to move the swarm toward the best solutions. Although the proposed method was originally designed for microarray data analysis,
0 20 40 60 80 100
TP Rate FP Rate Precision
SVM KNN IVC PSO IVPSO
Fig. 2.Performance comparison of existing and proposed methods for the leukemia dataset. 0 20 40 60 80 100
TP Rate FP Rate Precision
SVM KNN IVC PSO IVPSO
Fig. 3.Performance comparison of existing and proposed methods for the breast cancer dataset. 0 10 20 30 40 50 60 70 80 90
TP Rate FP Rate Precision
SVM KNN IVC PSO IVPSO
Fig. 4.Performance comparison of existing and proposed methods for the lung cancer dataset. 0 10 20 30 40 50 60 70 80 90
TP Rate FP Rate Precision
SVM KNN IVC PSO IVPSO
Fig. 5.Performance comparison of existing and proposed methods for the blood cancer dataset.
it can be applied to the data from the next generation sequencing technologies. p !kþ1 i ¼arg maxpi!p kþ1 i xkidþ1¼x k idþv kþ1 id : 5
Eqs. (1) and (2)describe the velocity and position update of a given particle i at a certain iteration k.Eq. (1)calculates a new velocity vi for each particle (potential solution) based on its previous velocity, the
particle's location at which the bestfitness so far has been found p
Best i, and the population global (or local neighborhood, in the
neigh-borhood version of the algorithm) location at which the bestfitness so
far has been achieved. Individual and social weights are represented by means of‘1 and 2’factors respectively. Finally, positions are random
numbers in range {0, 1}, and represent the inertia weight factor.Eq. (6)
updates each particle's position xi in solution Space. 4.3. Assessment metrics in the leukemia datasets.
Usually, the accuracy rate inEq. (6)is the most frequently used
mea-sure in assessment metrics. But in the framework of the leukemia datasets, the accuracy is a proper measure, because it distinguishes
be-tween the numbers of correctly classified examples of different classes.
Acc¼TPþTPFNþþTNFPþTN 6
TP rate¼TPTPþFN 7
FP rate¼FPFPþTN 8
Pre¼TPTPþFP 9
True positive rate TPRð Þ ¼TP=P 10
P¼ðTPþFNÞ 11
where, P is Positive and TP is the True Positive.
5. Conclusion and future prospects
This research work proposed a combination method of Particle
Swarm Optimization and interval valued classification based gene
selec-tion and sample classification. This approach reduces the number of
genes selected and increases the classification accuracy in terms of
cor-rectly and incorcor-rectly classified instances. Many methods have been
proposed to solve this problem. But in this research work, performance
analysis has been done on various classifiers such as the SVM, KNN, PSO,
IVC and IVPSO. The proposed gene selection method can improve the
performance of the IVPSO classification method to achieve an accuracy
of 96.88%. Based on the classification and comparison results, the
pro-posed algorithm performs better than other algorithms. The correctly
and incorrectly classified instances also have been detected. For all the
datasets the proposed algorithms perform better than the existing methods in the case of numerical datasets. From the experimental anal-ysis it is inferred that for all the datasets the proposed IVPSO algorithm
performs better than the existing classification algorithms.
The proposed classification technique can be easily extended to any
other applications different from the leukemia dataset problem. In fu-ture, this method can be combined with any evolutionary algorithms
to get a new and more powerful classification algorithm, and it can
also be extended along with different classification techniques. In the
future it can also be solved on other datasets, and in the future it can be extended to modify the Interval Value based Particle Swarm Optimi-zation algorithm to obtain more effective results by using different
pa-rameters. IVPSO classification, for instance, can be well suited for gene
selection and differentfiltering techniques. Since this task requires
rapid model updates with high level of accuracies, IVPSO can be a good choice.
Conflict of interest
The authors declare that there are no conflicts of interest.
References
[1] N. Barkai, D. Notterman, K. Gish, S. Ybarra, D. Mack, A.J. Levine, Broad patterns of gene expression revealed by clustering analysis of tumor and normal colon tissues probed by oligonucleotide arrays. Proc. Natl. Acad. Sci. U. S. A. 96 (1999) 6745–6750. [2] Baxevanis, B.F.F. Ouellette, Bioinformatics:“A Practical Guide to the Analysis of
Genes and Proteins”. 2nd ed. John Wiley & Sons, 2001.
[3] A. Ben-Dor, L. Bruhm, Friedman, Tissue classification with gene expression profiles. Comput. Biol. (2000) 559–584.
[4] Y. Qi, X. Yang, Interval-valued analysis for discriminative gene selection and tissue sample classification using microarray data. Genomics 101 (2013) 38–48. [5] A. Statnikov, C. Aliferis, I. Tsamardinos, D. Hardin, S. Levy, A comprehensive
evalua-tion of multicategory classification methods for microarray gene expression cancer diagnosis. Bioinformatics 21 (5) (2005) 631–643.
[6] C. Cortes, V. Vapnik, Support vector networks. Mach. Learn. 20 (3) (1995) 273–297. [7] D.A. Salem, R.A.A.A. AbulSeoud, H.A. Ali, A new gene selection technique based on hybrid methods for cancer classification using microarrays. Int. J. Biosci. Biochem. Bioinforma. 1 (4) (November 2011).
[11]T.R. Golub, D.K. Slonim, Tamayo, Classification of cancer: class discovery and class prediction by gene expression monitoring. Science 286 (1999) 315–333. [13] H. Hong, J. Li, H. Wang, G. Daggard, Combined gene selection methods for
microar-ray data analysis knowledge-based intelligent information and engineering systems. Lect. Notes Comput. Sci. 4251 (2006) 976–983.
[14] I. Guyon, J. Weston, Stephen, V. Vapnik, Gene selection for cancer classification using support vector machines. Mach. Learn. 46 (2002) 389–422.
[15] J. Jaeger, R. Sengupta, Ruzzo, Improved gene selection for classification of microar-rays. Pac. Symp. Biocomput. (2003) 53–64.
[22] A. Statnikov, C. Aliferis, I. Tsamardinos, D. Hardin, S. Levy, A comprehensive evalua-tion of multicategory classification methods for microarray gene expression cancer diagnosis. Bioinformatics 21 (2005) 631–643.
[24] T. Li, C. Zhang, M. Ogihara, A comparative study of feature selection and multiclass classification methods for tissue classification based on gene expression. 2004. 2429–2437.