R E S E A R C H A R T I C L E
Open Access
The effect of improving task representativeness
on capturing nurses
’
risk assessment judgements:
a comparison of written case simulations and
physical simulations
Huiqin Yang
1*, Carl Thompson
2, Robert M Hamm
3, Martin Bland
2and Alison Foster
2Abstract
Background:The validity of studies describing clinicians’judgements based on their responses to paper cases is questionable, because - commonly used - paper case simulations only partly reflect real clinical environments. In this study we test whether paper case simulations evoke similar risk assessment judgements to the more realistic simulated patients used in high fidelity physical simulations.
Methods:97 nurses (34 experienced nurses and 63 student nurses) made dichotomous assessments of risk of acute deterioration on the same 25 simulated scenarios in both paper case and physical simulation settings. Scenarios were generated from real patient cases. Measures of judgement‘ecology’were derived from the same case records. The relationship between nurses’judgements, actual patient outcomes (i.e. ecological criteria), and patient characteristics were described using the methodology of judgement analysis. Logistic regression models were constructed to calculate Lens Model Equation parameters. Parameters were then compared between the modeled paper-case and physical-simulation judgements.
Results:Participants had significantly less achievement (ra) judging physical simulations than when judging paper
cases. They used less modelable knowledge (G) with physical simulations than with paper cases, while retaining similar cognitive control and consistency on repeated patients. Respiration rate, the most important cue for predicting patient risk in the ecological model, was weighted most heavily by participants.
Conclusions:To the extent that accuracy in judgement analysis studies is a function of task representativeness, improving task representativeness via high fidelity physical simulations resulted in lower judgement performance in risk assessments amongst nurses when compared to paper case simulations. Lens Model statistics could prove useful when comparing different options for the design of simulations used in clinical judgement analysis. The approach outlined may be of value to those designing and evaluating clinical simulations as part of education and training strategies aimed at improving clinical judgement and reasoning.
Keywords:Written case simulation, Physical simulation, Representative design, Clinical judgement analysis, Risk assessment, Lens model equation, Logistic regression, Clinical vignettes
* Correspondence:[email protected] 1
Centre for Reviews and Dissemination, University of York, York YO10 5DD, UK
Full list of author information is available at the end of the article
Background
Judgement analysis (JA) has a long history as a means of examining the judgement strategies and performance of clinicians. The theoretical basis for judgement analysis is the Lens Model proposed by Brunswik [1] and developed by Hammond et al. [2-4]. Applied to clinical judgement, the Lens Model describes an individual clinician’s judge-ments and the clinical environment using comparable models [5], providing a rigorous conceptual and empirical approach for understanding the task, a clinician’s judge-ments and unpacking the accuracy of those judgejudge-ments.
Assume we have data about a set of patients sampled from a clinical setting (an ecology). Assume also, we have information on their clinical features and know what hap-pened to them (a criterion, such as death or an adverse event). A clinician’s predictions of that criterion are based on the same clinical features. The Lens Model Equation describes the reliability and the accuracy of the clinician’s judgement via five decompositional concepts [6]: predict-ability (Re); cognitive control (Rs); achievement (ra); policy matching (G); and unmodeled knowledge (C). Predictabil-ity (Re) reflects the degree to which a model predicts the value of the ecological criterion from the clinical features. Cognitive control (Rs) reflects how well a similar model predicts the clinician’s judgements based on the same fea-tures; Rs examines the consistency with which the clin-ician applies a policy to their judgments. Achievement (ra) measures the correspondence between the person’s judge-ments and the ecological criterion, i.e., the judgement ac-curacy. Policy matching (G) reflects the degree to which the clinician’s judgement model captures the modeled component of the ecology. Unmodeled knowledge (C) measures the degree to which the residuals from the model of the clinician’s judgements reflect the unmodeled (residual) components of the ecology.
Judgement analysis is a powerful decompositional tool but using it requires the researcher to overcome a signifi-cant methodological challenge: its generalisability depends on how well the tasks used as the basis for modeling a person’s judgement represent the conditions in which such judgements are usually made [7-9]. Clinical judge-ment analysts typically use paper-based scenarios. While paper cases have the advantage of ease of administration [10,11], their ability to evoke judgements that are similar to clinicians’ responses to actual judgement situations is questionable [12-14]. Format also shapes the cognitive ef-fort invested in processing a task [13]; reflected, for ex-ample, in the amount of information subjects use [15-17]. Clinical practice presents large numbers of cues percep-tually and simultaneously, which may induce intuitive judgement [3,18]. Collecting visual and other perceptual/ sensory information is a crucial component of the clinical judgement process in clinicians. Using non-sensory cues, or sensory cues converted to a written format (as proxies
for the“real thing”), e.g., paper cases rather than physical patients to present information to clinicians, may not ad-equately evoke the cognition used in clinical environ-ments. Thus, paper case simulations may threaten the validity of the results of a judgement analysis.
In contrast, high fidelity physical simulations (for ex-ample, using computerized patient simulators) make use of more perceptual cues and so may generate more rep-resentative (and thus generalizable) judgement models. Computerized patient simulators have the potential to en-hance the fidelity of simulations and foster task represen-tativeness in JA. Computerized patient simulators are able to recreate observable physiological information cues such as audible heart and breath sounds along with displays of common physiological data on the bedside monitor [19-21].
Given the limitations of traditional paper-based ap-proaches, we explored the potential of high fidelity phys-ical simulations for examining nurses’ risk assessment judgements identifying patients at risk of deterioration in acute care settings. This is a judgement that health care professionals, including nurses, do not always perform op-timally; physiological deterioration is often unrecognised, inadequately and/or inappropriately treated [22-24]. Early recognition of important changes in physiological parame-ters is critical if ‘failure to rescue’and/or a critical event such as cardiac or respiratory arrest is to be avoided [25]. In using risk assessment as the“test bed” for our model-ing, we aimed to test the hypothesis that high fidelity physical simulations - by realistically simulating naturally occurring clinical information - can prompt more realistic nurse judgements than paper cases. We can test this hy-pothesis by comparing the Lens Model Equation parame-ters derived from the paper cases and the high fidelity physical simulations.
Methods
Study design
Construction of clinical scenarios
Real patient cases were sampled from a data set of emer-gency admissions (n = 673) collected prospectively in the Medical Admissions Unit of a single NHS District Gen-eral Hospital during March 2000 by Subbe et al. [28]. Al-though the original dataset from which the scenarios were constructed was collected in 2000, there is little rea-son to believe that the relationship between patients’ physiological parameters and outcomes has changed significantly. Certainly, the judgement of“risk of deteri-oration” was, and remains, an important one. The eco-logical criterion (‘at risk’or ‘not at risk’) was determined from the patient dataset; classifying patients as‘at risk’if later they died, were admitted to Intensive Care Unit (ICU)/High Dependency Unit (HDU) or experienced car-diopulmonary resuscitation. A stratified random sample based on whether the patients had an acute deterioration or not was used to select clinical scenarios from the dataset records for use in the judgement task. We used 5 clinical cues in the construction of clinical scenarios for assessing a patient at risk of acute deterioration: systolic blood pressure, heart rate, respiratory rate (RR), tem-perature, and levels of consciousness. These 5 cues are identified as valid by a NICE clinical guideline [29], and all are widely used in rapid assessments of risks in critical care patients [30].
Scenario sample size
Ten‘at risk’cases and 10‘not at risk’cases were sampled, using a random number generator. Participants were shown 25 scenarios, including 5 repeated cases. The rep-etitions (3 ‘at risk’ patients and 2 ‘not at risk’) were in-cluded in the pool of 25 clinical scenarios to enable consistency checking. Cooksey [26] recommends a ratio of 5 to 10 scenarios per cue in judgement analysis as a desirable basis for sample size estimation. Our sample was not adequate for analysis of all 5 cues because: the cues were highly intercorrelated; Cooksey’s rule of thumb arguably does not apply to the 5 repeated cases; and the rule is proposed for multiple linear, rather than multiple logistic, regression.
Characteristics of cues
Patient features for sampled cases are given in Tables 1 and 2. The intercorrelations among the 5 cues and the“at
risk”criterion for the sampled cases showed that six pairs of cues were significantly correlated (0.475 to 0.616). Four cue intercorrelations in the patient cases were large (r > =0.50) and 2 were moderate (r > =0.30) [31].
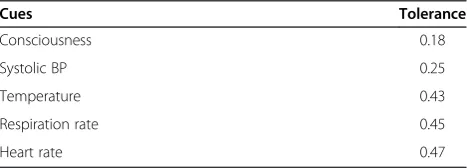
Table 3 illustrates cue multicollinearity using the toler-ance statistic [32]. If the tolertoler-ance is small, the variable is almost a perfect linear combination of the other cues, and should be excluded from regression equations [32]. Rules of thumb are variously that tolerance under 0.10, or 0.20 [32], or 0.40, is worrisome [33], and that the cut-off should be higher when the sample is small. These considerations suggest that multicollinearity between cues in the sampled patients may affect the accuracy of regression models.
Participant sample size
We used previous research [34] to estimate the standard deviation (0.14) of participants’ mean raof 0.43 for risk assessments in paper scenarios. These correlations were normalized using Fisher’s Z transformation [35]. Using the method suggested by Bland [35], and assuming that the correlation coefficient between paired measurements of participants in paper case and physical simulation sce-narios is 0.8, the detectable difference in mean correl-ation coefficients (ra) would be 0.02. This relatively small difference would be detected with power 0.90 and a sig-nificance level of 0.05 (two-sided) with 90 people. An es-timated sample size of 90 participants was therefore adequate. Given the higher recruitment costs associated with experienced nurses compared to student nurses, a ratio of 2 students for every experienced nurse was used as the basis for recruitment. Using moderately unequal independent samples has little compromising effect on statistical power [36].
Sampling participants and ethical approval
We sampled 34 experienced nurses from the critical & acute care registered nurse population in North York-shire hospitals and 63 student nurses from the under-graduate (2nd and 3rd year) student nurse population in the Department of Health Sciences at the University of York, UK. Each participant received a letter and research information sheet inviting them to participate. Ethical approval was obtained from the Health Sciences Re-search Governance Committee of the University of York,
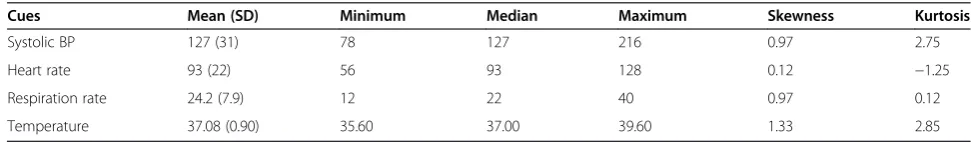
Table 1 Distributional characteristics of cues: the continuous cue variables for the patient cases (N = 20)
Cues Mean (SD) Minimum Median Maximum Skewness Kurtosis
Systolic BP 127 (31) 78 127 216 0.97 2.75
Heart rate 93 (22) 56 93 128 0.12 −1.25
Respiration rate 24.2 (7.9) 12 22 40 0.97 0.12
UK. All nurses completed a written informed consent document.
Presentation of clinical scenarios
Paper scenarios
For the paper cases, a clinical vignette booklet was designed to present background clinical information for a generic emergency patient, and then 25 clinical scenarios containing varying cue values for specific patients (see Additional file 1). Clinical cues were presented in natural units such as mmHg (for systolic blood pressure), beats per minute (heart rate), breath per minute (respiratory rate) and degree Celsius (°C) (temperature). Patient con-sciousness was represented using three levels: alert (A), reacting to voice (V), and reacting to pain (P). The format and content were approved by a critical care specialist nurse with more than 10 years specialist experience.
High fidelity physical simulation
The clinical simulation lab in the Department of Health Sciences of the University of York, UK was used to re-create an emergency medical admission unit environ-ment (see Figure 1). The computerized patient simulator (Laerdal ™SimMan) was used to recreate the same 25 clinical scenarios used in the paper case scenarios. The same patient background clinical information was outlined on a whiteboard in the simulated high depend-ency room.
The computerized patient simulator was used to repre-sent the same physiological cues used in the paper cases: systolic blood pressure, heart rate, respiratory rate,
temperature, and consciousness. The numerical values of the first 4 cues were presented in the bedside monitor, displayed in a way that is identical to real practice settings (see Figure 1). Respiration sounds were emitted by the computerized patient simulator, synchronized with the bedside monitor. Consciousness level was represented by different vocalizations. The consciousness level of alert was represented by the vocalization, “Oh, I feel really ill.” Reacting to voice was represented by,“Ouch! Where is my wife? Get off me! Get off Me!”Reacting to pain was repre-sented by a moan. The development of the vocal sounds to denote levels of consciousness was undertaken with the help of the nurse specialist in critical care and simulation. Prior to making the judgements, all participants were in-formed what level of consciousness each vocal sound rep-resented. They were instructed to use all the information, including the vital signs shown on the bedside monitor as well as the vocalized consciousness level and breath sounds of the computerized patient simulator. Participants were given the same amount of time for both paper-based and physical simulation scenarios.
Capturing judgements
Participants were asked to judge whether the simulated patient is at risk of acute deterioration (yes ‘at risk’/no
‘not at risk’) for each patient scenario on a data collec-tion sheet in both paper case simulacollec-tion and high fidelity physical simulation conditions. In paper case simula-tions, participants were invited to a classroom in the University of York to complete the clinical vignette questionnaire. In high fidelity physical simulations, three to five participants at a time were invited to conduct the experiment simultaneously. A researcher was respon-sible for giving an introduction to the experiment. In both conditions, all the participants were told to make a
‘yes’ judgement on risk of acute deterioration if he/she judged that the patient would later die, experience
Table 2 Distributional characteristics of cues: the categorical cue of consciousness level for the patient cases (N = 20)
Levels of consciousness Frequency (percentage)
Alert 13 (65%)
Reacting to voice 5 (25%)
Reacting to pain 2 (10%)
Table 3 Multicollinearity diagnostics (tolerance) for the patient cases (N = 20)
Cues Tolerance
Consciousness 0.18
Systolic BP 0.25
Temperature 0.43
Respiration rate 0.45
Heart rate 0.47
Note: Tolerance is 1–R2
, the complement of the proportion of variance explained in a multiple linear regression predicting the cue from all the other cues.
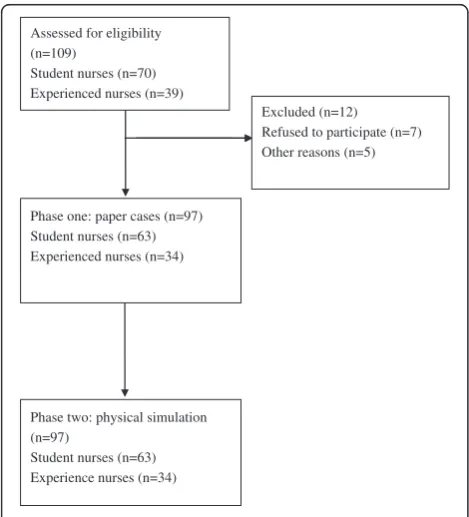
cardiopulmonary arrest or be admitted to ICU/HDU for intensive interventions. Prior to the experiment, all the participants were fully orientated to the simulation facil-ities and all participants confirmed that they were famil-iar with the judgement task environment based on their previous clinical or learning experience; all participants conformed that they clearly understood the risk assess-ment judgeassess-ment task required of them. Nurses were en-couraged to make their judgements in the same way they would in real practice. Participants independently made all their judgments without discussion during the physical simulation sessions. The design of this study and flow of the participants through it is presented in Figure 2. The data were collected in 2009 with primary and supplementary analyses conducted between 2009 and 2012.
Data analysis
Analysis of Lens Model Equation parameters
Logistic regression models of the relationship between the outcome measure judged by the nurse and cues in the sce-narios were constructed. The outcome variable was the participant’s dichotomous judgements (yes/no) while the predictors were the information cues in scenarios. Logis-tic regression analysis was also used to derive a model predicting the ecological criterion (yes/no) with the pre-dictors being the same cues as in the judgement model. Model predictions are the probabilities of the “yes” category.
The statistics of the Logistic Lens Model Equation were examined using the following formula [37]:
ra¼GσσY~e Ye
σY~s
σYs
þC1σZ~e
σYe
σZ~s
σYs
þC2σY~e
σYe
σZ~s
σYs
þC3σZ~e
σYe
σY~s
σYs
ð1Þ
In the first section, the term
G¼rY~eY~s ð2Þ
is the correlation between the predicted judgement of the participant, the estimated probability the participant assesses the patient as“at risk,”and the predicted criter-ion of the ecology, the estimated probability the patient was“at risk”. The portion of the equation
C1¼rZ~eZ~s ð3Þ
is the correlation between the residuals of the two re-gression equations, e.g., 1–p(“at risk”). Component
C2¼rY~eZ~s ð4Þ
is the correlation between the predicted criterion prob-ability and the residuals of the participant’s regression model. In the final part,
C3¼rZ~eY~s ð5Þ
is the correlation between the predicted probability from the participant’s model and the residuals of the eco-logical regression model. In the formula (1), the Lens Model Equation correlation indices (G, C1, C2, and C3) are multiplied by the ratios of computed standard devia-tions of actual values, predicted values and their resid-uals in either the ecological or the judgement model. The first product can be considered the proportion of the participant’s achievement which is explained by the model.
To investigate each participant’s accuracy, functional achievement was represented by the correlation (ra) be-tween the participant’s judgements (Ys) and the true values (Ye) [38]. In the linear Lens Model Equation, the ecological predictability (Re) was derived from the cor-relation between the true values (Ye) and the predicted values Y^e of the ecological model. Cognitive control (Rs) was calculated from the correlation between the
participant’s judgements (Ys) and the predicted values
^
Ys of the participant’s model. In the logistic Lens
Model Equation, the analogous concepts are represented by the ratios of the standard deviation of the model pre-diction (the category probability) over the standard devi-ation of the data.
The logistic regression models for the ecology and for many of the participants were associated with large Phase one: paper cases (n=97)
Student nurses (n=63) Experienced nurses (n=34)
Excluded (n=12) Refused to participate (n=7) Other reasons (n=5)
Phase two: physical simulation (n=97)
Student nurses (n=63) Experience nurses (n=34) Assessed for eligibility (n=109)
Student nurses (n=70) Experienced nurses (n=39)
standard errors. The large standard errors in the models suggest that the scenario sample size was inad-equate for the logistic regression models, particularly given the degree of cue intercorrelation. To allow all as-pects of the Lens Model Equation analysis, including relative cue weights, we chose for this report to ignore the cue that had the highest intercorrelation with the other cues, the patient’s level of consciousness. To pro-duce relative weights, stepwise logistic regression was done for each participant with adjustment of thresholds for retention of predictors - if necessary - until a solu-tion was found in the model where regression coeffi-cients did not have high standard errors. Cues not entered were assigned 0 weight. In this way it was possible to produce all the Lens Model Equation pa-rameters and relative weights for each participant. Re-gression analyses were conducted using SPSS version 19 (www.spss.com).
Comparisons of Lens Model Equation parameters
The Lens Model Equation parameters ra;G;σσY s~
Y sand
σZ s~ σY s
of nurses’ risk assessments were compared between the paper case simulations and high fidelity physical simula-tions. Lens Model Equation parameters (ra, G) are corre-lations, and so not normally distributed; Fisher’s z transformation [35] normalizes them, and allows for undertaking Student’s t tests. Wilcoxon matched-pairs signed-ranks test was used to test for the significance of
the median difference in the parameters σY s~
σY sand
σZ s~ σY s
be-tween the paper case simulation and physical simulation conditions. Comparisons of Lens Model Equation pa-rameters were conducted using SPSS and Stata 10 (www.stata.com).
Relative weights
The logistic regression software provides only unstan-dardized regression coefficients, so we stanunstan-dardized them using the formula
βi¼BiSDSDXi
Y ð6Þ
where Bi is the unstandardized coefficient, βi the stan-dardized, and SDXi the standard deviation of cue i. Cooksey [26] notes that the standard deviation of the di-chotomous dependent variable, SDY, has questionable meaning. However, theSDYterm is cancelled out in the next step, normalization
βi
∑
j βj ð7ÞThe original sign of the relative weight is restored by multiplying byβi/|βi|, i.e., by 1 or−1, yielding
RWi¼
∑
βi j βjð8Þ
It should be noted that with the logistic regression models, the stepwise model used to create relative weights was not necessarily the same as the model used to create the Lens Model Equation parameters, because a model with a non-unique solution can nonetheless produce the predictions needed for Lens Model Equa-tion correlaEqua-tions.
Analysis of judgement consistency
Judgement consistency was examined using Phi coeffi-cients on 5 repeated cases drawn from the pool of 25 scenarios. The Phi coefficient [39], a chi-square based measure of association, measures the degree of the asso-ciation between two binary variables. The Phi coefficient has important advantages over other approaches, e.g., Cohen’s Kappa Statistic [40]. The Phi statistic estimates the chance-independent agreement between nurses’ judgements using data from a 2 × 2 table.
The statistical significance of differences between Phi coefficients was examined by parametric bootstrap simu-lations on the distribution of differences for two Phi co-efficients measures. This was conducted using Stata 10’s bootstrap procedure. Bootstrap standard errors (SE) for the difference of Phi measures between groups were generated using 50 bootstrap replications; between 50 and 200 replications are generally adequate for estimates of bootstrap standard error [41,42].
Results
Participants
fidelity physical simulation environment was similar to their practice environments.
Differences between parameters of paper case based and physical simulation based judgements
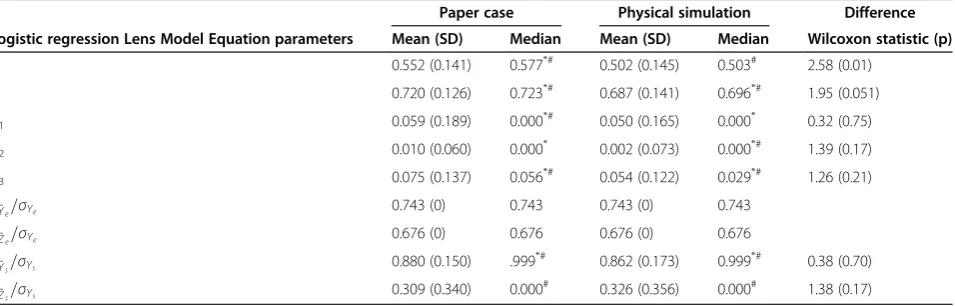
Table 4 summarizes the Lens Model Equation parameters for judgements of paper cases and high fidelity physical simulations for the Logistic Lens Model Equation. Judge-ment accuracy with physical simulations (mean ra= 0.502, SD 0.145) was significantly less than with paper case si-mulations (mean ra= 0.553, SD 0.141; t (96) = 2.74, p = 0.007).1Comparison of Lens Model Equation parame-ters from the same type of model gives insight into the sources of the better achievement when the participants assessed paper cases. Participants had significantly higher modeled knowledge utilization (G) with the paper case simulations than the high fidelity physical simulations, but
were equal in cognitive control σY~s=σYs
in both set-tings. Subgroup analyses showed that both experienced nurses and students had substantially decreased judge-ment performance in mean ra with physical simulations than with paper case simulations (experienced nurses 0.50 in physical simulations vs. 0.55 in paper case simulations; students 0.50 in physical simulations vs. 0.55 in paper case simulations).
Relative weights
In the model predicting the environmental criterion, the respiration rate cue had the greatest importance, with the mean relative weight of respiration rate (0.592) in the lo-gistic regression model with stepwise selection of cues. In predicting the participants’judgements, the stepwise logis-tic regression again gave highest weight to respiration rate (mean of 0.573 for the paper case based judgements, and 0.556 for the high fidelity physical simulation based judge-ments). Of the 97 participants, only 62 participants gave
respiration rate the most weight in paper cases whilst 60 participants gave respiration rate the most weight in phys-ical simulations.
Judgement consistency
Participants’ agreement on the 5 repeated cases was moderately high, with no significant difference between the high fidelity physical simulation assessments (Phi 0.741) and the paper case simulation assessments (Phi 0.777, bootstrap SE 0.023, z = 1.58, P = 0.12).
Discussion
Our study has addressed whether paper case simulations evoke similar judgements as realistically simulated situa-tions, by comparing nurses’risk assessments elicited from paper cases with those from physically simulated patients. The findings showed that nurses’ judgements observing patients in the high fidelity physical simulations were significantly less accurate compared with judging paper cases.
Paper cases, whilst relatively easy to administer [10,11,43], may fail to reflect reality and evoke real clinical behavior [44]. Physical simulation, by presenting task in-formation in a way that is perceptually similar to the clin-ical ecology, allows clinicians to make judgements in settings more similar to their routine clinical environ-ments. Using the technical parlance of judgement analysis, both paper case and physical simulations in this study were identical in their “formal representativeness” [45]. Scenarios in both conditions were sampled from real pa-tient cases in order to retain distributions and inter-correlations among cues participants would ordinarily encounter. However, physical simulations improved sub-stantive representativeness [45]. In our physical simulations, visual displays on standard monitoring equipment includ-ing heart rate, systolic blood pressure, temperature read-ings, respiration rate, together with auditory information
Table 4 The logistic regression Lens Model Equation parameters of paper case simulation based judgements and physical simulation based judgements (N = 97)
Paper case Physical simulation Difference
Logistic regression Lens Model Equation parameters Mean (SD) Median Mean (SD) Median Wilcoxon statistic (p)
ra 0.552 (0.141) 0.577*# 0.502 (0.145) 0.503# 2.58 (0.01)
G 0.720 (0.126) 0.723*# 0.687 (0.141) 0.696*# 1.95 (0.051)
C1 0.059 (0.189) 0.000*# 0.050 (0.165) 0.000* 0.32 (0.75)
C2 0.010 (0.060) 0.000* 0.002 (0.073) 0.000*# 1.39 (0.17)
C3 0.075 (0.137) 0.056*# 0.054 (0.122) 0.029*# 1.26 (0.21)
σY~e=σYe 0.743 (0) 0.743 0.743 (0) 0.743
σZ~e=σYe 0.676 (0) 0.676 0.676 (0) 0.676
σY~s=σYs 0.880 (0.150) .999
*# 0.862 (0.173) 0.999*# 0.38 (0.70)
σZ~s=σYs 0.309 (0.340) 0.000
# 0.326 (0.356) 0.000# 1.38 (0.17)
ra:Judgement accuracy; G: Knowledge; C1, C2, C3: Unmodeled knowledge.
such as synchronised breath sounds and moan/vocal sounds regarding different consciousness levels, are simu-lated to recreate real-life situations, thereby substantially improving the task representativeness in relation to sub-stantive representativeness.
Despite the wide use of paper cases, whether they can elicit judgements akin to those made in the clinical setting is debatable. Some early studies showed that judgements made in response to paper-based scenarios resemble those made with actual patient cases [17,46,47]. For example, Kirwan et al. [46] studied nine British rheumatologists’ judgements on disease severity for outpatients with rheumatoid arthritis. Rheumatologists’ judgements about real patients were significantly correlated with their judge-ments about the paper-based presentation of the same real life cases some weeks later. Another study by Chaput de Saintonge & Hathaway [17] investigated seven general practitioners’ antibiotic-prescribing judgements for otitis media, using both written information simulations and photographs of ear drums, and reported that written in-formation and photographs evoke similar judgements. However, the generalisability of these studies is com-promised by small, self-selected samples of participants drawn only from primary care.
In contrast, a number of studies have found that judge-ments elicited in paper cases differ from those seen in ac-tual practice settings [44,48]. Morrell & Roland [44] found no significant correlations between general practitioners’ responses to written case vignettes and their actual refer-ral rates, concluding that responses to paper cases might not reflect real clinical behavior. Holmes et al. [48] found physicians order fewer tests in actual practice than with hypothetical paper cases. The findings reviewed by Jones et al. [49] also demonstrated paper cases’inability to pre-dict actual clinical behavior.
Our study advances these earlier studies in several ways. First, the study recruited a large number of partici-pants, according toa priorisample size calculation. Fur-ther, the previous judgement analysis studies primarily focused on whether participants gave the same judge-ments on paper cases and actual practice, thus focusing on only the judgement model. However, our study used records of real patient cases to derive a valid ecological criterion [50]. This allowed it to examine judgement ac-curacy by comparing an ecological model with models derived from judgements of the paper cases and of the simulated patients.
Decomposition of judgements
Analysis of the Lens Model Equation decomposition shows that the decrement in judgement accuracy with high fidelity physical simulations compared with paper case simulations is due to the participants having signifi-cantly less policy matching. The G parameter, representing
matching between models of the judgement and the ecol-ogy, is statistically significantly lower in the physical simu-lation judgements, than in the paper case simusimu-lation judgements. There were no differences between paper case and physical simulation models in the other type of parameter, the cognitive control with which knowledge was applied σY~s=σYs
in the Logistic Lens Model
Equa-tion). Consistent with the latter finding, there were no dif-ferences in how consistent the repeated judgements were. It appears that the participants’judgements were less ac-curate when judging the simulated patients because they were less able to utilize the vital signs and symptoms in a manner similar to the way those signs relate to the out-come measured in the ecology, as evidenced by the signifi-cantly decreased G in physical simulations.
How can we explain why nurses’accuracy (ra) and policy matching (G) in assessing the physically simulated cases are lower than with paper cases? In other studies, unreli-able information acquisition from high fidelity cues has prevented participants from achieving high performance [13,51]. In this study, judgement reliabilityRswas no dif-ferent between paper case simulations and physical simu-lations, thus we can reject explanations focusing on participants’ judgement consistency. Further, if the need to gather information from the monitor or the computer-ized patient simulator had added variability, this would have led to inconsistency in sticking to one’s judgement policy. Notably, the only significant difference in Lens Model Equation parameters associated with the decreased accuracy judging simulated patients was the nurse’s know-ledge G: the degree to which their utilization of cues in making their judgements matches the relation between those cues and the ecological criterion. This could be due to two processes. First, individuals are able to perceive a smaller proportion of the cues relating to the physically simulated patients. Or second, their strategy for integrat-ing the simulation laboratory information could be less re-lated to the way those cues are associated with the outcome in the ecology. The Lens Model Equation ana-lysis per seis not able to decompose these processes be-cause its models are “paramorphic” [5]. Our tentative conclusion is that it is through the better utilization of the most important patient information, rather than better ac-quisition of information or higher consistency of judg-ment, that the participants made more accurate use of the paper case information than the physical simulation information.
Limitations
wanted each to judge a small number of cases. Having few cases would also help avoid boredom, learning, and ha-bituation as a task is repeated, which can alter a partici-pant’s judgement policy [52]. In order for the descriptive models to be generalizable on the basis of the set of cases with realistic cue and criterion distributions, the cases were sampled from a large case series of real patients [28]. However, for statistical efficiency it is better to have the proportion of predicted positive cases‘at risk’to be about 50%, particularly when the number of total cases is small. On the other hand, to fit accurate descriptive regression models, particularly logistic models with intercorrelated cues, a large number of patients is required [26,53,54]. In designing any judgement analysis research, it is important to note that compromises are often required between an ideal study design and practical constraints [55]. In this study the number of cases judged was small [26], particu-larly for logistic regression with high cue intercorrelations [53,54]. Accordingly, the estimated relative weights may be less accurate when entering all cues in the model sim-ultaneously. To address this issue we used stepwise logis-tic regressions for the analyses of cue relative weights until a unique solution was found in the model where the participant’s regression coefficients did not have high standard errors.
All participants judged the paper cases before the phys-ical simulation cases, which may potentially confound paper-physical task differences because of familiarity ef-fects [52]. We could have randomized the task order, but the fact we did not is unlikely to have influenced partici-pants’judgements on physical simulations given that par-ticipants were not given any feedback regarding the correctness of their paper-based judgements after com-pleting paper cases. Ultimately, any familiarity effect would have led to overachievement in the physical lations, but in fact participants did less well in this simu-lated condition. Importantly, to minimize any maturation effect during the time gap between paper case simula-tions and physical simulasimula-tions, the physical simulasimula-tions were conducted shortly after participants completed paper cases.
The high fidelity physical simulation judgement task was designed to be more representative of the situations in which nurses practice than the paper case simula-tion judgement task. However, in clinical practice a large amount of information is available to nurses assessing risk, including other perceptual cues (e.g. patient’s skin pallor). Whilst such cues may be redundant for predicting critical event risk, the fact that even redundant cues are absent in both physical simulation and paper case scenarios means that actually recognizing the patient‘at risk’may be more difficult. Additionally, simulation manikins lack interactiv-ity. This is most clear, perhaps, with the vocal sounds used to represent levels of consciousness. In clinical settings,
nurses may assess patients’ level of consciousness by talking to the patient to elicit a response. These features may limit the generalization to real clinical environments of the results derived from judgement studies using simu-lation laboratories. Despite these limitations, using phys-ical simulation as a vehicle for improving the fidelity (and thus representativeness) of clinical scenarios is a promis-ing approach to elicitpromis-ing and evaluatpromis-ing clinicians’ reason-ing and judgements.
Conclusions
This study addressed an important methodological ques-tion: whether clinician judgements of paper cases, as con-ventionally employed in judgement analysis research, can be generalized to judgements in clinical situations. To the extent that accuracy in judgement analysis studies is a function of task representativeness, when we improved task representativeness by creating case simulations that were more perceptually representative of the clinic, partic-ipants’ performance was affected. They assessed patient risk less accurately in high fidelity physical simulations than when judging paper cases. The use of more percep-tually realistic clinical settings (e.g., physical simulations) for assessing nurses’judgement competency merits scru-tiny in future judgement analysis research. Increased awareness of the characteristics of complex and ill-structured tasks may, to some degree, promote the devel-opment of interventions to support nurses’ acquisition and integration of clinical information. The paper high-lights the importance of using ‘representative’task envi-ronments to elicit clinicians’ realistic judgements. The approach used in this study may be of value to those de-signing and evaluating clinical simulations as part of edu-cation and training strategies aimed at improving clinical judgement and reasoning.
Endnotes
1
For lens model parameter comparisons between paper case simulation and physical simulation based judge-ments, the same category of statistical significance was obtained using t-tests of the differences in correlations and in Fisher-Z-transformed correlations, and using the Wilcoxon matched pairs signed ranks test. For the G par-ameter of the logistic lens model, the significances were p = 0.033, 0.052 and 0.051, respectively.
Additional file
Additional file 1:The clinical vignette questionnaire.
Competing interests
Authors’contributions
HY and CT were responsible for the study conception and design. HY and AF performed the data collection. HY, RH, MB performed the data analysis. HY was responsible for the drafting the manuscript. HY, CT, RH made critical revisions to the paper for important intellectual content. HY, RH, MB provided statistical expertise. All authors read and approved the final manuscript.
Acknowledgment
We thank Dr C. P. Subbe for consenting for us to use his dataset in our simulations. This article presents independent research funded in part by the National Institute for Health Research (NIHR) through the Leeds York Bradford Collaboration for 19 Leadership in Applied Health Research and Care. The views expressed in this publication are those of the authors and not necessarily those of the NHS, the NIHR or the Department of Health.
Author details
1Centre for Reviews and Dissemination, University of York, York YO10 5DD, UK.2Department of Health Sciences, University of York, York YO10 5DD, UK. 3Department of Family and Preventive Medicine, University of Oklahoma, Oklahoma, OK 73104, USA.
Received: 29 January 2013 Accepted: 20 May 2013 Published: 30 May 2013
References
1. Brunswik E:The conceptual framework of psychology.Chicago: University of Chicago Press; 1952.
2. Hammond KR:Judgement and decision making in dynamic tasks.Inf Decis Technol1988,14:3–14.
3. Hammond KR, Hamm RM, Grassia J, Pearson T:Direct comparison of the efficacy of intuitive and analytic cognition in expert judgement.
IEEE Trans Syst Man Cyber1987,17:753–770.
4. Hammond KR:Computer graphics as an aid to learning.Science1971, 172:903–908.
5. Hoffman PJ:The paramorphic representation of clinical judgement.
Psychol Bull1960,57:116–131.
6. Stewart TR:Improving reliability of judgmental forecasts. InPrinciples of forecasting: a handbook for researchers and practitioners.Edited by Armstrong JS. Hingham, MA: Kluwer Academic Publishers; 2001:81–106. 7. Hammond KR:Upon reflection.Thinking and Reasoning1996,2:239–248. 8. Hammond KR, Stewart TR:Introduction. InThe essential Brunswik:
Beginnings, explications, applications.Edited by Hammond KR, Stewart TR. New York: Oxford University Press; 2001:3–11.
9. Dhami MK, Hertwig R, Hoffrage U:The role of representative design in an ecological approach to cognition.Psychol Bull2004,130:959–988. 10. Rosenquist PB, Colenda CC, Briggs J, Kramer SI, Lancaster M:Using case
vignettes to train clinicians and utilization reviewers to make level-of -care decisions.Psychiatr Serv2000,51:1363–1365.
11. Langley GR, Tritchler DL, Llewellyn-Thomas HA, Till JE:Use of written cases to study factors associated with regional variations in referral rates.
J Clin Epidemiol1991,44:391–402.
12. Brown TR:A comparison of judgmental policy equations obtained from human judges under natural and contrived conditions.Math Biosci1972, 15:205–230.
13. Brehmer A, Brehmer B:What have we learned about human judgement from thirty years of policy capturing?InHuman judgement: the SJT view.
Edited by Brehmer B, Joyce CRB. Amsterdam: Elsevier; 1988:75–114. 14. Wigton RS, Hoellerich VL, Patil KD:How physicians use clinical information
in diagnosing pulmonary embolism: an application of conjoint analysis.
Med Decis Making1986,6:2–11.
15. Phelps RH, Shanteau J:Livestock judges: how much information can an expert use?Organ Behav Hum Decis Process1978,21:209–219. 16. Lamond D, Crow R, Chase J, Doggen K, Swinkels M:Information sources
used in decision making: considerations for simulation development.
Int J Nurs Stud1996,33:47–57.
17. de Saintonge DM C, Hathaway NR:Antibiotic use in otitis media: patient simulations as an aid to audit.BMJ1981,283:883–884.
18. Thompson C, Cullum N, Mccaughan D, Sheldon T, Paynor P:Nurses, information use, and clinical decision making - the real world potential for evidence-based decisions in nursing.Evid Based Nurs2004,7:68–72.
19. Bond WF, Kostenbader M, McCarthy JF:Prehospital and hospital-based health care providers’experience with a human patient simulator.
Prehospital Emerg Care2001,5:284–287.
20. Devitt JH, Kurrek MM, Cohen MM, Cleave-Hogg D:The validity of performance assessments using simulation.Anesthesiology2001,95:36–42. 21. Wyatt A, Archer F, Fallow B:Use of simulators in teaching and learning:
Paramedics’evaluation of a Patient Simulator?J Emerg Primary Health Care2007,5:1–16.
22. Rich K:Inhospital cardiac arrest: pre-event variables and nursing response.Clin Nurse Special1999,13:147–153.
23. Franklin C, Mathew J:Developing strategies to prevent inhospital cardiac arrest: analyzing responses of physicians and nurses in the hours before the event.Crit Care Med1994,22:244–247.
24. Hodgetts TJ, Kenward G, Vlackonikolis I, Payne S, Castle N, Crouch R, Ineson N, Shaikh L:Incidence, location and reasons for avoidable in-hospital cardiac arrest in a district general hospital.Resuscitation2002,54:115–123. 25. McArthur-Rouse F:Critical care outreach services and early warning
scoring systems: a review of the literature.J Adv Nurs2001,36:696–704. 26. Cooksey RW:Judgment analysis: theory, methods, and applications.California:
Academic; 1996.
27. Cook TD, Campbell DT:Quasi-experimentation: design and analysis issues for field settings.Boston: Houghton Miffin; 1979.
28. Subbe CP, Kruger M, Rutherford P, Gemmel L:Validation of a modified early warning score in medical admissions.QJM2001,94:521–526. 29. National Institute for Health and Clinical Excellence:Acutely ill patients in
hospital: recognition of and response to acute illness in adults in hospital.Nat Institute Health Clin Excell (NICE) clin guid2007,50:1–107. 30. Independent Healthcare Association:Guidance on comprehensive critical care
for adults in independent sector acute hospitals.London: Independent Healthcare Association; 2002:1–47.
31. Cohen J:Statistical power analysis for the regression/correlation analysis for the behavioral sciences.2nd edition. New York: Academic; 1988.
32. Menard S:Applied logistic regression analysis.Thousand Oaks, CA: Sage; 1995. 33. Bowerman BL, O’Connell RT:Linear statistical models: an applied approach.
2nd edition. Belmont, CA: Duxbury; 1990.
34. Thompson C, Bucknall T, Estabrookes CA, Huthinson A, Fraser K, de Vos R, Binnecade J, Barrat G, Saunders J:Nurses’critical event risk assessments: a judgment analysis.J Clin Nurs2007,26:1–12.
35. Bland M:An introduction to medical statistics.3rd edition. Oxford: Oxford University Press; 2000.
36. Torgerson DJ, Campbell MK:Use of unequal randomisation to aid the economic efficiency of clinical trials.BMJ2000,321:759.
37. Stewart T:Notes on a form of the lens model equation for logistic regression analysis.Brunswik Society Meeting; 2004.
38. Doherty ME, Kurz EM:Social judgement theory.Thinking and Reasoning
1996,2:109–140.
39. Cook R, Farewell V:Conditional inference for subject-specific and marginal agreement: two families of agreement measures.Can J Stat
1995,23:333–344.
40. Cohen J:A coefficient of agreement for nominal scales.Educ Psychol Meas
1960,20:37–46.
41. Money CZ, Duval RD:Bootstrapping: a nonparametric approach to statistical inference.Newbury Park, CA: Sage; 1993.
42. Efron B, Tibshirani R:Bootstrap methods for standard errors, confidence intervals, and other measures of statistical accuracy.Stat Sci1986,1:54–77. 43. Peabody JW, Luck JL, Glassman P, Dresselhaus TR, Lee M:Comparison of
vignettes, standardized patients, and chart abstraction: a prospective validation study of 3 methods for measuring quality.JAMA2000, 283:1715–1722.
44. Morrell DC, Roland MO:Analysis of referral behaviours: responses to simulated case histories may not reflect real clinical behaviour.Br J Gen Pract1990,40:182–185.
45. Hammond KR:Probabilistic functionalism: egon Brunswik’s integration of the history, theory, and method of psychology. InThe psychology of Egon Brunswik. Edited by Hammond KR. New York: Holt, Rinehart and Winston, INC; 1966:15–80.
46. Kirwan JR, de Saintonge DM C, Joyce CR:Clinical judgment in rheumatoid arthritis. I.rheumatologists’opinions and the development of‘paper patients’.Ann Rheum Dis1983,42:644–647.
patients with aortic stenosis (meeting abstract).Medical Decision Making
1995,14:428.
48. Holmes MM, Rovner DR, Rothert ML, Schmitt N, Given CW, Ialongo NS: Methods of analyzing physician practice patterns in hypertension.
Medical Care1989,27:59–68.
49. Jones TV, Gerrity MS, Earp J:Written case simulations: do they predict physicians’behavior.J Clin Epidemiol1990,43:805–815.
50. Wigton RS:Social judgement theory and medical judgement.Thinking and Reasoning1996,2:175–190.
51. Lusk CM, Stewart TR, Hammand KR, Potts RJ:Judgment and decision making in dynamic tasks: the case of forecasting the microburst.Weather and Forecasting1990,5:627–639.
52. Hamm R:Cue by hypothesis interactions in descriptive modeling of unconscious use of multiple intuitive judgment strategies. InIntuition in judgment and decision making.Edited by Plessner H, Betsch C, Betsch T. Mahwah, NJ: Lawrence Erlbaum; 2008:55–70.
53. McClelland G:Representative and efficient designs.Brunswik Soc Notes Essays1999,5:1–7.
54. Bland M:Applied biostatistics: multiple regression.Personal Communication2006.
55. Stewart TR:Judgment analysis: procedures. InHuman judgment: the SJT view.Edited by Brehmer B, Joyce CRB. Oxford: North-Holland; 1988:41–74.
doi:10.1186/1472-6947-13-62
Cite this article as:Yanget al.:The effect of improving task
representativeness on capturing nurses’risk assessment judgements: a comparison of written case simulations and physical simulations.BMC Medical Informatics and Decision Making201313:62.
Submit your next manuscript to BioMed Central and take full advantage of:
• Convenient online submission
• Thorough peer review
• No space constraints or color figure charges
• Immediate publication on acceptance
• Inclusion in PubMed, CAS, Scopus and Google Scholar
• Research which is freely available for redistribution