Identifying Learning Problems in Children Evaluated
for ADHD: The Academic Performance Questionnaire
WHAT’S KNOWN ON THIS SUBJECT: ADHD is increasingly managed by PCPs and has many comorbidities, including learning disorders. Parent- and teacher-completed rating scales are recommended for diagnosing ADHD, but many PCPs have difficulty screening for learning problems in children with ADHD symptoms.
WHAT THIS STUDY ADDS: We assessed the sensitivity, specificity, and predictive value of a scoring algorithm and assessed the test-retest reliability and validity of that algorithm for a brief teacher-completed screening questionnaire that may improve screening for learning problems in pediatric practice.
abstract
OBJECTIVE:The objective of this study was to assess the usefulness of the Academic Performance Questionnaire (APQ) to identify low reading and math achievement in children who are being evaluated for attention-deficit/hyperactivity disorder (ADHD).
METHODS:Charts of 997 patients who were seen in a multidisciplinary ADHD evaluation program were reviewed. Patients who were in first-through sixth-grade and had complete APQ and Wechsler Individual Achievement Test II Basic Reading and Numerical Operations subtests were enrolled in this study. The 271 eligible patients were randomly assigned to a score-development group (n⫽ 215) and a validation group (n⫽56). By using data from the score-development sample, APQ questions that predicted low academic achievement were identified and the scores for these questions were entered into a logistic regres-sion to identify the APQ questions that independently predicted low achievement.
RESULTS:Only 2 APQ questions, 1 about reading and 1 about math, independently predicted low achievement. By using these 2 questions, the area under the receiver operating characteristic curve was 0.834, and the optimal combination of sensitivity and specificity occurred when the total score for the 2 items was⬎4. This cutoff had a sensi-tivity of 0.86 and a specificity of 0.63 in the score-development group and a sensitivity of 1.0 and a specificity of 0.53 in the validation sample.
CONCLUSIONS:The APQ may be a useful screening tool to identify chil-dren being evaluated for ADHD who need additional testing for learning problems. Although the predictive value of a negative screen on the APQ is good, the predictive value of a positive test is relatively low. Pediatrics2009;124:e633–e639
AUTHORS:Amanda E. Bennett, MD,a,bThomas J. Power, PhD,b,cRicardo B. Eiraldi, PhD,b,cStephen S. Leff, PhD,b,c and Nathan J. Blum, MDa,b
aDivision of Child Development, Rehabilitation, and Metabolic Disease, andcDepartment of Psychology, Children’s Hospital of Philadelphia, Philadelphia, Pennsylvania; andbDepartment of Pediatrics, University of Pennsylvania School of Medicine, Philadelphia, Pennsylvania
KEY WORDS
attention-deficit/hyperactivity disorder, learning disorder, screening, developmental-behavioral pediatrics, school-aged children
ABBREVIATIONS
ADHD—attention-deficit/hyperactivity disorder PCP—primary care provider
APQ—Academic Performance Questionnaire WIAT-II—Wechsler Individual Achievement Test II ROC—receiver operating characteristic PPV—positive predictive value NPV—negative predictive value
www.pediatrics.org/cgi/doi/10.1542/peds.2009-0143
doi:10.1542/peds.2009-0143
Accepted for publication May 29, 2009
Address correspondence to Amanda E. Bennett, MD, Children’s Hospital of Philadelphia, 3550 Market St, 3038, Philadelphia, PA 19104. E-mail: [email protected]
PEDIATRICS (ISSN Numbers: Print, 0031-4005; Online, 1098-4275).
Copyright © 2009 by the American Academy of Pediatrics
FINANCIAL DISCLOSURE:The authors have indicated they have no financial relationships relevant to this article to disclose.
der that appears early in childhood and is characterized by inattention and hyperactivity-impulsivity, result-ing in functional impairments.1 It has an estimated prevalence of 2% to 10% among children and adolescents.2 Lim-ited access to behavioral health spe-cialists has resulted in increased de-mands on primary care physicians (PCPs) to diagnose and manage ADHD.3 When left unrecognized or untreated, ADHD and its comorbidities have been associated with strained familial and peer relationships, educational and employment difficulties, substance use, and unintentional injuries.4
Learning disorders co-occur with ADHD in 20% to 30% of children and are typically identified by a psychoeduca-tional assessment.4–6PCPs who evalu-ate children for ADHD often find it diffi-cult to identify which children they should refer for additional assess-ment of academic skills.3,7Although a
number of parent- and
teacher-completed questionnaires to assist in evaluating ADHD symptoms and symp-toms of other associated mental health conditions have been devel-oped, no validated screening tools are available to assist them in identifying children who have ADHD symptoms and may need additional evaluation for learning problems.8 The ADHD Toolkit includes a teacher rating scale with 3 items that assess academic perfor-mance, but the reliability and the pre-dictive validity of these questions is not known.8
Previous research on the accuracy of teacher rating of students’ academic achievement has produced conflicting findings. Kenny and Chekaluk9found that teachers could classify kindergarten through second-grade students into 3 categories—poor-, average-, or ad-vanced-reader—with excellent concur-rent validity to standardized tests that
measure phonological, language, read-ing, and memory skills. In their 1997 study, Gresham and MacMillan10 found that teachers’ ratings of second-, third-, and fourth-grade students could differ-entiate children who had or were at risk for learning problems from control sub-jects with 95% accuracy. They addition-ally found that teachers’ ratings of stu-dents’ performance compared with their peers was most predictive for chil-dren who were classified as having a learning disability11; however, Glascoe12 found that global teacher ratings of stu-dents’ academic performance by using a simple 5-point Likert scale were only moderately sensitive for detecting low achievement on standardized tests. None of these studies has investigated the value of teacher rating in detecting poor academic achievement in children who are being evaluated for ADHD.
The Academic Performance Question-naire (APQ) is a 10-item questionQuestion-naire that is completed by teachers.11It uses 4- and 5-point ordinal scales to identify the child’s performance in reading,
mathematics, writing, and homework. This measure has been used to obtain descriptive information about children who are being evaluated in a multidis-ciplinary ADHD center that specializes in the assessment and treatment of ADHD and is based in a tertiary care pediatric hospital in the mid-Atlantic region of the United States. It is un-known whether the APQ might be a valid and clinically useful screening tool for learning problems that could be used by physicians. The purposes of this study were to (1) examine the test-retest reliability of the APQ and (2) evaluate the validity of the APQ with re-gard to predicting low achievement in reading and/or math.
METHODS
Patients
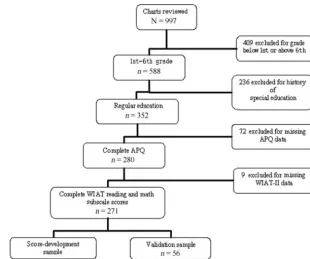
The charts of 997 consecutive patients who were evaluated through a multi-disciplinary ADHD center between May 2001 and March 2005 were reviewed. Figure 1 indicates how potential par-FIGURE 1
ticipants were included and excluded from the study. Patients were included only when they were enrolled in grades 1 through 6 (n⫽558). Children were excluded when they had a history of receiving special education services at the time of their evaluation (n ⫽ 236), because a screening instrument would not be required to determine the need for a learning evaluation in these cases. Patients were also ex-cluded when they did not have at least 1 teacher-completed APQ (n⫽72) or when they did not have complete Wech-sler Individual Achievement Test II (WIAT-II) Basic Reading and Numerical Operations subtest scores (n⫽9). The final study population consisted of 271 patients. These patients were ran-domly assigned to an initial validation
sample (n ⫽ 215) and a
cross-validation sample (n⫽56) so that⬃4 patients were assigned to the score-development group for every 1 patient assigned to the validation sample (see Fig 1). This method was used to ensure that there was sufficient power in the initial validation sample to conduct the analyses. All patients had con-sented to use of their assessment data for research, and institutional review board approval for this study was ob-tained. Patients did not receive incen-tives or compensation for participa-tion in this study.
Data to assess test-retest reliability of the APQ were collected on a conve-nience sample of first- through fourth-grade students at a local suburban elementary school. Teachers were asked to systematically select 4 stu-dents from their grade book in the fol-lowing manner: select the first boy and the first girl in the grade book who re-quired remedial assistance or aca-demic supports, and select the second boy and third girl in the grade book who were receiving regular education services only. This method was used to ensure that roughly an equal number
of children with and without learning problems were included in the sample. APQ data for these students were col-lected anonymously, as recommended by the institutional review board, be-cause it was not feasible to obtain parent consent; therefore, no demo-graphic information about the chil-dren in this sample was available. The school population consists of 33% black, 3% Asian, 13% Hispanic, and 51% white children. Thirty percent of the school population is eligible for free or reduced-price lunch.
Procedure
All charts were reviewed by research team members (Drs Bennett and Eiraldi) and research assistants. The data extracted for this study included demographic data at the time of initial evaluation (age in months, gender, eth-nicity, and socioeconomic class deter-mined by the Hollingshead Index), his-tory of grade failure, and the use of special education services. Results of the evaluation were also extracted and included the results of the Diagnostic Interview for Children and Adoles-cents–Revised, Parent Version,13APQ,11
and subtest scores on the WIAT-II.14 ADHD status was determined by using clinician diagnosis on the basis of re-sults from the Diagnostic Interview for Children and Adolescents–Revised, Parent Version as well as parent and teacher rating scales.
For test-retest data collection, the study protocol was presented to teach-ers during a routine faculty meeting. Teachers who chose to participate completed APQs on systematically se-lected students at baseline and 3 weeks later. A 3-week retest period was estimated to be sufficient to as-sess reliability; that is, long enough for teachers not to recall their previous responses and brief enough not to be affected by the student’s attainment of new skills and resulting in changes in classroom performance.
Academic Performance Questionnaire
The APQ is a 10-item questionnaire that is completed by teachers (Table 1) and
was designed to assess student
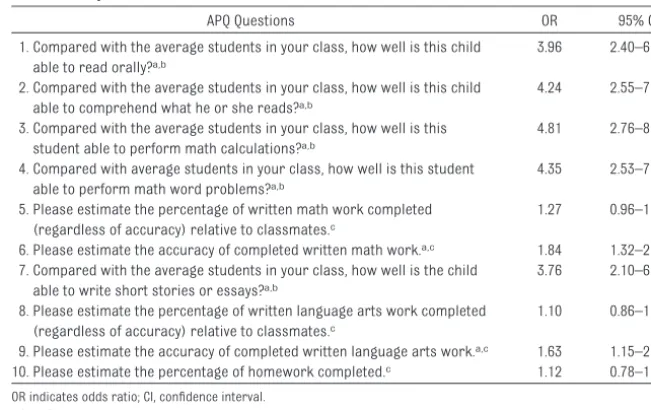
progress in the classroom curriculum in relationship to other students.11 It TABLE 1 APQ Items With Individual ORs and CIs
APQ Questions OR 95% CI
1. Compared with the average students in your class, how well is this child able to read orally?a,b
3.96 2.40–6.53
2. Compared with the average students in your class, how well is this child able to comprehend what he or she reads?a,b
4.24 2.55–7.06
3. Compared with the average students in your class, how well is this student able to perform math calculations?a,b
4.81 2.76–8.41
4. Compared with average students in your class, how well is this student able to perform math word problems?a,b
4.35 2.53–7.46
5. Please estimate the percentage of written math work completed (regardless of accuracy) relative to classmates.c
1.27 0.96–1.67
6. Please estimate the accuracy of completed written math work.a,c 1.84 1.32–2.58
7. Compared with the average students in your class, how well is the child able to write short stories or essays?a,b
3.76 2.10–6.72
8. Please estimate the percentage of written language arts work completed (regardless of accuracy) relative to classmates.c
1.10 0.86–1.52
9. Please estimate the accuracy of completed written language arts work.a,c 1.63 1.15–2.31
10. Please estimate the percentage of homework completed.c 1.12 0.78–1.60
OR indicates odds ratio; CI, confidence interval.
aSignificant item.
bResponse options: 1 indicates well above average; 2, at or somewhat above average; 3, somewhat below average; 4, well
below average.
cResponse options: 1 indicates 90% to 100%; 2, 80% to 89%; 3, 70% to 79%; 4, 60% to 69%; 5, 0% to 59%.
data about children’s academic per-formance in the classroom. Teachers respond to each questionnaire on an ordinal 4- or 5-point scale as describe in Table 1.
Wechsler Individual Achievement Test II
The WIAT-II basic reading and numeri-cal operations subtests were adminis-tered to all patients to identify children who were underachieving in math and reading. The subtests were selected on the basis of their excellent psychomet-ric properties. Average stability coeffi-cients for the word reading and nu-merical operations subtests have been reported to be 0.98 and 0.92, respec-tively. Each subtest has demonstrated very high correlations with respective composite scores for all age groups (0.91– 0.95 for total reading and 0.86 – 0.93 for total mathematics).14 Further-more, standard score differences between individuals with learning dis-abilities and matched control subjects were significantly large for both subtests (P⬍.01).14Low achievement was defined as a standard score of
⬍85 on either basic reading or numer-ical operations subtests. This cut point has been suggested as a useful indica-tor of low achievement by experts in psychology and education.6
Statistical Analysis
All statistical analyses were per-formed by using SPSS 16.0 (SPSS, Inc, Chicago, IL). Demographic characteris-tics of the initial validation sample and the cross-validation sample were com-pared by using the Mann-Whitney Wil-coxon Test.
Univariate logistic regression was then computed to determine which items on the APQ predicted low achievement in reading and/or math. Items that were determined to be
sig-nificant predictors of low achievement were entered into a multivariate logis-tic regression model to assess their unique predictive ability. Items that were determined to be uniquely pre-dictive were combined and used to plot a receiver operating characteristic (ROC) curve to determine scoring cut-off points that provide greatest sensi-tivity and specificity for the outcome of low achievement. Test-retest reliability of teachers’ categorization of stu-dents’ academic skills using the APQ scoring algorithm was assessed using thestatistic. The sensitivity and the specificity of the identified APQ cut score for low academic achievement were then assessed in the validation sample.
RESULTS
There were no significant demo-graphic differences between the initial validation sample and the cross-validation sample (Table 2). The major-ity of patients were male; a high percentage were white; and socioeco-nomic status of⬃70% was in the up-per 2 of 5 categories on the Hollings-head (1975) scale. There was no difference in the frequency of ADHD di-agnosis in the 2 groups (Table 2), and ADHD subtypes did not vary signifi-cantly between groups: ADHD,
com-bined type (39% vs 41%); ADHD, pre-dominantly inattentive type (22%
vs 27%); ADHD, predominantly
hyperactive-impulsive type (3% vs 4%); and ADHD, not otherwise specified (9% vs 11%).
Approximately 17% of the sample were determined to be low achievers in reading and/or mathematics: math only, 9.5%; reading only, 3.7%; and both reading and math, 3.3%. Logistic re-gression conducted with each item separately revealed that 7 items were significantly associated with low achievement (see Table 1). Two ques-tions remained uniquely predictive of low achievement when the 7 items were entered simultaneously in the multiple regression model (Table 3). Combining these 2 items, total scores ranging from 2 to 8 were possible, with higher scores indicating lower aca-demic achievement. Area under the ROC curve was optimal (0.834) when the cut point was set at a total raw score of 4 (Fig 2). Using a summed score of ⬎4 yielded a sensitivity of 0.86, a specificity of 0.63, a positive pre-dictive value (PPV) of 0.32, and a nega-tive predicnega-tive value (NPV) of 0.96 in the score-development sample (Table 4). Inclusion of additional APQ questions that showed a trend toward being
pre-Sample Sample
Male gender, % 65.0 71.4 .513
Age, mean (SD), mo 107.6 (18.9) 104.9 (18.0) .415
White ethnicity, % 82.3 85.7 .567
Socioeconomic status (Hollingshead⬎IV), % 69.8 71.4 .757
ADHD diagnosis, % 80.7 78.8 .374
There were no significant differences.
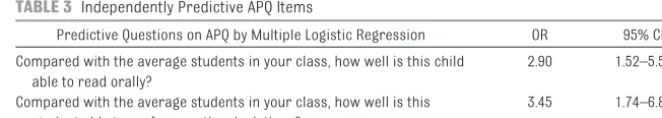
TABLE 3 Independently Predictive APQ Items
Predictive Questions on APQ by Multiple Logistic Regression OR 95% CI
Compared with the average students in your class, how well is this child able to read orally?
2.90 1.52–5.53
Compared with the average students in your class, how well is this student able to perform math calculations?
3.45 1.74–6.85
dictive of low achievement in the re-gression model did not improve the area under the curve or psychometric properties. Analysis of validation sam-ple using this scoring cut point re-vealed similar values: sensitivity of 1.0, specificity of 0.53, PPV of 0.29, and NPV of 1.0.
For assessment of test-retest reliabil-ity, teachers completed APQs on 24 stu-dents at the initial time point, and an APQ was collected 3 weeks later for 100% of these students.for the scor-ing algorithm was acceptable at 0.743. Responses that were based on catego-rization by using the scoring algorithm on the APQ were the same at baseline
and the 3-week retest for 88% of the students.
DISCUSSION
This study assessed the ability of a brief teacher-completed question-naire to detect academic under-achievement in children who are being evaluated for ADHD. There are no vali-dated academic rating scales to assist physicians in identifying children who have symptoms of ADHD and may have learning problems. Results of this study demonstrate that using only 2 questions from the APQ, 1 about math and 1 about reading, as a screen pro-duces a test with acceptable test-retest reliability and sensitivity. The sensitivity of this measure in our pop-ulation is particularly impressive in that we excluded the children whom teachers would most easily detect (those already receiving assistance for learning problems in special education).
The results of our study are consistent with previous research that has sug-gested that teachers can accurately
rate students’ academic perfor-mance9,10 but differ somewhat from Glascoe’s study, which found that teacher ratings on a 5-point Likert scale had a sensitivity of 0.49 to 0.61 and a specificity of 0.84 to 0.85 for de-tecting low math and reading achieve-ment; however, Glascoe’s study evalu-ated the use of teacher ratings in detecting low academic achievement for all students, whereas we evaluated the ratings in the context of evaluating children with concerns about ADHD. The higher sensitivity found in our study may be partly attributable to teachers’ being more sensitive to aca-demic difficulties in a population al-ready identified as having problematic classroom behaviors. The lower speci-ficity may relate to the difficulty of dis-tinguishing between academic skills deficits and problems with attention and impulsivity as a cause for poor classroom performance. Another rea-son for the discrepant findings may be the difference in response options be-tween the 2 rating scales. Glascoe’s measure used a 5-point Likert scale (far above average to far below aver-age) to rate students’ academic per-formance, whereas the APQ used a 4-point scale for the 2 items included in the predictive model.
This study documents the importance of physicians’ screening for low aca-demic achievement in the evaluation of children for ADHD. In this sample, 17% of the children who were not receiving special education assistance in school were performing poorly in reading and/or math. It is interesting that our population had significantly more chil-dren with low achievement in math (13%) as compared with reading (7%). Because the frequency of reading and math learning problems generally is similar in children with ADHD,15 the higher prevalence of math problems in this sample, which excluded students who previously were identified by their FIGURE 2
ROC for summed predictive APQ items.
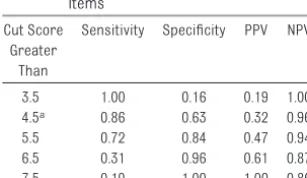
TABLE 4 Sensitivity, Specificity, PPV, and NPV for Cut Points of Summed Predictive Items
Cut Score Greater
Than
Sensitivity Specificity PPV NPV
3.5 1.00 0.16 0.19 1.00
4.5a 0.86 0.63 0.32 0.96
5.5 0.72 0.84 0.47 0.94
6.5 0.31 0.96 0.61 0.87
7.5 0.19 1.00 1.00 0.86
aOptimal cut point.
tect or intervene more quickly for chil-dren with reading problems than for children with math problems.
Clinicians who use the APQ as part of the evaluation of children for ADHD must carefully consider the implica-tions of its good sensitivity but only moderate specificity. In its current form, a cut point of ⬎4 on the APQ would be expected to have a good NPV (few false-negative results) but a low PPV (many false-positive results). Thus, many of the children who are re-ferred for additional evaluation would not be found to have low academic achievement. The APQ may function well as an initial screener; for children who screen positive, it may be sensible to administer an additional screener before a complete psychoeducational assessment is performed. This addi-tional assessment could be completed by a school-based prereferral (for spe-cial education) intervention team,16or, in the context of developmental-behavioral pediatric practice, may in-clude administration of brief office-based academic testing.
The results of this study should be con-sidered in the context of the following limitations. First, the children in this study did not have a full psychoeduca-tional assessment. For clinical effi-ciency, only the 2 subtests of the WIAT-II that best correlate with overall read-ing and math scores were selected. A more complete academic assessment may have changed the classification of some children who scored near the cutoff. In addition, we did not assess other important skills, such as writing, spelling, and phonics. Thus, the ability of the APQ questions to detect children
Second, this study reports use of the APQ in a specialized clinic setting. Be-fore the APQ can be recommended for incorporation into primary care prac-tice, its psychometric properties in these settings should be evaluated. Furthermore, study children were gen-erally of white background and from families of moderate to high socioeco-nomic status. Additional assessment of the APQ in more diverse settings is needed.
Finally, we assessed the ability of the APQ to detect low academic achieve-ment and did not assess its ability to detect learning disabilities by using an IQ achievement discrepancy model. Whereas previous definitions of learn-ing disabilities required a discrepancy between results of IQ and academic achievement testing, reauthorization of the Individuals With Disabilities Edu-cation Act in 2004 called for replace-ment of the traditional intellectual and achievement discrepancy model with use of a process that is based on a child’s response to evidence-based in-tervention.6,17Furthermore, the Individ-uals With Disabilities Education Act of 2004 identifies regular classroom teachers as key members of the group to determine eligibility for a learning dis-ability classification, and achievement below expected age or grade level is an acceptable initial criterion for imple-mentation of early interventions.17 Nev-ertheless, we recognize that a question-naire that rates a child’s relative academic performance would not accu-rately identify children with high IQs and discrepant achievement.
Despite these limitations, we believe the APQ represents a significant step
ing problems in children who are be-ing assessed for ADHD. Although the ADHD Toolkit8 includes a teacher-report measure with 3 items for as-sessing academic skills, the reliability and predictive validity of these items has not been established. This study supports the use of the APQ as a teacher-report screening tool for as-sessing learning problems among chil-dren who present with problems re-lated to ADHD.
CONCLUSIONS
The APQ may be a useful initial screen-ing tool for assessscreen-ing learnscreen-ing prob-lems among children who present with symptoms of ADHD or other school problems. Before the APQ can be im-plemented as a primary care screen-ing tool, additional research is needed to confirm its predictive validity in a primary care setting assessing chil-dren with a diverse range of demo-graphic characteristics.
ACKNOWLEDGMENTS
This research project was supported by projects 33463 and T77 MC 00012 from the Maternal Child Health Bureau (Title V, Social Security Act), Health Re-sources and Services Administration, Department of Health and Human Services.
REFERENCES
1. American Psychiatric Association.Diagnostic and Statistical Manual of Mental Disorders. 4th ed. Washington, DC: American Psychiatric Association; 1994
2. Centers for Disease Control and Prevention. Mental health in the United States: prevalence of diagnosis and treatment of attention-deficit/hyperactivity disorder—United States 2003.MMWR Morb Mortal Wkly Rep. 2005;54(34):842– 847. Available at: www.cdc.gov/mmwr/preview/ mmwrhtml/mm5434a2.htm
3. Leslie LK, Weckerly J, Plemmons D, Landsverk J, Eastman S. Implementing the American Academy of Pediatrics attention-deficit/hyperactivity disorder diagnostic guidelines in primary care set-tings.Pediatrics.2004;114(1):129 –140
4. Spencer TJ, Biederman J, Mick E. Attention-deficit/hyperactivity disorder: diagnosis, lifespan, comorbidities, and neurobiology.J Pediatr Psychol.2007;32(6):631– 642
5. National Institute of Mental Health.Attention-Deficit/Hyperactivity Disorder. Bethesda, MD: Na-tional Institute of Mental Health, NaNa-tional Institutes of Health, US Department of Health and Human Services; 1994. Available at: www.nimh.nih.gov/health/publications/attention-deficit-hyperactivity-disorder/adhd_booklet.pdf. Accessed December 22, 2006
6. Dombrowski SC, Kamphaus RW, Reynolds CR. After the demise of the discrepancy: proposed learning disabilities diagnostic criteria.Prof Psychol Res Pr.2004;35(4):364 –372
7. Polaha J, Cooper S, Meadows T, Kratochvil CJ. The assessment of attention-deficit/hyperactivity disorder in rural primary care: the portability of the American Academy of Pediatrics guidelines to the “real world.”Pediatrics.2005;115(2). Available at: www.pediatrics.org/cgi/content/full/ 115/2/e120
8. American Academy of Pediatrics; National Initiative for Children’s Healthcare Quality.Caring for Children With ADHD: A Resource Toolkit for Clinicians.Chicago, IL: American Academy of Pediatrics and National Initiative for Children’s Healthcare Quality; 2002
9. Kenny DT, Chekaluk E. Early reading performance: a comparison of teacher-based and test-based assessments.J Learn Disabil.1993;26(4):227–236
10. Gresham FM, MacMillan DL. Teachers as “tests”: differential validity of teacher judgments in identifying students at-risk for learning difficulties.School Psych Rev.1997;26(1):47– 60 11. Mercugliano M, Power TJ, Blum NJ. The Clinician’s Practical Guide to Attention-Deficit/
Hyperactivity Disorder. Baltimore, MD: Paul H. Brooks Publishing Co, 1999
12. Glascoe FP. Can teachers’ global ratings identify children with academic problems?J Dev Behav Pediatr.2001;22(3):163–168
13. Reich W, Leacock N, Shanfeld K.Diagnostic Interview for Children and Adolescents–Parent Ver-sion.St Louis, MO: Washington University; 1995
14. Psychological Corporation.Wechsler Individual Achievement Test Manual. San Antonio, TX: Psy-chological Corporation; 1992
15. Mayes SD, Calhoun SL, Crowell EW. Learning disabilities and ADHD: overlapping spectrum disor-ders.J Learn Disabil.2000;33(5):417– 424
16. Bloom JS, Miller CJ, Garcia MA, Hynd GW. Reading disabilities in children with attention-deficit/ hyperactivity disorder. In: Gozal D, Molfese DL, eds.Attention Deficit Hyperactivity Disorder: From Genes to Patients. Totowa, NJ: Humana Press; 2005:337–358
17. US Department of Education.Identification of Specific Learning Disabilities: Individuals with Dis-abilities Education Act (IDEA). Washington, DC: Office of Special Education Programs, US Depart-ment of Education; 2004
DOI: 10.1542/peds.2009-0143 originally published online September 7, 2009;
2009;124;e633
Pediatrics
J. Blum
Amanda E. Bennett, Thomas J. Power, Ricardo B. Eiraldi, Stephen S. Leff and Nathan
Services
Updated Information &
http://pediatrics.aappublications.org/content/124/4/e633
including high resolution figures, can be found at:
References
http://pediatrics.aappublications.org/content/124/4/e633#BIBL
This article cites 8 articles, 1 of which you can access for free at:
Subspecialty Collections
rning_disorders_sub
http://www.aappublications.org/cgi/collection/cognition:language:lea Cognition/Language/Learning Disorders
activity_disorder_adhd_sub
http://www.aappublications.org/cgi/collection/attention-deficit:hyper Attention-Deficit/Hyperactivity Disorder (ADHD)
al_issues_sub
http://www.aappublications.org/cgi/collection/development:behavior Developmental/Behavioral Pediatrics
following collection(s):
This article, along with others on similar topics, appears in the
Permissions & Licensing
http://www.aappublications.org/site/misc/Permissions.xhtml
in its entirety can be found online at:
Information about reproducing this article in parts (figures, tables) or
Reprints
http://www.aappublications.org/site/misc/reprints.xhtml
DOI: 10.1542/peds.2009-0143 originally published online September 7, 2009;
2009;124;e633
Pediatrics
J. Blum
Amanda E. Bennett, Thomas J. Power, Ricardo B. Eiraldi, Stephen S. Leff and Nathan
Performance Questionnaire
Identifying Learning Problems in Children Evaluated for ADHD: The Academic
http://pediatrics.aappublications.org/content/124/4/e633
located on the World Wide Web at:
The online version of this article, along with updated information and services, is
by the American Academy of Pediatrics. All rights reserved. Print ISSN: 1073-0397.