FORMULATION AND EVALUATION OF MEFENAMIC ACID SOLID DISPERSIONS USING PEG-4000
5
0
0
Full text
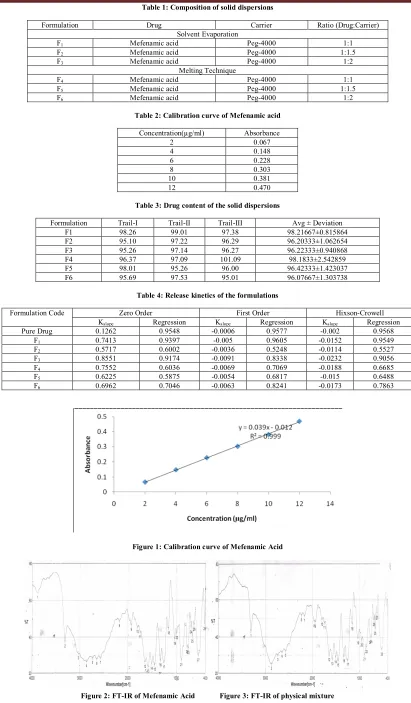
(2) Shaik Jamal Shariff et al. Int. Res. J. Pharm. 2013, 4 (5) Table 1: Composition of solid dispersions Formulation. Drug Solvent Evaporation Mefenamic acid Mefenamic acid Mefenamic acid Melting Technique Mefenamic acid Mefenamic acid Mefenamic acid. F1 F2 F3 F4 F5 F6. Carrier. Ratio (Drug:Carrier). Peg-4000 Peg-4000 Peg-4000. 1:1 1:1.5 1:2. Peg-4000 Peg-4000 Peg-4000. 1:1 1:1.5 1:2. Table 2: Calibration curve of Mefenamic acid Concentration(µg/ml) 2 4 6 8 10 12. Absorbance 0.067 0.148 0.228 0.303 0.381 0.470. Table 3: Drug content of the solid dispersions Formulation F1 F2 F3 F4 F5 F6. Trail-I 98.26 95.10 95.26 96.37 98.01 95.69. Trail-II 99.01 97.22 97.14 97.09 95.26 97.53. Trail-III 97.38 96.29 96.27 101.09 96.00 95.01. Avg ± Deviation 98.21667±0.815864 96.20333±1.062654 96.22333±0.940868 98.1833±2.542859 96.42333±1.423037 96.07667±1.303738. Table 4: Release kinetics of the formulations Formulation Code Pure Drug F1 F2 F3 F4 F5 F6. Zero Order Kslope 0.1262 0.7413 0.5717 0.8551 0.7552 0.6225 0.6962. Regression 0.9548 0.9397 0.6002 0.9174 0.6036 0.5875 0.7046. Kslope -0.0006 -0.005 -0.0036 -0.0091 -0.0069 -0.0054 -0.0063. First Order Regression 0.9577 0.9605 0.5248 0.8338 0.7069 0.6817 0.8241. Hixson-Crowell Kslope Regression -0.002 0.9568 -0.0152 0.9549 -0.0114 0.5527 -0.0232 0.9056 -0.0188 0.6685 -0.015 0.6488 -0.0173 0.7863. Figure 1: Calibration curve of Mefenamic Acid. Figure 2: FT-IR of Mefenamic Acid. Figure 3: FT-IR of physical mixture. Page 156.
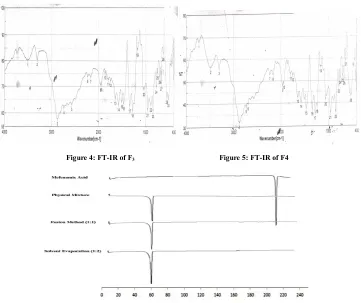
(3) Shaik Jamal Shariff et al. Int. Res. J. Pharm. 2013, 4 (5). Figure 4: FT-IR of F3. Figure 5: FT-IR of F4. Figure 6: DSC Thermograms of Pure Drug, Physical Mixture, F3, F4. Figure 7: In-vitro release studies of Pure Drug, F1, F2, F3. Figure 8: In-vitro release studies of Pure Drug, F4, F5, F6. Page 157.
(4) Shaik Jamal Shariff et al. Int. Res. J. Pharm. 2013, 4 (5). Figure 9: First Order release of Pure Drug, F1, F2, F3, F4, F5, F6. Figure 10: Hixson Crowell plot of Pure Drug, F1, F2, F3, F4, F5, F6. Estimation of mefenamic acid A spectrophotometric method based on the measurement of absorbance at 279nm in phosphate buffer pH 7.4 was used in the present study for the estimation of mefenamic acid. The method was validated for reproducibility, accuracy, precision and linearity by analyzing x individually weighed samples of mefenamic acid. The stock solution of mefenamic acid was subsequently diluted to a series of dilution containing 2, 4, 6, 8, 10 and 12μg/ml of solution, using phosphate buffer of pH 7.4. The absorbance of these solutions was measured in UV‐VIS spectrophotometer (shimadzu 1800). The method obeyed Beer’s law in the concentration of 0‐12μg/ml. Drug content From each batch of preparation 50mg of solid dispersions was taken and analyzed for the drug mefenamic acid. Weighed dispersions were transferred into a 100 ml volumetric flask. Methanol was added and mixed the contents thoroughly to dissolve the drug from the dispersion. The solution was then filtered and collected carefully into another 100 ml volumetric flask. The solution was made up to volume with the solvent 7.4 PH buffer. The solution was suitably diluted with dissolution fluid and assayed at 279nm for mefenamic acid. Dissolution studies of solid dispersions Dissolution rate of mefenamic were studiedto compare the rate of dissolution of solid dispersions with that of pure drug Mefenamic acid using aneight station dissolution rate test apparatus (Electro Lab). The test was performed in USP paddle apparatus using 900ml phosphate buffer solution at pH 7.4 and temperature 37± 0.5 ºC. RESULTS AND DISCUSSION FT-IR Infra-red spectral analysis revealed that there were no interactions between pure drug and solid dispersion. The results are shown in figures 2-5.. DSC DSC was performed for pure drug, Physical mixture, F3 and F4 and no interactions were found between the drug and the polymer and there was no change in the melting point of the drug found, which is evident from the DSC thermograms shown in figure 4. Drug content Drug content of the formulations was witnessed to be 96.07667%, 96.20333%, 96.22333%, 98.1833%, 96.42333%, 98.21667% for the formulations F1, F2, F3, F4, F5, F6 with a standard deviation of 0.815864%, 1.303738%, 0.940868%, 2.542859%, 1.423037%, 1.062654% respectively. All the solid dispersions indicated the presence of high drug content and low standard deviations of the results, which specifies that the drug is uniformly dispersed in to the polymer. Therefore, the methodsand the polymer used in this study finds to be reproducible for preparation of solid dispersion. In-vitro studies In-vitro dissolution studies were performed for pure drug, formulations F1, F2, F3, F4, F5, and F6. The release was found to be 10.23%, 60.06%, 47.05%, 91.86%, 78.13%, 73.51%, 75.08% respectively. There was a very low release with the pure drug which was then increased with solid dispersions. Release rate was found to be the highest in case of F3 in case of solvent evaporation method formulations and F4 in case of melting method formulations. There was a decrease in release in case of the formulations with ratio (1:1.5). An increase of 6.51 folds was observed with F4 and highest rise of 8.14 folds was seen with the formulation F3. Though there was an increase in the dissolution rate of the formulations formulated through melting technique, highest increase in the dissolution rate was found to be with the formulation formulated through solvent evaporation method.. Page 158.
(5) Shaik Jamal Shariff et al. Int. Res. J. Pharm. 2013, 4 (5) Analysis of Dissolution Data of Solid Dispersions as per Hixson-Crowell’s cube root law The dissolution data of Pure drug (mefenamic acid) and the solid dispersions were analysed as per Hixson-Crowell’ s4cube root equation. Hixson-Crowell introduced the concept of changing surface area during dissolution and derived the “cube-root law” to nullify the effect of changing surface area and to linearize the dissolution curves. Hixson-Crowell’s cube root law is given by the following equation. (Wo)1/3 – (Wt)1/3 = Kt, where Wo is initial mass and Wt is the mass remained at time ‘t’. The cube root equation is applicable to the dissolution of monodisperse powder consisting of uniform sized particles. A plot of (Wo)1/3 – (Wt)1/3 versus time will be linear when dissolution occurs from monodisperse particles of uniform size. Hixson-Crowell plots of the dissolution data were found to be linear (Figure 8) with all the formulations. This observation indicated the drug dissolution from all the solid dispersions is occurring from discretely suspended or deposited (MONODISPERSE) particles. This might have also contributed to the enhanced dissolution rate of the solid dispersions. The regression values of the first order release model are found to be higher in comparison to the Hixson-Crowell’s cube root model for F1, F4, F5, F6. Hence the release of drug from the preparations followed predominantly first order kinetics compared to Hixson-Crowell cube root law. But F2, F3 followed Hixson-Crowell cube root law. Slope and regression values of dissolution data as per zero order, first order and Hixson-Crowell cube root are given in Table 4.. CONCLUSION There was a drastic increase in the dissolution of mefenamic acid with use of PEG-4000 as polymer. This ensures that PEG-4000 could be effectively used as a polymer in order to increase the dissolution profile of poorly soluble drugs such as mefenamic acid. ACKNOWLDGEMENT Theauthors greatly thanks to M/s. Sigma Laboratories, Mumbai, India for providing gift sample of Mefenamic Acid, IISc for performing the characterization studies of formulations and East West college of Pharmacy, Bangalore to carry out this research work very successful. REFERENCES 1. Guirguis. M, Jammali. F.Pharmacokinetics of Celecoxib in the Presence and Absence of Interferon-Induced Acute Inflammation in the Rat: Application of a Novel HPLC AssayJ.Pharm.Pharmaceut.Sci. 2001;4(1)1-6. 2. S.C.Sweet Mann, Martindale- The Extra Pharmacopoeia, The Pharmaceutical Press, London, Vol. 33;2005. 3. Jain R, Jani K, Setty CM, Patel D. Preparation and evaluation of Solid dispersions of aceclofenac. Int.J.PharmSci and Drug Research 2009;1(1):32-5. 4. HixonAW, Crowell JH. Dependence ofreaction velocity upon surface and agitation. Ind. Eng. Chem, 1931;23: 923-31. http://dx.doi.org/ 10.1021/ie50260a018 Cite this article as: Shaik Jamal Shariff, Shaik Saleem, Alaparthi Naga Pavan Kumar, Bachupally Ajay Kumar, Punuru Madhusudhan. Formulation and evaluation of Mefenamic acid solid dispersions using PEG-4000. Int. Res. J. Pharm. 2013; 4(5):155-159. Source of support: Nil, Conflict of interest: None Declared. Page 159.
(6)
Figure

Related documents
The present study developed fetal growth charts for BPD, HC, AC, FL, and EFW and compared them with the WHO [ 11 ] and INTERGROWTH-21st [ 16 ] reference charts to determine the
To conclude this section, findings of this study are consistent with those of the previous studies which suggest that Islamic financial products utilized by Bahrain Islamic
Invective Drag: Talking Dirty in Catullus, Cicero, Horace, and Ovid.. Casey
Abstract: Lysosomal acid lipase (LAL) de fi ciency is a metabolic (storage) disorder, encom- passing a severe (Wolman disease) and attenuated (Cholesterol ester storage disease)
The Problems observed in lathe machine – 03 was Locking lever not working properly, if the lever is loose during working of certain operations it may cause
Step 1 : The sensors placed in the field interfaced with the Arduino microcontroller sense real time values at user defined intervals and pass the sensed values to the
The evidence above shows that the short- and long-term unemployed are not equally likely to find jobs, and the unemployed, and in particular the long-term unemployed, may have
Flame length estimates from the different fuel models produced a similar pattern with NFFL model 4, producing the largest estimates, ranging from 27 % to 73 % of
