Integration Of Spatial Heterogeneities In Hydrotel
For Modeling The Hydrological Functioning Of
Agnéby Sub-Watershed At Agboville (Côte
d’Ivoire)
Tchimou Vincent Assoma, Gnangui Christian Adon, Sekouba Oularé, Ségbé Ismaila Koné
University of Felix Houphouet-Boigny, University Center of Research and Application in Remote Sensing (CURAT), 22 B.P. 801 Abidjan 22, Côte d’Ivoire, PH-00225 89 707 034
[email protected]; [email protected]
University of Felix Houphouet-Boigny, Laboratory of Science and Technology of Water and Environment, 22 B.P. 582 Abidjan 22, Côte d’Ivoire,
[email protected]; [email protected]
Abstract: This study aims to modeling the superficial flows of the Agneby sub-watershed at Agboville by integrating spatial heterogeneities into the distributed model of HYDROTEL. The remote sensing data (DEM, ETM+ image of Lansat-7), soils types and hydrographic network are compiled in a geospatial database integrated into the GIS PHYSITEL. It determines Relatively Homogeneous Hydrologic Units (RHHU) that are integrated with the spatial variables of the surface states (land use and textural classes of soils) for physiographic discretization. This physiographic database and the daily hydrometeorological data (flow, rainfall and temperature) are integrated in HYDROTEL for the simulation of the hydrological process of the sub-watershed during the period 1983 to 2006. Calibration of the parameters of the model use the flows of 2000 followed by the temporal validation of the years 1997 and 2004. It reflects a fairly good reproducibility of observed and calculated flows with Nash criteria ranging from 0.61 to 0.70. These precision values reflect a good performance of the model and its applicability in a humid tropical environment. The hydrological processes are fairly well reproduced with a few exceptions, characterized by peaks of overestimation and underestimation of flows due to the occurrence of rainfall decreases due to climate variability and storage and intake structures. The parameters adjusted in the model can be used to explain the overall functioning of the hydrosystem of the studied sub-watershed.
Keywords: Hydrologic Model, GIS Physitel, Hydrotel, Remote Sensing, Agnéby Watershed, Côte d’Ivoire
1.
Introduction
Assessment and integrated management of water resources are at the center of the National Development Plan (NDP). This management is done by watershed because, any activity affecting the water resource, has downstream impacts, and can therefore penalize the uses. The problems of evolution of human activities, coupled with climate change, affect the availability (quantity and quality) of water resources. The hydroclimatic context of West African countries has deteriorated considerably. Côte d'Ivoire experiences rainfall variability that manifests itself in more or less random anomalies and crises since the decade 1970 (Servat et al., 1997, Paturel et al., 1998, Brou, 2005, Assoma, 2013, Assoma et al., 2016). These unpredictables variability tend to significantly disrupt the availability of water resources and the agricultural system in general. The use of digital decision support tools is unavoidable because they make it possible to integrate multi-source data and to make analyzes based on much diversified constraints for an optimization of water management (Dupont et al., 1998). Among these tools, hydrological models are used for understanding the processes and dynamic interactions between environmental and physiographic parameters that occur in hydrosystems. In recent decades, many hydrological models (Singh and Woolhiser, 2002) have been developed to provide solutions to problems in civil engineering, quantitative and qualitative water resource management, soil conservation, and so on. The HYDROTEL model is used in view of its flexibility and compatibility with remote sensing and geographic information system data for the understanding of
hydrological functioning. The assessment and effective management of a territory's water resources requires a thorough understanding of the hydrological processes involved, as well as their particular time and space scales (Singh, 1997). It can be done by spatial analysis methods such as remote sensing and Geographic Information Systems (GIS). The main objective of this study is to contribute to a better understanding of the hydrological functioning of the Agneby sub-watershed at Agboville using geo-environmental data and a distributed hydrological model.
2.
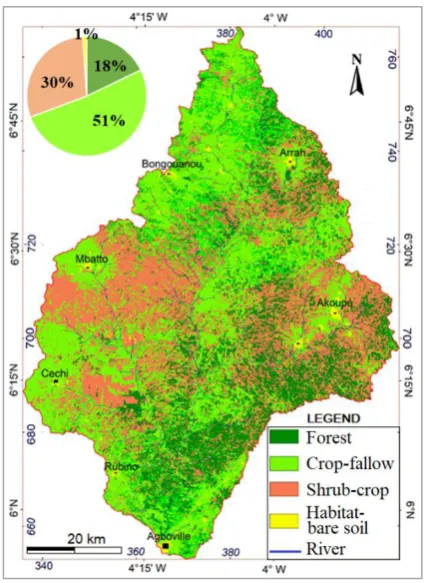
Study Area
Figure 1. Location of Agnéby watershed and the study area
3.
Data and Material
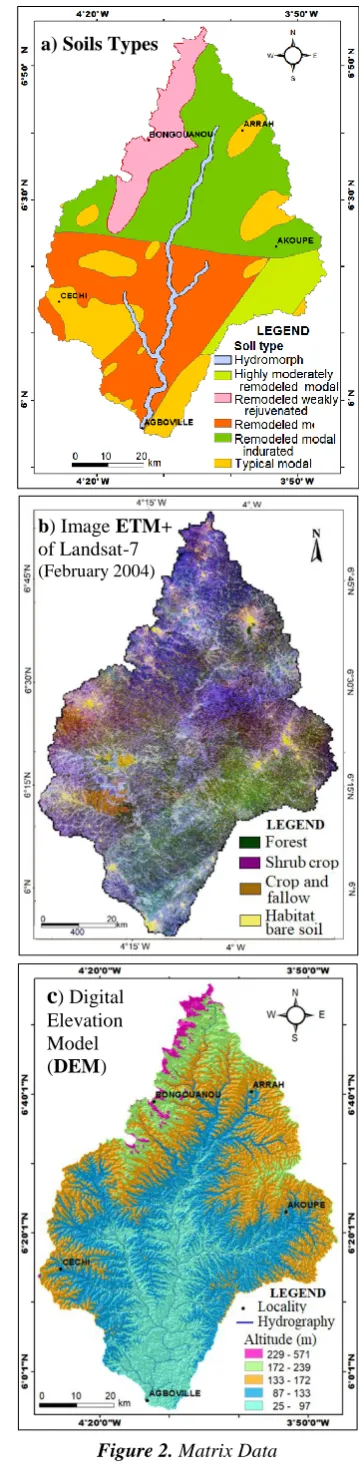
For this study, multi-source data is acquired (Figures 2 and 3):
- matrix data: DEM SRTM (90 m), multispectral image ETM+ of Landsat-7 satellite (February 2004) with 30 m spatial resolution and a soil type map (Perraud et al., 1971);
- vector data composed of hydrographic network and the contour of the sub-watersheds of Agnéby;
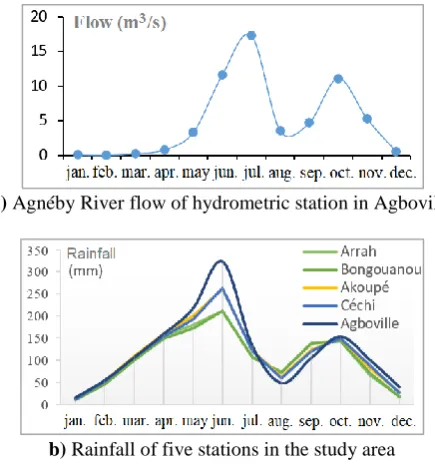
- daily hydrometric and meteorological data (1983 to 2006): measured flows at the hydrometric station of Agboville acquired from the Human Hydraulics Department (HHD) of Abidjan; rainfall and temperatures at five stations from SODEXAM (Airport Development and Exploitation Company, Aeronautics and Meteorology) and the COLUMBIA satellite database for filling gaps.
Figure 2. Matrix Data
a) SoilsTypes
b) Image ETM+
of Landsat-7 (February 2004)
a) Agnéby River flow of hydrometric station in Agboville
b) Rainfall of five stations in the study area
Figure 3. Hydrometric and meteorological data (1983-2006)
The treatment equipment consists of a set of remote sensing and GIS software, available at the University Center for Research and Application in Remote Sensing (CURAT): - QGIS-2.14 (Quantum GIS) for cartographic restitution; - ENVI-5.3 (Environment for Visualizing Images) for the
processing of satellite images;
- GIS PHYSITEL-3.0 for the determination of the flow structure and constitution of the physiographic database; - HYDROTEL-2.6 is a distributed hydrological model that
has been able to simulate continuous flow of water, while optimizing the use of remote sensing and DEM data.
4.
Methods
The application of the HYDROTEL model to this study was possible thanks to its modular design (Figure 4).
Figure 4. Process of modeling the hydrological functioning of the Agnéby sub-watershed at Agboville using HYDROTEL
IMAGES (ETM+) of LANDSAT-7
SOIL TYPE
(Pedology)
DEM SRTM
(90 m)
METEOROLOGIC &
HYDROMETRIC DATA
- Color composition - Sampling class - Supervised
classification (ML) - Filtering and
statistical analysis
- Digitizing map - Particle size
analysis (clay, silt, sand) - USDA Textural
classification
- Boundary of the sub-watershed
- Digitized River importation and regeneration
HYDROTEL Compatible Format
Processing
Land use or
Land cover
Textural class
of soils types
Relief image
Compatible Format :
Rain, T(°C) and Flow
Integration and processing of physiographic data in PHYSITEL
Implementation of
HYDROTEL
Calibration (2000) Validation (1997 & 2004)
Observed and Simulated hydrographs:
(1997 - 2000 - 2004)
Initial set of parameters
Adjustment of main Parameters: ETP coefficient: CETP
Recession coefficient: Kr 3 Layers depth:Zj Fictional water sheet:ZL
Manning coefficient:n satisfying
criterion not satisfying criterion:
Manual calibration "Test-error"
Nash criterion
PHYSIOGRAPHIC
4.1 Physiographic conceptualization of the hydrosystem
The conceptualization of the model relates to the correction of the hydrographic network, the treatment of the matrix data (DEM, pedology and ETM+ images of Landsat-7) according to a spatial discretization, compatible with the requirements of the two modules (PHYSITEL and HYDROTEL).
4.1.1 Typology and textural classes of soils
The composition of sand, silt and clay, characterizes the structure and texture of soils, and this influences the hydrological processes (infiltration and surface flow). To do this, a granulometric analysis of the soil types is done followed by a textural classification using the texture triangle of the United States Department of Agriculture (USDA). In the absence of field measurements, default values of Rawls and Brakensiek (1989) are available and can be assigned to the soil types according to their texture already predefined in the model (choice imposed by the model). This approach makes it possible to determine the hydraulic properties (hydraulic conductivity, saturation water content, wilting point, field capacity, etc.) of the soils.
4.1.2 Land use mapping
The mapping of the land use is made by remote sensing techniques through quantitative and qualitative analyzes of the reflectance values of the Earth's surface. Nomenclature and identification of land-use classes is based on the color composition of the ETM+ bands (7, 5 and 4) and field surveys, followed by sampling of the training plots. A definition of the control classes (field truths) made it possible to validate the land use map carried out by supervised classification using the Maximum Likelihood algorithm (ML). It calculates the discriminant function for each pixel (x) in the image (Richards, 1999) and is evaluated by overall accuracy and Kappa coefficient.
4.1.3 Correction of the hydrographic network topology
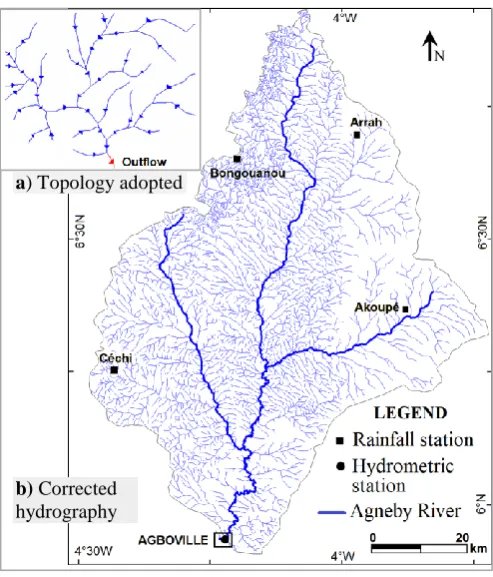
The vector hydrographic network is corrected and edited to ensure a configuration conforming to the requirements and characteristics of the GIS PHYSITEL (Fortin et al., 2004): segmented reaches at the junctions of the terminal nodes, vector directions corresponding to the direction of flow. The whole forms the arborescence polyline with a single outflow (Figure 5).
Figure 5. River network regeneration
4.1.4 Spatial discretization of the sub-watershed
a)Internal drainage structure and UHRH
The drainage structure is determined automatically using PHYSITEL from the coupling of the DEM to the vector hydrographic network to build a drainage matrix network closer to reality. This coupling produces internal drainage structure (slopes and flow directions) at each mesh and characterizes the simulation units (Turcotte et al., 2001, Adon, 2015). The determination of the modeled hydrographic network is made using the recursive algorithm "D8-procedure". Based on the flow directions in each mesh, PHYSITEL delineates the sub-watershed by grouping in a matrix of accumulation, the whole of meshes flowing towards the mesh-outflow (figure 6). For the extraction of the matrix network, this method uses a hydrological criterion. It is based on a surface threshold drained upstream to differentiate the pixels of the network from those of the slopes (Jenson and Domingue, 1988).
Figure 6. Use of the D8-LTD algorithm to compute the flow matrix (Charleux, 2001)
A Relatively Homogeneous Hydrologic Unit (RHHU) is defined as the area associated with a section of river, for which the hydrological response is assumed to be homogeneous (Fortin et al., 2001) and the global approach can be applied. In this study, the cutting of sub-watershed into RHHUs is obtained from the internal flow structure.
a) Topology adopted
b) Integration of surface heterogeneities in each RHHU
Taking into account the spatial organization of the topographic, pedological and land-use components is linked to the understanding of the hydrological processes. In hydrological simulation units, PHYSITEL integrates spatial variability (land use and texture). The simulation of hydrological processes requiring information on these surface states is repeated for each combination of soil type and land use (Fortin and Royer, 2004). For each RHHU, PHYSITEL calculates the topographic index distribution, and characterizes the dominant soil type, and percentages of
different land cover (Rousseau et al., 2011). This spatial discretization of surface heterogeneities provides a physiographic database perfectly integrated with PHYSITEL.
4.2 Modeling hydrological processes
As part of this study, the hydrological processes are modeled in continuous mode at the 24-hour time step, integrates the sub-models with the available algorithms. This test uses about 17 parameters for the five sub-models chosen (Table 1).
Table 1. Tropical modeling option according to Fortin and Royer (2004) modified, indicating choice of optimization algorithms and main parameters
Sub-model (Modeled process) Algorithm Number of main parameters
1. Interpolation of meteorological data Weighted average
(3 nearby stations) 1 •weighted average of rainfall of each UHRH
2. Potential Evapotranspiration (ETP) Hydro-Quebec 2
•coefficient of extinction of solar radiation •leafy index
3. Vertical water balance 3-Layer Vertical Balance (BV3C) 8
•recession coefficient, •3 layer depth of the BV3C, •water content, •RHHU slope, •saturation, •hydraulic conductivity, •pore size, •drying effect
4. Flow on the land part of the
sub-watershed Kinematic wave 4
•Manning coefficient, •lateral flow from one mesh to another, •slope of the mesh
•distance and time
5. Flow in the river system Kinematic wave 2 • water sheet drained • Manning coefficient for land use classes
The development of the hydrological model distributed in the studied hydrosystem requires the following operations: - the interpolation of meteorological data (rainfall and
temperature) in each RHHU;
- Estimate Potential Evapotranspiration (ETp) from the Hydro-Quebec equation (1) using daily maximum (TM)
and minimum (Tm) air temperatures and the optimization
coefficient (CETP) of the ETP :
( ) [ ( ) ] (1)
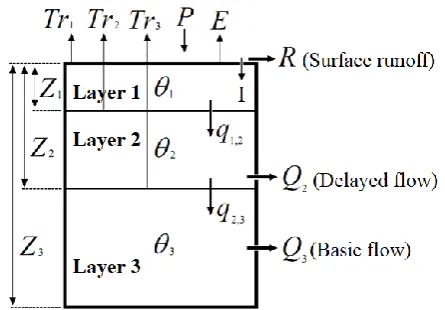
- the determination of the vertical water budget, based on the method of Vertical Water Budget of the 3 Layers (VWB3L) or "BV3C" scheme (Fortin et al., 1995), which initially separates the water sheets that run off the surface of the soil from those that infiltrate (I) in each RHHU. The soil is divided into three layers where the initial moisture conditions are determined: transpiration (Tr1, Tr2 and Tr3 ),
water content (1, 2 and 3), vertical flow (q1,2 and q2,3),
horizontal flow (Q1 and Q2) and evaporation (E) of the bare soil (figure 7);
Figure 7. Conceptual model of BV3C scheme of HYDROTEL (Fortin et al., 1995)
- the runoff (R), delayed flow (Q1) and the base flow (Q2) as determined by BV3C method in each RHHU. The daily flow rate at the outflow of each RHHU (QRHHU) is
determined by linear combination of the GeoMorphological Hydrographs (GMHs) of reference (Moussa, 1991) defined for each UHRH with their real water sheet from the BV3C scheme (2) : whith, (qBV3C) :
flow supply (m3) produced by the BV3C ; (qRef) :
contibution of reference flow (m3) considered during the generation of the geomorphological hydrograph;
⃗ ( ) ⃗⃗⃗⃗⃗⃗⃗⃗⃗⃗
(2) - the flow in the hydrographic network, which represents the process of the flow through a River network, lake and reservoir to the outflow of the sub-watershed. The simulated flows are natural flows (River and lake) but also artificially modulated (dam water retention). The simulation is performed by the choice of the kinematic wave algorithm.
4.3. Calibration and adjustment of HYDROTEL model parameters
The implementation of the model requires the importation into HYDROTEL, the physiographic database produced by SIG PHYSITEL and the integration of hydrometric data (river flows) and meteorological data (rainfall, temperature). For this study, the flow rates observed at the hydrometric station of Agboville are used to calibrate the model. The data used are available over 24 years (1983 to 2006). The pragmatic approach adopted assumes that the physiography of the sub-watershed is stationary and the calibration is done for the year 2000 and the validation for the years 1997 and 2004. The 12 main parameters adjusted for maximizing the performance of the model and influencing the results are: - the optimization coefficient of the potential
- the Recession coefficient (Kr), the depth of the three soil layers (Zj) and their initial Humidities (ij) for the BV3C submodule;
- the fictional water sheet (ZL) and the three Manning
Roughness Coefficients (n) of the Geomorphologic Hydrograph (HGM) concept for lateral transfers.
The numerical setting of the model parameters is done manually (Test-Error method) so as to minimize the errors between the observed and simulated values. After the test, if the criterion is not satisfactory, an adjustment of the values of some parameters is carried out for a new simulation. This process is repeated until the calculated flows are comparable to the observed flow rates (satisfactory criterion). The analysis of the hydrographs (simulated and observed) leads to the choice of the best combinations of the parameter sets giving for an optimal simulation.
4.4 Temporal validation and model optimization criterion
Based on the daily flow availability of the Agboville hydrometric station, only the time validation is carried out for the years 1997 and 2004. It makes it possible to check the reproducibility of the results by the model and the representativity of the calibration parameters. The mathematical criterion of optimization (3) of Nash and Sutcliffe (1970) is calculated in order to appreciate the degree of synchronism between the simulated and observed hydrographs.
(∑ ( ) ⁄∑ ( ) ) (3)
With, QCal: calculated rate at time step i, QObs: observed flow
rate at time step i, Q: average flow over the period, n: number of simulations.
5.
Results
5.1. Heterogeneity of surfaces related to hydrological processes
5.1.1 Parameters related to soil types
Water infiltration is strongly influenced by the soil texture (soil parameter), the soil structure, its thickness and the lithology encountered at its base. For this study, only the textural analysis is imposed by PHYSITEL module. Six soil units of the sub-watershed could be identified (Table 2). The projection of their content of clay, silt and sand in the textural triangle allowed to identify 3 textural classes (Figure 8) with a dominance of Sandy clay loam (83%) and sandy-loam (14%) against 3% of clay sandy-loam.
Figure 8. Textural classes of soil type of Agnéby sub-watershed in Agboville
Table 2. Soil types and corresponding textural classes of the Sub-watershed
Soil type Content (%) Textural
Class Sand Silt Clays
1. Remodeled hardened
modal 61.31 10.31 28.38
Sandy clay loam (83%)
2. Remodeled weakly
rejuvenated 61.65 10.15 28.20
3. Highly, moderately
remodeled and modal 60.35 10.15 29.5
4. Remodeled modal
indurated 61.64 10.15 28.21
5. Typical modal 75.1 9.8 15.1 Sandy-loam
6. Hydromorph 33.05 28.77 38.18 Clay loam
5.1.2 Parameters related to land cover
The land cover map (Figure 9) shows the following surface components:
- dominance of a mosaic of annual crops and fallow (51%) estimated at 2,446 km²;
- shrubs crops (rubber, teak, coffee and cocoa) for 30% estimated at 1,408.8 km²;
- some shreds or forest relics (18%) for an area of 846.7 km²;
Figure 9. Land use of Agnéby sub-watershed at Agboville result of the multispectral imagery of Landsat-7 (ETM+) of
February 2004.
The classification is evaluated from the Confusion Matrix (Table 3), which shows satisfactory results in terms of overall accuracy (PG = 92.2%) and Kappa coefficient (Kappa = 0.88). However, there is some confusion on the order of 9% between fallows and forests and 10% between shrubs and fallows. These confusions are due to close spectral signatures between these entities. These land use classes are used in the characterization of the hydrological parameters necessary for modeling the functioning of the hydrosystem.
Table 3. Confusion matrix of the classification result of the Maximum Likelihood (ML) method
Land use Pixels of reference classes (ground truth) Total User
accuracy
Error or commission Forest Habitat Crop-fallow Shrubs crops
C
la
ssi
fi
ed
p
ix
el
s
Forest 2479 0 254 0 2733 90.7% 9.3% Habitat 0 427 0 0 427 100% 0% Crop-fallow 0 2 3737 329 4068 91.8% 8.2% Shrubs crops 0 0 189 7541 7786 96.8% 3.2%
Total 2479 429 4236 7870 15373
Director accuracy (%) 100 99.5 88.2 95.8 PG = 92.2%
Kappa = 0.88
Error or omission (%) 0 0.5 11.8 4.2
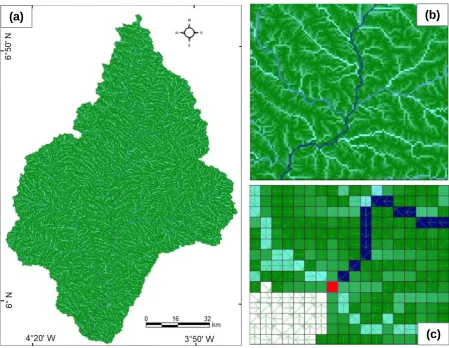
5.2. Internal flow structure and heterogeneity of hydrological units
The of the D8-LTD algorithm integrated in the PHYSITEL module identified the neighboring meshes whose direction of flow is directed towards the mesh-outflow, then by recursive neighborhood, are identified all the meshes forming part of the sub-unit. watershed (Figure 10). For a mesh to be considered as mesh-river, a threshold of 2,500 meshes
Figure 10. Internal flow structure: (a) Drained surfaces of the Agnéby sub-watershed at Agboville, (b) River mesh sections, (c) Flow direction by mesh for the mesh-outflow identification (■).
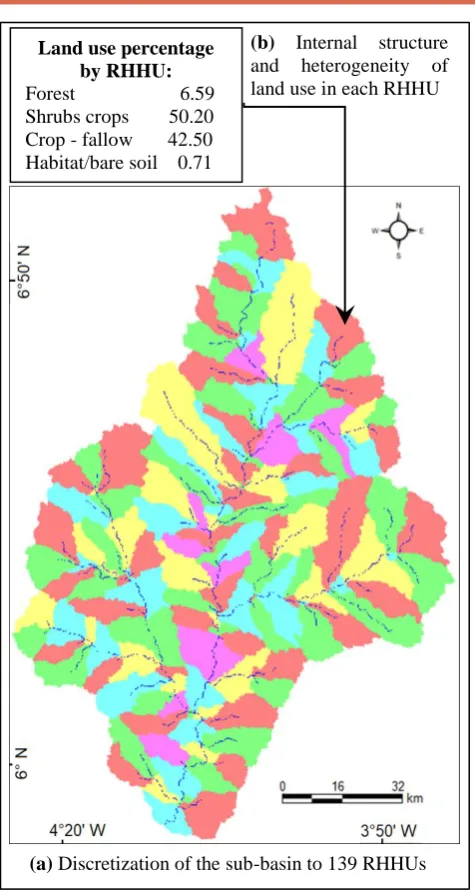
It includes the main processes of production and transfer of water flows, each outflow of which is a point of confluence of the hydrographic network. This one, coupled with the DEM, made it possible to obtain 139 UHRHs, whose average area of each is 34 km² (Figure 11a). These spatial hydrological units allow the integration of surface states and the conceptualization of hydrological processes and give a fine representation of the hydrosystem, seat of varied hydrological processes with multiple and complex interactions. Within each of the 139 hydrological units, the proportions of the land use classes are calculated using PHYSITEL by the intersection of the UHRHs with the land cover map (Figure 11b).
(a)
(b)
Figure 11. Segmentation to RHHU of the sub-watershed of Agnéby at Agboville
Crossing soil texture classes to hydrological units groups UHRHs according to their dominant texture. This defines soil saturation levels by their water-holding capacity useful
for modeling (Figure 12). This grouping allows to identify the values of the hydrodynamic properties of each textural class of the sub-watershed studied for the flow simulation (Table 4). The most significant differences between these properties are found in the hydraulic conductivity values (Ks) of the sandy silt (0.0259 m/s), which differs from those of the clay-silt sands (0.0043 m/s) and silt loams (0.0023 m/s).
Figure 12. Map of soils types by UHRH allowing grouping according to their dominant texture.
Table 4. Hydrodynamic properties of soils selected for modeling based on Rawls and Brakensiek (1989)
Soil texture (USDA) S cc pf Ks s α
Sandy silts 0.412 0.207 0.095 0.0259 0.3020 0.378 4.5 Sandy clay loam 0.330 0.255 0.148 0.0043 0.5941 0.319 3.5 Clay loams 0.390 0.318 0.197 0.0023 0.5643 0.242 2.0
s: saturation water content (cm3/cm3), cc: water content at field capacity (cm3/cm3), pf: water content at permanent wilting point
(cm3/cm3), Ks: hydraulic conductivity (m/s), s: saturation matrix potential (m), : pore size distribution, α: coefficient of the exponent in the calculation of the drying coefficient.
5.3 Simulation of flows
5.3.1 Calibration of the model
The calibration of the HYDROTEL model for the year 2000 is observed at the outflow of the sub-watershed of Agnéby River at Agboville with a satisfactory criterion of Nash = 0.65. The water sheets observed (35.8 mm) and simulated (27.5 mm) show a fairly good correlation between the geomorphological hydrographs (Figure 13). The
optimization criterion obtained and the graphical analysis of the profile show a concordance between the simulated and observed daily flows. The analysis of the hydrographs presents specific hydrological indicators (floods and low flows). The general appearance of floods that express flows is well simulated in wet season (May to November), as well as recessions. However, there are peaks of overestimation and declines in underestimation by location. Low-water periods in the dry season (December to April) are marked by
Land use percentage by RHHU:
Forest 6.59 Shrubs crops 50.20 Crop - fallow 42.50 Habitat/bare soil 0.71
(b) Internal structure and heterogeneity of land use in each RHHU
drying out or small and unmeasurable flows. The low flows simulated during these dry periods when they are not observed are linked to various causes that can be justified by
water intakes (catchment and storage works) located along the river.
Figure 13. Hydrographs of model calibration at the Agnéby station in Agboville
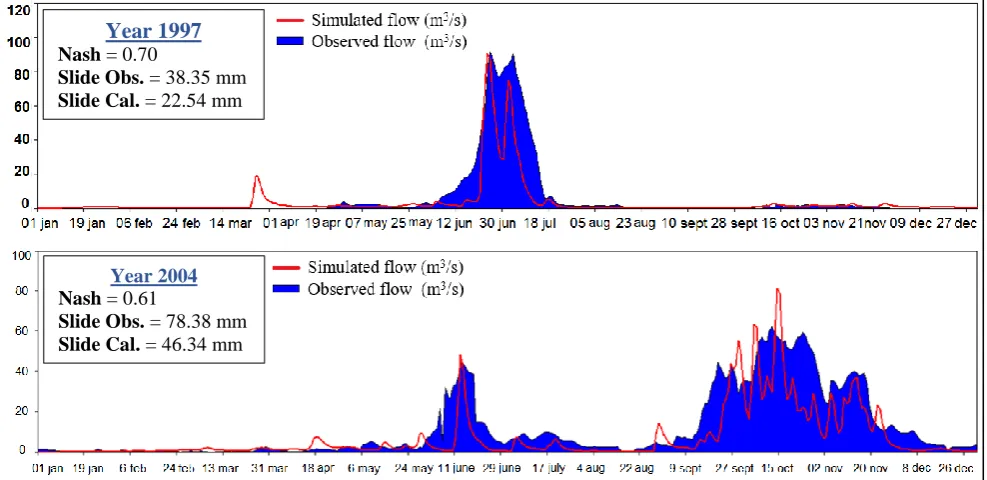
5.3.2 Temporal validation of model calibration
The validation (Figure 14) is carried out over two periods (1997 and 2004) to judge the temporal representativeness of calibration parameters, according to the same sets of parameters used for the calibration of the model in 2000. The general appearance of the hydrographs is characterized by a seasonal fluctuation, marked by peaks (floods), followed by a rapid emptying (low flow) of the reservoirs. The temporal validation of the calibration for the year 1997, indicates a criterion of Nash = 0.70. The water sheets observed and simulated are respectively 38.5 mm and 22.5 mm and the pace of the hydrographs is fairly synchronous. Like calibration, an underestimation of the flows is done during the wet period (June-July) during this validation. That is justified by floods that are abundant than those calculated by the model. The modeled hydrosystem is subject to the same low-flow conditions during the dry period (December to April) and even during the short rainy season
(September-October). The temporal validation of the model for the year 2004, gives the result of more realistic simulation with a criterion of acceptable accuracy (Nash = 0.61). There is an underestimation of the simulated flows during periods of high flood and good simulation during recessions and dryings. This validation is marked by two rainy episodes. During the flood period (September to November), we notice in some places an overestimation and, on the other hand, an underestimation of the peaks which is verified through the water sheets that have passed. The hydrological processes are fairly well reproduced with a few exceptions. This expresses a good performance and the applicability of the HYDROTEL model in the Agnéby sub-basin of Agboville. Values for Nash optimization criteria range from 0.61 to 0.71. The differences between the values simulated by the model and those observed seem to be due to a problem of extrapolation of the calibration parameters.
Figure 14. Temporal validation hydrographs of model calibration at the Agnéby station in Agboville
Year 2000
Nash = 0.65
Slide Obs. = 35.85 mm
Slide Cal. = 27.51 mm
Year 1997
Nash = 0.70
Slide Obs. = 38.35 mm
Slide Cal. = 22.54 mm
Year 2004
Nash = 0.61
Slide Obs. = 78.38 mm
5.3.3 Sensitivity of adjustment of the model parameters
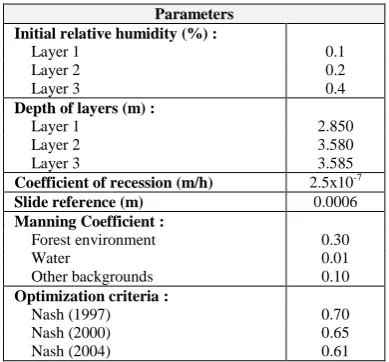
The values of the main parameters influencing the vertical balance of the layers and of the flow in the hydrographic network are presented in Table 5. These parameters used during calibration of the model can be retained to explain the overall functioning of the hydrosystem of Agnéby sub-watershed in Agboville.
Table 5. Values of the main adjustment parameters of the HYDROTEL at the Agnéby station in Agboville
Parameters Initial relative humidity (%) :
Layer 1 0.1
Layer 2 0.2
Layer 3 0.4
Depth of layers (m) :
Layer 1 2.850
Layer 2 3.580
Layer 3 3.585
Coefficient of recession (m/h) 2.5x10⁻⁷
Slide reference (m) 0.0006
Manning Coefficient :
Forest environment 0.30
Water 0.01
Other backgrounds 0.10
Optimization criteria :
Nash (1997) 0.70 Nash (2000) 0.65 Nash (2004) 0.61
6.
D
ISCUSSIONThe peculiarity of this study lies in the taking into account of the heterogeneity of surface (ground occupation, modeling of the relief and the texture of the types of soil) in the hydrological modeling. Remote sensing mapping provided relevant information of land cover. The DEM data used is a valuable new source of topographic information and its importance for distributed hydrological modeling has been highlighted by authors (Grayson et al., 1995; Charleux, 2001). It made it possible to generate the flow directions inside the physiographic discretization meshes (90x90 m) and to identify simulation units. In this case, spatial resolutions of 50, 100 or even 200 meters are generally acceptable and are good compromises between data accuracy and processing time (Fortin et al., 2004). The structure of spatialized models is based on a segmentation of space in hydrological units according to several approaches:
-square mesh cutting according to the model of the European Hydrological System (EHS) (Abbot et al., 1986); -cutting according to the topography defining the
Representative Elementary Watershed (REW) as is the case of the TOPMODEL model (Beven and Freer, 2001); -cutting according to Homogeneous Units (HUs) where the
global approach is applied.
In its conception, the HYDROTEL model uses cutting in UH called Relatively Homogeneous Hydrological Units (UHRHs) which is defined by the representation of the hydrographic network (Fortin et al., 2001). These homogeneous units are built to integrate surface heterogeneities because they are larger than the physiographic discretization mesh. Indeed, the coherence of the scales is a condition for the construction of a rigorous model (Refsgaard and Strom, 1995). In each UHRH, percentages of soil textures and land cover classes are evaluated according to their presence on the unit under
consideration. The main advantage of UHRHs is that they allow a gain in the calculation time. Oularé (2007) has shown that the notion of size of homogeneous zones is arbitrary and their number is more constrained by the capacity of calculation than by a relevant reflection. The simulations carried out express good reproductivity of the hydrological processes on the Agneby hydrosystem at Agboville both in terms of lateral and vertical transfer functions with Nash optimization criteria ranging from 0.61 to 0.75. HYDROTEL has shown its potential on watersheds in Canada (Fortin et al., 2001). It has been validated on the Chaudière River (6,680 km²) in the province of Quebec. It has been successfully tested in the Orb catchment area (1,573 km²) in France. Recently, this model was used in a tropical environment, specifically in Côte d'Ivoire, to simulate flows in the N'Zo (7,350 km²) and N'Zi (35,500 km²) watershed. Its use in the Agnéby sub-watershed at Agboville (4,749 km²) has made it possible to test its applicability in a tropical watershed of medium size, with an agricultural vocation. Similar studies of global simulations of N'Zo watershed (Kouamé et al., 2007) with Nash between 0.78 and 0.91 and N'Zi watershed (Adon, 2008) with Nash ranging from 0.56 to 0.91. The applicability of these types of models to large watersheds without high spatial resolution data is difficult and raises the problem of equifinality in the estimation of parameters, specifically when data for internal validation is scarce (Grayson et al., 1992). HYDROTEL model simulation is less efficient during low water periods. This is confirmed by Indarto (2002) in the Orb catchment in France, N'Zo (Kouamé et al., 2007) and Bandama in Côte d'Ivoire (Kouamé, 2013; Amessan et al., 2014; Kouamé et al., 2016). For the latter, taking into account the variability of the soil as a function of the depth could certainly refine the outputs of the hydrological balance. As a matter of fact, the BV3C model considers the soil profiles of UHRHs as being uniform both horizontally and vertically. Similarly, the addition of geostatistical methods in precipitation estimation could improve the results of the HYDROTEL model. Indeed, the results of Rawls et al. (1982) related to textures of soil types, can be used to study theoretical models by comparison with an extensive set of experimental data. One of the advantages of mathematical modeling of watersheds is undoubtedly the possibility of understanding the functioning of hydrosystems (Fortin et al., 1990, Turcotte et al., 2001), but also of explaining the weaknesses of certain simulations. The distributed HYDROTEL conceptual model differs from the previous methods; by characterizing the UHRH domain integrating the spatial variability of physiographic and climatic data. Its process is dynamic at the daily time step with a high level of flow physics in the soil, on the other hand, the performance criteria could be improved by methods of analyzing simulated flow uncertainties. This is attributable to uncertainties related to modeling parameters as advocated by Ben Nasr (2014).
7.
Conclusion
of surface heterogeneities are taken into account for modeling. The physiographic database is made in SIG PHYSITEL. The integration of this hydrometric database with climatic variables together with the definition of the initial sets of parameters allowed the implementation of the HYDROTEL model. The calibration of the model for the year 2000 and the temporal validation (1997 and 2004) allowed to check the reproducibility of the results of the model. The flow simulation revealed disturbances in the hydrological regime partly influenced by storage structures (hydro-agricultural dams) and catchment (water intake) during low-water periods. The study locates vulnerable periods to flooding, characterized by flood phases. It proposes the realization of a modeling coupled surface water and underground water and to estimate the spatio-temporal distribution of the potential recharge for a rational management of the water resources of the Agnéby region.
References
[1] Abbott M.B., Bathurst J.C., Chunge J.A., O'Connell P.E., Rasmunsen J., “An Introduction to the Europeean Hydrological System - Systeme Hydrologique Europeen, "SHE". 1: History and philosophy of a physically-based distributed modelling system”. Journal of Hydrology, Vol.87, Issus 1-2, pp. 45-59, 1986. doi.org/10.1016/0022-1694(86)90114-9
[2] Adon G.C.R., Apports des données géospatiales et d’un modèle distribué (HYDROTEL) à la modélisation d’un hydrosystème à vocation agricole : cas du bassin versant du N’zi en milieu tropical humide de Côte d’Ivoire. Mémoire DEA, Science et Technique, Université de Cocody, Abidjan, Côte d’Ivoire, 74 p, 2008. (in French)
[3] Adon G.C.R., Evaluation des potentialités en eau de l’hydrosystème de la Haute Marahoué (Côte d’Ivoire) : apports des données géospatiales, du modèle hydrologique "HYDROTEL" et de l’analyse multicritère. Thèse Unique de Doctorat, Université Félix Houphouët-Boigny, Côte d’Ivoire, N°938/2015, Côte d’Ivoire, 143 p, 2015. (in French)
[4] Amessan M., Kouamé K.F., Lasm T., N'guessan Bi V. H., Aka K. and Biémi J., “Modeling and simulation of surface runoff in the watershed of the White Bandama: using a distributed model (HYDROTEL)”. International Journal of Innovation and Scientific Research, Vol. 11, n°2, pp. 457-470, 2014. (in French)
[5] Assoma T.V., Variabilité hydroclimatique et évaluation des ressources en eau du bassin côtier de l'Agnéby au Sud-est de la Côte d’Ivoire : apport des outils statistiques, de la modélisation et de la télédétection optique et radar. Thèse Unique de Doctorat, Science et Technique, N°750/2013, Université Félix Houphouët-Boigny, Côte d’Ivoire, 196 p, 2013. (in French)
[6] Assoma V.T., Adiaffi B. et Koudou A., “Influence de la Variabilité Climatique sur les Réserves en eau du sol et dans les Systèmes Agricoles du Bassin Côtier de l’Agnéby (Côte d’Ivoire)”. European Journal of Scientific Research, Vol.143, n°2, pp.186-202, 2016. (in French)
[7] Ben Nasr I., Incertitudes sur les débits simulés par le modèle HYDROTEL attribuables aux incertitudes sur les paramètres - Application au bassin de la rivière Beaurivage, Québec, Canada. Mémoire, Université du Québec, Institut national de la recherche scientifique, Maîtrise en Sciences de l'Eau, 94 p, 2014. (in French) [8] Beven K.J. and Freer J., “A Dynamic TOPMODEL.
Hydrol”. Process, Vol. 15, n°10, pp. 1993-2011, 2001. [9] Brou Y.T., Climat, mutations socio-économiques et
paysages en Côte d’Ivoire. Mémoire Habilitation à Diriger des Recherches, Univ. Sciences et Techniques de Lille, France, 212 p, 2005. (in French)
[10] Brou Y.T., Akindès F., et Bigot S., “La variabilité climatique en Côte d’Ivoire : entre perceptions sociales et réponses agricoles”. Cahiers Agricultures, Vol.14, n°6, pp. 533-540, 2005. (in French)
[11] Charleux D., Qualité des Modèles Numériques de Terrain pour l’Hydrologie : Application à la Caractérisation du Régime de Crues des Bassins Versants. Thèse de Doctorat, Université Paris-Est de Marne la Vallée, 275 p, 2001. (in French)
[12] Dupont J., Smitz J., Rousseau A.N., Mailhot A. et Gangbazo G., “Utilisation des outils numériques d’aide à la décision pour la gestion de l’eau”. Revue des Sciences de l’Eau, Numéro Spécial, pp. 5-18, 1998. (in French)
[13] Fortin J.P. et Royer A., “Le modèle hydrologique HYDROTEL : bases théoriques. Manuel d’utilisation”. Rapport INRS-ETE, Sainte-Foy, 104 p, 2004. (in French)
[14] Fortin J.P., Lavoie P. et Royer A., “PHYSITEL, Informations Générales”. Institut Nationale de Recherche Scientifique (INRS)-ETE, 25 p, 2014. (in French)
[15] Fortin J.P., Moussa R., Bocquillon C. et Villeneuve J.P., “HYDROTEL, un modèle hydrologique distribué pouvant bénéficier des données fournies par la télédétection et les systèmes d’information géographique”. Revue des Sciences de l’Eau, n°8, pp. 97-124, 1995. (in French)
[16] Fortin J.P., Turcotte R., Massicotte S., Moussa R. Fitzback J. and Villeneuve J.P., “Distributed watershed model compatible with remote sensing and GIS data: Application to Chaudière watershed”. Journal of hydrologic Engineering, Vol.6, n°2, pp. 100-108, 2001. doi.org/10.1061/(ASCE)1084-0699(2001)6:2(100) [17] Fortin, J.-P., Villeneuve J.-P. and Bocquillon C.,
[18] Grayson R. B., Bloschl G. and Moore I., "Distributed Parameter Hydrologic Modelling Using Vector Elevation Data: Thales and Tapes-C". Chapter 19 In: Computers models of waterheds Hydrology, V. P. Singh, (ed.), Water Resources Publications, pp. 669-695, 1995.
[19] Grayson R.B., Moore I.D., McMahon T., “Physically based hydrological modelling: 1. A terrain-based model for investigative purposes”. Water Resources Research, 28(10): 2639-2658, 1992. doi.org/10.1029/92WR01258 [20] Indarto K., Découpages spatiaux et conséquences sur le
bilan hydrologique: application au bassin de l’Orb à travers une démarche de modélisation hydrologique distribuée. Thèse de Doctorat, ENGREF Montpellier, 220 p, 2002. (in French)
[21] Jenson S.K. and Domingue J.O., “Extracting topographic structure from Digital Elevation data for geographic information system analysis”. Photogrammetric Engineering & Remote Sensing, 54(11), pp. 1593-1600, 1988.
[22] Kouamé K.A., Application du modèle hydrologique distribué HYDROTEL à la simulation des écoulements des eaux en milieu tropical humide soumis aux pression anthropiques: cas du bassin versant du Bandama en Côte d’Ivoire. Thèse Unique de Doctorat, Université Félix Houphouët-Boigny, Côte d’Ivoire, 165p, 2013. (in French)
[23] Kouamé K.A., Oulare S, Adon G.C.-R., Kouamé K.F., Kouassi A.M. et Bernier M., “Un modèle hydrologique distribué pour la simulation des écoulements des eaux du bassin versant du Bandama en Côte d’Ivoire, Afrique de l’Ouest”. Afrique Science, Vol.12, n°1,
2016. (in French)
http://www.afriquescience.info/document.php?id=5856. ISSN 1813-548X.
[24] Kouamé K.F., Bernier M., Goné D., Saley B., Lcfèbvre R., Soro N. et Koudou A., “Intégration de données géospatiales dans un modèle hydrologique distribué pour la simulation des écoulements des eaux en milieu tropical humide de Côte d’Ivoire (Afrique de l’ouest)”. Revue Télédétection, Vol. 7, n°1-4, pp. 217-235, 2007. (in French)
[25] Moussa R., Variabilité spatio-temporelle et modélisation hydrologique: application au bassin du Gardon d'Anduze. Thèse de doctorat, Université des Sciences et Techniques du Languedoc, Montpellier II, 314 p, 1991. (in French)
[26] Nash J.E. and Sutcliffe, J.V., “River flow forecasting through conceptual models. A discussion of principles”. Journal of Hydrology, Vol. 10, pp. 282-290, 1970. [27] Oularé S., Mise en place d’une base de données pour
une modélisation Hydrologique distribuée du bassin versant de la Mé : Apport d’un Modèle Numérique d’Altitude, de la télédétection et du SIG. Mémoire
DEA, Université de Cocody, Abidjan, 73 p, 2007. (in French)
[28] Paturel J.E., Servat E., Delattre M.O., Lubès-Niel H., “Analyse de séries pluviométriques de longue durée en Afrique de l'Ouest et centrale non sahélienne dans un contexte de variabilité climatique”. Hydrological Science Journal, Vol. 43, n°6, pp. 937-946, 1998. (in French)
[29] Perraud A., Les Sols. In: Le milieu naturel de la Côte d’Ivoire. Mémoire ORSTOM n°50, pp. 265-374, 1971. (in French)
[30] Rawls W. & Brakcnsick D., “Estimation of soil water retention and hydraulic properties”. In: Morel-Seytoux (eds), Unsaturated Flow in Hydrologic Modelling: Theory and Practice. Kluwer Academic Publisher, pp. 275-300, 1989.
[31] Rawls W., Brakensiek D. & Saxton K., “Estimation of soil water properties”. Transactions of the ASAE. 25 (5): 1316-1320, 1962. doi:10.13031/2013.33720 [32] Refsgaard, J.C. & Storm, B., “MIKE SHE”. In:
Computer models of watershed hydrology. Singh, V.P. Ed., Water Resources Publications, Colorado, USA, pp. 809-846, 1995.
[33] Richards J.A., Remote Sensing Digital Image Analysis. Springer-Verlag, Berlin, 240 p, 1999.
[34] Rousseau A.N, Fortin J.-P, Turcotte R., Royer A., Savary S., Quévy F., Noël P., Paniconi C., “PHYSITEL, a specialized GIS for supporting the implementation of distributed hydrological models”. Water News-Official Magazine of the Canadian Water Resources Association, Vol.31, Issue 1, pp.18-20, 2011. [35] Servat E., Paturel J.E., Lubès-Niel H., Kouamé B. et Mason J.M., “Variabilité climatique en Afrique humide le long du Golfe de Guinée. Première partie : analyse détaillée du phénomène en Côte d'Ivoire”. Journal of Hydrology, 191: 1-15, 1997. (in French)
[36] Singh V.P. & Woolhiser, D.A., “Mathematical modeling of watershed hydrology”. Journal of Hydrologic Engineering, Vol. 7, n°4, pp. 270-292, 2002.
[37] Singh V.P., “Effect of spatial and temporal variability in rainfall and watershed characteristics on streamflow hydrograph”. Hydrological Processes, Vol.11, pp.1649-1669, 1997.