Evaluating The Effectiveness Of A PhET
Simulation For Teaching And Learning Of „Turning
Effect Of Force‟ In Physics At Secondary School
Level
Madawala Liyanage Shanaka Piyatissa, Md Gapar Md Johar, Arun Kumar Tarofder
Graduate School of Management, Management and Science University, No.4, Persiaran Olahraga, Section 13, 40100, Shah Alam, Selangor, Malaysia
Academic Department (Vice President Academic), Management and Science University, No.4, Persiaran Olahraga, Section 13, 40100, Shah Alam, Selangor, Malaysia,
Faculty of Business Management and Professional Studies, Management and Science University, No.4, Persiaran Olahraga, Section 13, 40100, Shah Alam, Selangor, Malaysia
Abstract: This paper is based on the results of a pilot study conducted to evaluate the effectiveness of a PhET simulation (sim) called, „Balancing Act‟ developed by Colorado University, Boulder, when it is used as a visualization tool in teaching the secondary school physics lesson „Turning Effect of Force‟. A sample of 72 students of grade 11 from two government schools in Sri Lanka was selected for the study. This is a field study to assess the effectiveness of a teaching approach to elaborate the visualization aspect of the lesson. A „pre-test and post-test experimental and control group design‟ was used in the study. The experimental group was taught the lesson using the sim in addition to the usual classroom teaching and the control group was also taught for the same time period in the usual way without the use of sim. A set of physics questions to test the students‟ attainment of visualizing the lesson which is called Visualization Related Test (VRT) in the study was used as a pre-test and a post-test. Cronbach‟s alpha coefficient of 0.738 showed in the pre-test administration for the VRT for all students ensured its reliability. The students in experimental group showed a 27% gain in the post-test administration of VRT compared to the pre-test while that in the control group was 2%, proving the effectiveness of the new teaching approach in grasping the theories built for the purpose of explaining invisible phenomenon (what is visible here is only the effects of it).
Keywords: Assessment, Interactive simulation, Turning effect of force, Visualization
1.
Introduction
„Turning effect of force‟ is a physics lesson which is usually introduced to the students at the secondary school level. The lesson calls for a certain amount of visualization which a computer based visualization tool - „Balancing Act‟ - being one of the tools belonging to PhET simulation family, can successfully provide when taken parallely with textbook explanations. Selecting „Balancing Act‟ simulation tool as adequate for teaching and learning of this lesson was to a certain extent influenced by the wide acceptance of its capabilities by the teaching community in general and the fact that PhET simulation kit has already been recommend by the National Institute of Education (NIE), Sri Lanka for government schools in the country (NIE is the government body responsible for developing school curricula in the country). They have gone a step further by adding a short instruction manual to it in addition to translating it into two of the country‟s vernacular languages. This study highlights the fact that this interactive simulation works well to support the textual and verbal explanations of the scientific principles which are difficult to understand due to lack of tangible nature of this concept of force. None of these teaching methods, that is the approach used in the experiment (use of visualization tools to highlight the visualization aspect in the lesson) and the traditional method attempts to replace each other. In other words, the traditional teaching methods of chalk and talk, note taking, etc., work in complete harmony with this computer based interactive learning material that
can be considered a hallmark of success for a revolutionary innovation in teaching. The examiners‟ reports issued by Department of Examinations, Sri Lanka for the period 2009-2015 of the subject „science‟ (which consists of biology, chemistry and physics) revealed that more than 50% the students scored 0-25% of the total marks allocated to the structured essay type and essay type questions in physics section at the General Certificate of Education-Ordinary Level (GCE-OL) examination (the GCE-OL examination covers the syllabi of grade 10 and grade11 classes) [1], [2], [3], [4], [5], [6], [7]. Generally students of age 15-16 years sit this examination which determines the streams of education they should select for further studies. The low performance level in physics warranted an in-depth study of this situation which resulted, among other things, in selecting the use of visualization tools to elaborate the visualization related areas in the lesson as a supplementary teaching approach. The representative lesson selected for this experiment was „turning effect of force‟ which was found on a random interviewing of students, to be a difficult lesson to many students.
2.
Literature Review
representation and visualizing process. The second sub area, representation is a structure that stands for something such as a sentence for a principle, a diagram for an arrangement of objects, a picture for a scene, etc. [16]. The third sub area, model is as a simplified representation of a phenomenon which can be physically observed or of a hypothetical scientific concept/theorem [29]. However, visualization covers complex cognitive and brain processes and it is difficult to find an exact definition for the term „visualization‟. Gilbert suggested that the external representations can be categorized into five modes of (external) representations, namely, the material (the concrete) mode, the verbal mode, the symbolic mode, the visual mode, and the gestural mode [9]. The concrete mode is where various physical models or practical set-ups are used to explain the subject matter. The verbal mode involves written and spoken language used to explain the subject (including analogies, similies, historical evolvement of the subject presented as a story, etc.). The symbolic mode basically involves use of standard symbols, and use of mathematical equations to represent the relationships among physical quantities. The visual mode is supported by diagrams, graphs, videos, animations, simulations, etc. The gestural mode mainly consists of gestural expressions used by the teacher to explain the subject (including dramatized demonstrations, role plays, etc.). Further each of these modes may contain sub modes. Learning a particular physics lesson may involve several of the above modes and the teacher needs to be sufficiently conversant with this aspect to help the students to toggle between the modes and the sub modes depending on the lesson. Corresponding to external representations, the learner builds internal representations which can be called mental images, imaginations, visualizations, or visual-perceptions in science education [9], [10]. Further, these external representation modes are used by learners to construct their internal models which can be called private models that matters in their individual understanding [9], [24]. Though the private models are subjective they correspond to external models which the scientific community have a common agreement on (e.g. atomic structure of hydrogen, a circuit diagram of a simple transistor circuit), and they are referred to as public models [9]. When dealing with the above mentioned models in science education, the student should achieve the capability of visualizing the models in three levels of representation: the macroscopic, the microscopic (sub-microscopic), and the symbolic as appropriate to the situation [12]. When considering causes which influenced the science educationists to think about the importance of visualization in science education, spatial ability research can be mentioned as a major one. The spatial ability can be broadly defined as one‟s ability to retain and manipulate visual information which includes abilities such as mentally rotating, inverting, cross-sectioning, transforming visual images/objects, identifying spatial relationships, predictions on spatial orientations, etc. Researchers have recognized the spatial ability as one of the most dominant predictor of success in Science, Technology, Engineering and Mathematics (STEM) subjects (e.g. Shea, Lubinksi and Benbow in 2001, Uttal and Cohen in 2012, Wai, Lubinski and Benbow in 2009) [28], [30], [31]. Physics educationists are also keen on spatial ability research in various physics domains and they also shared the same view (e.g. Pallrand and Seeber, in 1984, Kozhevnikov and Hegarty in 2007,
Lyna and Fulmer in 2014) [20], [13], [15]. It is the common belief of the above mentioned researchers that the students who are good at spatial ability are good at visualizing the concepts in physics. Theories of visual learning can also be considered as an important branch of research which justified the significance of visualization in science education. Piaget‟s pioneering ideas in development psychology which emphasizes how a child‟s spatial cognition develops through the stages of child‟s psychological development [21], [22], dual coding theory [19], [26] which casts some insight on how linguistic information and visual information are encoded by two independent mental systems, and the visual imagery hypothesis [11], [23] which says that the graphical representations help the learner to process information more efficiently than verbal ones do, are some classic examples of such theories of visual learning. The dual coding theory and the visual imagery hypothesis have provided a good theoretical background for many of the computer based visualization tools recently developed. Further, research work carried out in the field of representational competence that is one‟s ability to deal with the external representations [14], use of multiple representations, and models and modeling, in science education can also be considered as areas of study closely linked with visualization in science education. Visualizations in science education cover a wide area including dynamic objects as well as static objects with their inter-relationships. The skills of spatially visualizing these relationships between the objects and how the quantifiable physical properties (e.g. distance, speed, acceleration) change inter-dependently are also linked with visualization. Sometimes, formulae also help to do the visualization to such an extent that they by themselves can be treated as a kind of visualization tool. Because of this broad variety in visualization even in a particular lesson topic and, of lesson specific nature of visualization, finding a common framework for incorporating the visual-perceptual aspect in to classroom teaching and for assessing students‟ attainment in visualizing the necessary areas in physics, is difficult and therefore, the use of multiple representations as appropriate is preferred. Beside the complex nature of the field of visualization, use of the multiple external representations to elaborate the visualization aspect of physics subject matter can be considered as a better way to help students to visualize scientific concepts.
3. Methodology
3.1 Experimental Design
3.2 Sample of Students Selected for Evaluating the Effectiveness of Using the Sim
The sample of students were selected from two equally and averagely performing government schools in Colombo district (selecting averagely performed schools brings more external validity for this experimental study). In each school, the participating students were randomly grouped in the experimental group and the control group. The final experimental group and the control group comprised of the students in both the schools and no school-wise or gender-wise comparison was of interest. Distribution of the students between the experimental group and the control group is given in Table1.
Table 1: Composition of the Sample
Name of school
Participated number of students Experimental
group
Control group
WP/Pili/Buddhist Girls‟ College
(BGC), Mount
Lavinia
20 21
WP/Pili/ Colombo South Science College
(SC), Mount
Lavinia (Boys‟ school)
16 15
Total 36 36
The validity of an experiment which is linked with the experimental design is an important attribute [27]. The validity is two-fold: the external validity and the internal validity. The external validity is the extent, to which the results of the experiment can be generalized to other settings. The internal validity is the degree of confidence in the causal effects, that is, use of a particular treatment for the experimental group would alone cause for the expected result. The experiment can be considered as having a higher level of external validity because the sample of the students were from averagely performed two schools, and all the government schools follow a common curriculum, all the teachers have the minimum equivalent qualifications and the teachers were given the same in-service training. Several measures were taken to ensure the internal validity of this experiment. The experimental teaching was done after the school hours and therefore, the students who gave their consent to stay after the school hours were participated in the study. The students were given no incentive for the participation in the study and the experimental teaching was done as an extended teaching conducted by two science teachers in a school (one teacher for the experimental group and another for control group). Further the students were randomly assigned for the two groups and given no incentive for the participation in the study. Therefore, it can be ensured that the experiment has the internal validity to a higher level [27].
3.3 The Experimental Teaching and the Lesson Topic
Each of the four groups was taught by a science teacher in the respective school for this experimental study. The participating science teachers were briefed on the
experimental approach. Four teachers participated in the study. The participating students (grade 11 during the time of the experiment, March 2017) have covered the experimental lesson topic, „turning effect of force‟ when they were in grade 10 during the year 2016. The time allocated to the lesson is 5 periods as per the syllabus (http://nie.lk/pdffiles/tg/e10tim110.pdf ) (1 period is 40 minutes). Both the groups (experimental and control groups of the two schools) were taught the lesson again for the purpose of this study taking a time of 5 periods after the school hours (one after-school session per week of 1 period duration conducted through five weeks). For both the groups the lesson was planned according to the instructions in the grade 10 science teacher‟s guide [17] covering all the practical activities. For the experimental group, the sim was used as a whole class interactive demonstration (using a multimedia projector) to elaborate the visualization aspect at relevant places keeping the flow of the lesson not distorted. Use of the sim is an additional activity merely done for reinforcing the usual classroom teaching and it is not for replacing any of the usual practices in classroom teaching. All the students and teachers voluntarily participated in the study.
3.4 Notable Visualization Related Areas and the Appropriate Use of ‘Balancing Act’ Simulation Tool
After going through the grade 10 science syllabus [17] and the grade 10 science textbook [18], and after conducting some discussions with a group of subject experts and the participating teachers, two notable visualization related areas were identified in the lesson „turning effect of force‟ , namely,
a). Visualizing the factors affecting the moment of a force
As per the grade 10 science syllabus, the moment of a force around a point is calculated as the product of the magnitude of the force (F) and the shortest (perpendicular) distance to the line of action of the force from the point around which the moment is calculated (d). F and d are the two factors affecting the moment of a force. The student has to decide whether the moment is clockwise or anti-clockwise
b). Visualizing the principle of moments
The principle of moment says that clockwise moments are equal to anti-clockwise moments if the system is in force equilibrium.
The above mentioned areas have been identified as visualization related areas which the student has to be familiar with in general and how they can be elaborated using the sim is going to be discussed here. The two areas need not be separately addressed and when the students are taken through the sim, they will grasp them together. Under the grade 10 science syllabus, turning effects of force involves basically the introduction of the concept of moment of forces and application of principle of moments for simple systems. Understanding the principle of moments needs the visualization of turning effect caused by the forces and determining how the forces cause to lose the equilibrium state of an object such as a door fitted on hinges or a ruler pivoted across its mass centre (centre of gravity). As an effort of helping the students to visualize the application of principle of moments, an interactive PhET simulation called
https://phet.colorado.edu/sims/html/balancing-act/latest/balancing-act_en.html was used. The simulation consists of three modules „Intro‟ (the word, „introductory‟ shortened), Balance Lab‟, and „Game‟ where it takes the student from simple tasks to little bit complicated tasks. Figure 1 shows a screen from „Intro‟.
Figure 1 Balancing the weights on the seesaw
(Source:
https://phet.colorado.edu/sims/html/balancing-act/latest/balancing-act_en.html)
In Figure 1, the student can move the weight here and there on the seesaw and by removing the two side supporters it can be seen whether the seesaw is balanced or unbalanced. By repeating the same task using different weights, the student can derive the principle of moments, that is, total clockwise moments is equal to the total anti-clockwise moment if the system is at the force equilibrium. In „Balance Lab‟, the student can experience the same thing by using more than two masses. „Game‟ module presents some interesting problem solving tasks. Figure 2 shows an example from the „Game‟ module.
Figure 2 What will happen if the two supporters are
removed?
(Source:
https://phet.colorado.edu/sims/html/balancing-act/latest/balancing-act_en.html)
In Figure 2, the student has to select the correct diagram from the three diagrams shown on top of the screen, indicating what will happen to the seesaw when the two side supporters are removed. While the lessons were conducted the students were asked to numerically work out the calculation of moments. This is a foundation for moving from the visual mode to the symbolic mode where the student himself can arrive at the algebraic equation for the principle of moments. Figure 3 shows another sum in the „Game‟ module.
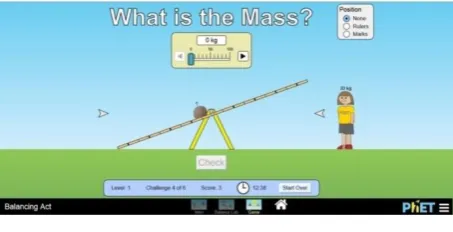
Figure 3 Finding the mass of the stone
(Source:
https://phet.colorado.edu/sims/html/balancing-act/latest/balancing-act_en.html)
In Figure 3, the student has to find the weight of the stone, by dragging the child on the right hand arm of the seesaw until the seesaw becomes balanced. In solving this sum the student can arbitrary place the child somewhere on the right hand arm of the seesaw as shown in Figure 4.
Figure 4 Placing the child arbitrary
(Source:
https://phet.colorado.edu/sims/html/balancing-act/latest/balancing-act_en.html)
Then the student has to determine, to which direction the child should be moved in order to balance the seesaw. In this exercise, comprehending the situation by visualizing the principle of moments is obvious. This simulation naturally forces the student to do that. Once the seesaw is balanced, the mass of the stone has to be indicated by dragging the indicator at the top middle of the screen (Figure 4). Now the student can easily build an equation to calculate the unknown quantity, the mass of the stone m as,
( ) ( )
where d1 and d2 are the distances from the centre of seesaw to the two weights (can be read from the scale of the seesaw), g is the gravitational acceleration (g cancels off from both the sides), then the unknown quantity can be found.
3.5 The Questions to Assess the Students’ Attainment of Visualization
10 science syllabus, teacher‟s guide (NIE, 2015) and the grade 10 science textbook (EPD, 2015) were validated with a group of subject experts and the participating science teachers (content validity of the questions). This question paper is supposed to be answered within 15 minutes time. This question paper is referred to as Visualization Related Test (VRT) in this study. Four of the sample questions in VRT are given below.
Question 4
The diagram shows a balance being used to find the weight of a baby. The weight of the basket can be ignored. At the equilibrium position shown in the diagram, GA distance is greater than GB distance. The beam is uniform and it is pivoted from its centre of gravity, G.
Which of the following statements is correct regarding the weight of the baby?
The weight of the baby is less than 40 N The weight of the baby is 40 N
The weight of the baby is more than 40 N
It is impossible to tell the weight of the baby without a scale on the beam
Source: Adapted from Cambridge International General
Certificate of Secondary Education specimen paper 0625/1-for examinations from 2016, Q8
Question 6
A uniform metre ruler, which weighs 1.5 N, is pivoted on a horizontal nail through a hole at the 30 cm mark. A 2.0 N weight is hung from the 15 cm mark.
What is the resultant moment about the pivot?
Magnitude Clockwise/Anti-clockwise
(a) 0 -
b) 0.60 N m Anti-clockwise
(c) 0.70 N m Clockwise
(d) 1.05 N m Anti-clockwise
Source: Adapted from the book, ‘O Level Physics MCQ Hot
Spots 1000 Frequently Examined Questions, Red Spot Publications’ by C.S. Lim in 2015 (Question 20 on page 53)
Question 7
The diagram shows a cross sectional view of a metre rule pivoted off-centre but kept in equilibrium by a suspended mass of 240 g.
The centre of mass of the rule is at the 50 cm mark. What is the mass of the rule?
12 g (b) 24 g (c) 45 g (d) 120 g
Source: Adapted from the book, ‘O Level Physics MCQ Hot
Spots 1000 Frequently Examined Questions, Red Spot Publications’ by C.S. Lim in 2015, (Question 9 on page 50)
Question 10
The diagram shows a beam on a pivot. Four forces act on the beam. Each force is 20 N. Which force will have the greatest turning effect about the pivot? (cross-sectional view of beam is shown in the diagram).
A (b) B (c) C (d) D
Source: Adapted from IGCSE Physics course Book, General
Physics MCQs in the CD-ROM, Cambridge University Press by David Sang in 2011 (Question 7)
The question 4 requires visualizing the state of equilibrium in term of the principle of moments. The question 6 involves visualizing the net effect of the clockwise and anti-clockwise moments by forming an image of the whole diagram. In the question 7, the student has to visualize the effect of equilibrium of the system in terms of principle of moments. The question 10 involves the assessing the student‟s ability to visually compare the turning effects of different forces.
3.6 Methods of Statistical Analysis
For testing the reliability of the VRT, Cronbach‟s alpha value was calculated. Descriptive statistics - mean and standard deviation - have been calculated where necessary. Group comparison tests were used to compare the treatment effects.
4 Results and Discussion
Table 2 The mean scores for VRT
Group
Pre-test Post-test Percentage
Increase of Mean Score Mean Score Standard Deviation Mean Score Standard Deviation
Experimental 25% 16% 52% 8% 27%
Control 24% 17% 26% 17% 2%
Question Number
Percentage of Students
Correctly Answered Percentage Increase
p-value from McNemar Test Pre-test Post-test
1 27% 27% 0% -
2 17% 17% 0% -
3 60% 64% 4% 0.002
4 27% 27% 0% -
5 37% 38% 1% 0.157*
6 30% 32% 2% 0.014
7 11% 16% 5% 0.000
8 10% 16% 6% 0.000
9 14% 14% 0% -
10 3% 5% 2% 0.025
Table 2 shows a gain of about 27% in the post-test performance in the experimental group compared to the pre-test whereas that in the control group is only around 2%. This shows that the teaching intervention using the sim can be considered as effective. Further, it shows quite high standard deviations on students‟ VRT scores. Also in the experimental group the standard deviation has come down from 16% to 8%. Then the students‟ performance for the individual questions at the pre-test and post-test were compared using a group comparison test (related group). As the variables are dichotomous, McNemar test was used. Table 3 shows the students‟ performance at the pre-test and the post-test for the experimental group.
Table 3 VRT Administration for Experimental Group
Question Number
Percentage of Students
Who Correctly Answered Percentage Increase
p-value from McNemar Test Pre-test Post-test
1 20% 48% 28% 0.000
2 13% 44% 31% 0.000
3 64% 71% 7% 0.000
4 37% 59% 22% 0.000
5 28% 58% 30% 0.000
6 25% 51% 27% 0.000
7 19% 48% 29% 0.000
8 4% 46% 42% 0.000
9 16% 46% 30% 0.000
10 20% 47% 26% 0.000
In Table 3, all the p-values are less than 0.05. Therefore, the increases in the post-test performances are significant. The question 3 can be considered as an easy one for the students where 64% of the students have correctly answered the question. At the post-test, students‟ performance for that questions increased only by 7%. In other questions, there is over 20% increase in students‟ post-test performance compared to the pre-test. Figure 1 shows the information given in Table 3 in graphical form.
Figure 1 Question-wise performance for VRT at pre-test and
post-test in experimental group
Similarly, the students‟ performance for VRT in the control group is given in Table 4.
Table 4 VRT Administration for Control Group
Question Number
Percentage of Students
Correctly Answered Percentage
Increase
p-value from McNemar Test Pre-test Post-test
1 27% 27% 0% -
2 17% 17% 0% -
3 60% 64% 4% 0.002
4 27% 27% 0% -
5 37% 38% 1% 0.157*
6 30% 32% 2% 0.014
7 11% 16% 5% 0.000
8 10% 16% 6% 0.000
9 14% 14% 0% -
10 3% 5% 2% 0.025
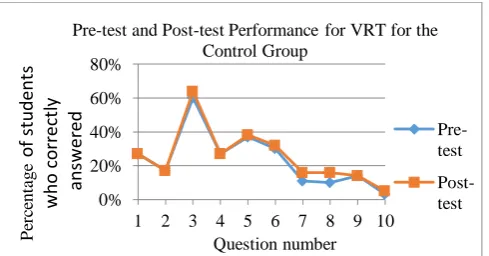
As shown in Table 4, for the questions 1, 2, 4, and 9, there is no increase in the students‟ performance in the post-test compared to the pre-test. Though there is an increase in the performance of question 5 of 1%, it is not significant as the p-value is greater than 0.05 (shown by an asterisk). Though the increases in other questions (3, 6, 7, 8, and 10) are statistically significant (as the p-values are less than 0.05), the percentage increase is very low when compared with that with the experimental group. Therefore, it can be said that the teaching done in usual way has not helped much in improving the students‟ attainment of visualizing. The same information are shown graphically in Figure 2.
Figure 2 Question-wise Performance for VRT at Pre-test
and Post-test in Control Group
Figure 2 clearly shows that the post performance of control group does not show remarkable improvements. Further the classroom observations, and discussions and unstructured
0% 20% 40% 60% 80%
1 2 3 4 5 6 7 8 9 10
P er ce nt age o f stu de nt s w ho c o rr ec tl y a ns we re d Question number
Pre-test and Post-Test Peformance for VRT in Experimental Group Pre-test Post-test 0% 20% 40% 60% 80%
1 2 3 4 5 6 7 8 9 10
Pe rc en tag e o f st u d en ts w h o c o rr ect ly an sw er ed Question number
Pre-test and Post-test Performance for VRT for the Control Group
Pre-test
interviews with students (of the experimental group) showed that they had an interesting learning experience using the sim. Most of them liked the „Game‟ module of the sim.
5 Conclusion
This experimental study is an attempt of emphasizing the visualization aspect of the secondary school physics lessons, „Turning Effect of Force‟ basically utilizing visual-mode of external representations. Accordingly an interactive simulation („Balancing Act‟) which is a computer aided learning material was used along with the traditional teaching methods currently in use to highlight the visualization aspect of the lesson. The net improvement of 25% achieved by the experimental group students in the post-test administration of the assessment compared to the pre-test, over the control group showed show the capability of the new approach as a way of helping students to visualize the necessary content in the lesson „Turning Effect of Force‟. The approach introduced in this study only supplemented the usual teaching. What has been explained in the text is reinforced by the simulation and the vice-versa, helping the students‟ better understanding. The textbook explanation of the door hinged on to a side of a frame at two or three places though given a classic example for feeling the moment (Figure 3 and Figure 4) is lacking in support for understanding, the definition of moment, that is, moment = force x distance.
Figure 4 Door and moment
(Source: Grade 10 Science Textbook published by Education
Publication Department of Sri Lanka in 2015, page 190)
Figure 5 Push on a door and moment
(Source: Physics for you by Keith Johnson published by
Nelson Thrones Ltd, UK in 2001, page 100)
Mass of the door can interfere with students‟ logical thinking process, at least for few serious students. The teacher when using this visual aid as a similie should take enough care and
make some careful assumptions in giving a reasonable explanation as noted below.
(i). the door is made of some material of uniform density and its centre of gravity works in a perfect vertical line facing down (since this is perfectly vertical it is parallel to the turning axis causing no moment around that axis) (Figure 3)
(ii).big man‟s and small one‟s pushes are on the same horizontal level (Figure 4).
When the PhET simulation‟s „Balancing Act‟ tool is brought in here the problem can be solved conveniently and the validity of the definition also becomes clearer. Further the problem solving abilities of the students relating to the moment can be better catered in using the simulation tool. However, if three dimensionality can be incorporated into the diagrams of the simulation, visualization aspect it presents can be considerably enhanced. This discussion brings out another important fact for the teacher to take into note of - there can be more than one visualization objects, that is to say, multiple representations are possible for same phenomenon, but none of them can depict the true nature of its function. Each representation is only an abstraction which can fulfill some desired aspect of the phenomenon and hence the usefulness of multiple representations.
References
[1]. Department of Examinations of Sri Lanka, Evaluation Report, G.C.E. (O/L) Examination: 34-Science. Department of Examinations, Battaramulla, Sri Lanka, 2009.
[2]. Department of Examinations of Sri Lanka, Evaluation Report, G.C.E. (O/L) Examination: 34-Science. Department of Examinations, Battaramulla, Sri Lanka, 2010.
[3]. Department of Examinations of Sri Lanka, Evaluation Report, G.C.E. (O/L) Examination: 34-Science. Department of Examinations, Battaramulla, Sri Lanka, 2011.
[4]. Department of Examinations of Sri Lanka, Evaluation Report, G.C.E. (O/L) Examination: 34-Science. Department of Examinations, Battaramulla, Sri Lanka, 2012.
[5]. Department of Examinations of Sri Lanka, Evaluation Report, G.C.E. (O/L) Examination: 34-Science. Department of Examinations, Battaramulla, Sri Lanka, 2013.
[6]. Department of Examinations of Sri Lanka, Evaluation Report, G.C.E. (O/L) Examination: 34-Science. Department of Examinations, Battaramulla, Sri Lanka, 2014.
[8]. Educational Publications Department of Sri Lanka, Grade10 Science Textbook, Educational Publications Department, Battaramulla, Sri Lanka, 2015
[9]. J.K. Gilbert, “Visualization: A Meta-cognitive Skill in Science and Science Education”, in Visualization in Science Education, J. K. Gilbert (ed), Dordrecht, Netherlands: Springer, pp. 9-27, 2005.
[10].J.K. Gilbert, “The role of visual representations in the learning and teaching of science: An introduction”, In Proceedings of Asia-Pacific Forum on Science Learning and Teaching, Foreword, 2010.
[11].P. N. Johnson-Laird, “Imagery, Visualization, and Thinking”, in Perception and Cognition at Century‟s End, J. Hochberg (ed), San Diego: Academic Press, 1998.
[12].A. H. Johnstone, “The Development of Chemistry Teaching A Changing Response to Changing Demand”, Journal of Chemical Education, 70 (9), pp. 701-705, 1993.
[13].M. Kozhevnikov, M.A. Motes and M. Hegarty, “Spatial Visualization in physics problem solving”, Cognitive Science, 31, pp. 549-579, 2007.
[14].R.Kozma and J. Russell, “Students becoming chemists: Developing representational competence”, in Visualization in Science Education, J. K. Gilbert (ed), Dordrecht: Springer, pp. 121–145, 2005.
[15].Lyna and G.W. Fulmer, “Secondary students‟ visual-spatial ability predicts performance on the Visual-Spatial Electricity and Electromagnetism Test (VSEEMT)”, Science Education Review Letters, 2014, pp. 8-21, available at http://edoc.hu-berlin.de/serl, 2014
[16].J. McKendree, C. Small, K. Stenning, and T. Conlon, “The role of representation in teaching and learning critical thinking”, Educational Review, 54(1), pp. 57-67, 2002.
[17].National Institute of Education of Sri Lanka, Grade 10 science teacher‟s guide, Educational Publications Department, Battaramulla, Sri Lanka, 2015.
[18].Educational Publications Department of Sri Lanka, Grade 11 science textbook, Educational Publications Department, Battaramulla, Sri Lanka, 2016
[19].A. Paivio, Mental Representations: A Dual Coding Approach, Oxford, 1986.
[20].G. J. Pallrand and F. Seeber, “Spatial ability and achievement in introductory physics”, Journal of Research in Science Teaching, 21(5), pp. 507-516, 1984.
[21].J. Piaget and B. Inhelder, The child's concept of space, Routledge and Paul, 1956.
[22].J. Piaget and B. Inhelder, The Child's conception of space, W. W. Norton and Company, Inc: New York, 1967.
[23].Z. W. Pylyshyn, Seeing and Visualizing: It‟s Not What You Think. Cambridge, Mass: MIT Press, 2003
[24].D. N. Rapp and C. A. Kurby, “The „ins‟ and „outs‟ of learning: Internal representations and external visualizations”, in Visualization: Theory and Practice in Science Education, J. Gilbert, M. Reiner and M. Nakhleh (eds), third edition, Springer Netherlands, pp. 29-52, 2008.
[25].M. Reiner, “Seeing through touch: The role of haptic information in visualization”, in Visualization: Theory and Practice in Science Education, J. Gilbert, M. Reiner and M. Nakhleh (eds), third edition, Springer Netherlands, pp. 73-84, 2008.
[26].M. Sadoski and A. Paivio, Imagery and Text: A Dual Coding Theory of Reading and Writing. Mahwah, NJ: Erlbaum, 2001.
[27].U. Sekaran and R. Bougie, Research Methods for Business – A Skill Building Approach, sixth edition, John Wiley & Sons Inc, U.K., 2013.
[28].D. L. Shea, D. Lubinksi and C. P. Benbow, “Importance of assessing spatial ability in intellectually talented young adolescents: A 20-year longitudinal study”, Journal of Educational Psychology, 93, pp. 604-614, 2001, doi:10.1037//0022-0663.93.3.604.
[29].C. R. Shu-Nu and B. J. Yao, “Visualization in research and science teachers‟ professional development”, Asia-Pacific Forum on Science Learning and Teaching, Volume 15, Hong Kong Institute of Education, 2014.
[30].D. H. Uttal and C. A. Cohen, “Spatial thinking and STEM education: When, why, and how?”, Psychology of Learning and Motivation, 57, pp. 147-181, 2012, doi: 10.1016/B978-0-12-394293-7.00004-2.
[31].J. Wai, D. Lubinski and C. P. Benbow, “Spatial ability for STEM domains: Aligning over 50 years of cumulative psychological knowledge solidifies its importance”, Journal of Educational Psychology, 101(4), 817, 2009.