ORIGINAL ARTICLE
TOOTH WEAR PREVALENCE AND SAMPLE SIZE
DETERMINATION : A PILOT STUDY
Nama Bibi Saerah Abd. Karim, Noorliza Mastura Ismail*, Lin Naing*, Abdul Rashid Ismail* Department of Community Medicine, School of Medical Sciences,
*School of Dental Sciences, Universiti Sains Malaysia, Health Campus 16150 Kubang Kerian, Kelantan, Malaysia
Tooth wear is the non-carious loss of tooth tissue, which results from three processes namely attrition, erosion and abrasion. These can occur in isolation or simultaneously. Very mild tooth wear is a physiological effect of aging. This study aims to estimate the prevalence of tooth wear among 16-year old Malay school children and determine a feasible sample size for further study. Fifty-five subjects were examined clinically, followed by the completion of self-administered questionnaires. Questionnaires consisted of socio-demographic and associated variables for tooth wear obtained from the literature. The Smith and Knight tooth wear index was used to chart tooth wear. Other oral findings were recorded using the WHO criteria. A software programme was used to determine pathological tooth wear. About equal ratio of male to female were involved. It was found that 18.2% of subjects have no tooth wear, 63.6% had very mild tooth wear, 10.9% mild tooth wear, 5.5% moderate tooth wear and 1.8 % severe tooth wear. In conclusion 18.2% of subjects were deemed to have pathological tooth wear (mild, moderate & severe). Exploration with all associated variables gave a sample size ranging from 560 – 1715. The final sample size for further study greatly depends on available time and resources.
Key words : pilot study, tooth wear, prevalence and sample size determination
Introduction
Well-designed studies are vital to provide important information for the efficient planning,
operation, monitoring and evaluation of health services. To obtain statistically valid results, the decision on how large a sample to be selected from the population is important to avoid unnecessary Submitted: 30 July 2006, Accepted: 16 October 2008
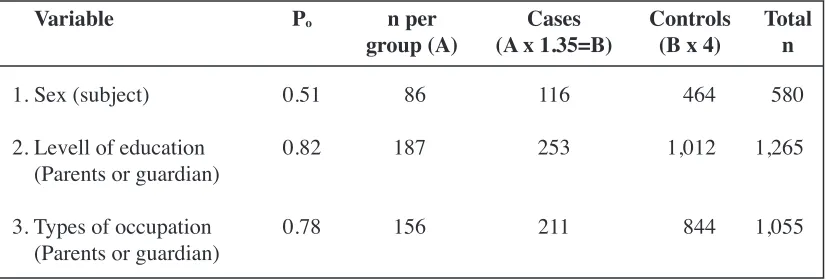
Table 1: Sample size calculation using socio-demographic variables
Variable Po n per
group (A) (A x 1.35=B)Cases Controls(B x 4) Totaln
1. Sex (subject)
2. Levell of education (Parents or guardian) 3. Types of occupation (Parents or guardian)
0.51
0.82
0.78
86
187
156
116
253
211
464
1,012
844
580
1,265
expenditure of time and resources. The size of sample required depends on the objectives and outcome of the study (1, 2). Before sample size can be calculated some information must be gathered from the literature. In some instances, available information cannot be used due to certain variations in the population. To overcome this problem, a small-scale study, termed as a ‘pilot study’ is necessary prior to the true study to estimate variability in outcomes and help determine the sample size (3).
The prevalence, intra-oral distribution and etiology of tooth wear in European communities have been an area of investigation in the past decade (4, 5). However, there are not many studies available in Malaysia to clearly establish the prevalence and etiology of tooth wear. Presently there is one published data from Sabah, which revealed a prevalence of 95% moderate and 41% severe tooth wear in age the group of 14 - 77 yrs (6).
Tooth wear, which in part is preventable; bring about discomfort especially during eating hot, cold, sweet and sour foods. If left untreated it can lead to tooth morbidity and mortality. In developed countries the prevalence of tooth wear is on the rise, which could be due to changes in dietary patterns (7, 8). In a developing country like Malaysia, there has been a rapid increase in the proportion of people living in urban areas and many households rely on ready market food such as fruit juices and soft drinks (9). With obvious changes in dietary patterns, it is useful to identify tooth wear problem in the local scenario.
The author is interested to observe the prevalence of tooth wear and associated factors among 16-year-old school children in Kota Bharu Town, Kelantan. Information gathered from the literature was not suitable for comparison due to varying age groups and very different dietary patterns. Therefore a pilot study was suggested by
experts to obtain information for the estimation of prevalence and sample size.
Materials and Methods
This pilot study involved 55 randomly selected sixteen-year-old school children from ‘Sekolah Menengah Kebangsaan, Kubang Kerian 2, Kota Bharu, Kelantan’. All children gave consent prior to the study.
A self-administered questionnaire was designed based on the literature and expert opinions. Each child was given 2 parts of the self-administered questionnaire consisting of socio-demographic background of the family was completed by the children at home. They were permitted to make enquiries from parents or guardian if in doubt.
The second part of the questionnaire was completed by the children in the school and collected at the end of the session prior to clinical examination. This questionnaire consisted of items regarding other variables associated with the study outcome and food and drinks frequency record, which was adapted from Food Intake Survey of Malaysia (Kajian Pengambilan Makanan Malaysia 2002/2003). Most questions required a ‘yes’ or ‘no’ response.
The oral examination was carried out in the dental mobile bus using disposable plane mouth mirrors, dental probes to remove food debris and periodontal probes to measure pocket depth at cervical regions of teeth under good operating light. The child was seated on the dental chair with the operator behind and the recorder seated in front of the child. Charting of tooth wear and other oral findings were done using Smith and Knight Tooth Wear Index 1984 (TWI) and WHO criteria respectively. The Tooth wear index was designed to record levels of tooth wear regardless of the cause. Each visible tooth surface (buccal, lingual, occlusal
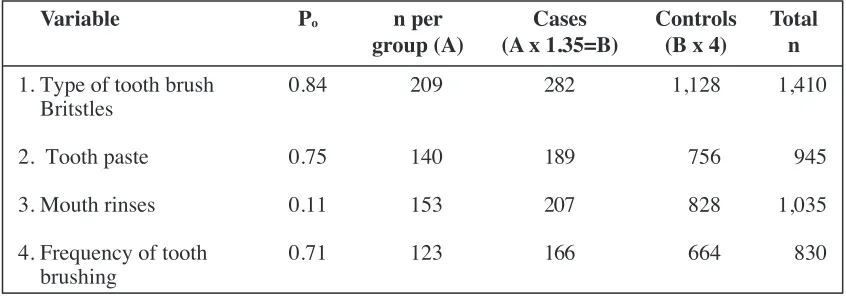
Table 2 : Sample size calculation using oral hygiene practice variables
Variable Po n per
group (A) (A x 1.35=B)Cases Controls(B x 4) Totaln
1. Type of tooth brush Britstles
2. Tooth paste 3. Mouth rinses 4. Frequency of tooth
0.84
0.75 0.11 0.71
209
140 153 123
282
189 207 166
1,128
756 828 664
1,410
or incisal and cervical) was observed. Scores from 0 to 4 were given according to the severity of wear (10, 11). The raw data of tooth wear scores were then entered into a Microsoft Excel programme to determine pathological tooth wear. The SPSS version 11.5 was used for data management.
Sample size was then calculated based on the objectives of the true study. The first objective aimed to determine prevalence of tooth wear. The second objective aimed to compare pathological tooth wear between cases and controls. Cases were subjects with pathological tooth wear and controls were subjects with no pathological tooth wear. Sample size for the prevalence of raw and pathological tooth wear was calculated using the single proportion formula. The sample size for the case-control study was calculated using PS software (12).
Method of sample size calculation for prevalence of tooth wear:
a. Raw tooth wear
Calculation was done based on single proportion formula:
n = [Z ·/2 /ƒ]2 p (1-p)
b. Pathological tooth wear
Calculation was done based on single
proportion formula:
n = [Z · /2 /ƒ]2 p (1-p)
Where n = the sample size required, Z _/2
=95% confidence interval with a significant level
for _ set at 0.05, ƒ = the precision determined by expert and p = prevalence of outcome.
The PS software was used to calculate of sample size for the case-control study. Variables used for sample size calculation were sociodemographic variables, oral hygiene practice variables, food frequency record variables and other associated variables. In the PS software, _ (alpha) is the level of significance set at 0.05, ß was set at 0.2 and power of study (1- ß) was 0.8, _, the Odd ratio set at 2, M the ratio between prevalence of pathological tooth wear and no pathological tooth wear which was equal to 4, and P0, the proportion of children being exposed in control group.
The PS software provided the sample size for one group. Thirty-five percent was added to the size of the sample to cater for 20% non-response and 15% inflated, as subjects need to be examined first before they can be excluded from the study. Subjects with fixed orthodontic appliances and those who have less than twelve teeth to be scored were excluded (13).
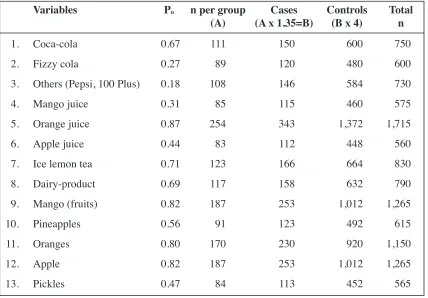
Table 3 : Sample size calculated using food and drink variables
Variables Po n per group
(A) (A x 1.35=B)Cases Controls(B x 4) Totaln
Coca-cola Fizzy cola
Others (Pepsi, 100 Plus) Mango juice
Results
All children were Malays with about equal male to female ratio. Raw tooth wear results revealed a prevalence of 63.6 % very mild tooth wear (score 1), 10.9 % mild (score 2) and 5.5% moderate (score 3) and 1.8 % severe (score 4). The prevalence of pathological tooth wear (mild, moderate and severe) was 18.2%. Therefore the sample size calculated for the first objective of raw and pathological tooth wear was 284. For the second objective, when sample size was calculated using socio-demographic variables (Table 1), the level of parent or guardian education revealed the biggest sample size of 1,265 children. The ethnic group and income variables were not considered because all children were Malays and the latter was a numerical variable, which will reveal a smaller sample size. When sex was considered comparing male to female, the smallest sample size of 580 was obtained.
As shown in Table 2, oral hygiene practice variables were also used to determine the sample size. The type of tooth brush bristles, comparing medium and soft revealed the biggest sample size of 1,410 subjects, followed by mouth rinse use (n=1035), tooth paste use comparing Darlie and Colgate (n=945) and frequency of tooth brushing comparing twice and once per day (n=830).
When food and drink variables were considered (Table 3), orange juice intake revealed the biggest sample size (n=1,715) followed by mango and apple juice with similar sample size (n=1,265) and the remaining variables gave sample sizes between 565 to 1,150. The smallest sample size was obtained when apple juice intake was considered (n=560).
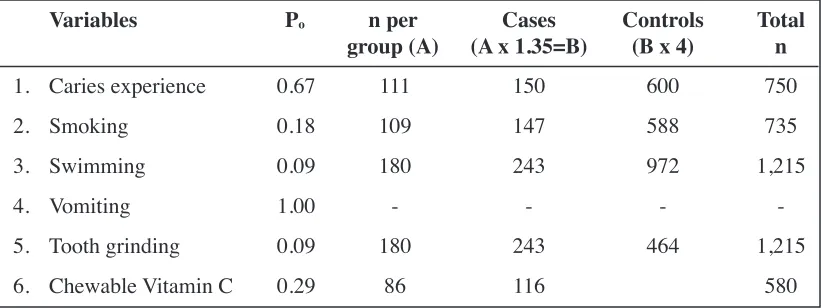
Table 4 illustrates the sample size obtained when other associated variables for developing tooth wear were calculated. Swimming in chlorinated
pools and tooth grinding revealed the biggest sample size of n=1,215 and the intake of chewable vitamin C tablets revealed the smallest sample (n=580).
Discussion
The continuous use of teeth causes some degree of wear. Tooth wear is an irreversible process. Some researchers estimated that the wear of natural teeth due to mastication is a little more than the thickness of human hair per year (14).
The Smith and Knight tooth wear index (TWI, 1984) was one of the earliest indices available for use in epidemiological studies (10). Since then some modifications have been made by several researchers to obtain a simpler version of the index (11). Various studies have revealed the prevalence of raw tooth wear in many different ways (5,6,15, 16). A few studies revealed the findings of pathological tooth wear (17, 18). Although tooth wear occurs in combination, the effect of erosion is more dominant (11,19,20). The etiology of erosion is multifactorial, which involves host factors (saliva), tooth (acid resistant), time, diet, lifestyle, medication and environment (8, 21, 22). A few studies have explored the relationship between saliva and tooth wear (23, 24, 25). Saliva variables such as hydration, viscosity, pH, flow rate and buffering capacity was not explored in this pilot study due to budget and time constraints. Furthermore all saliva variables except viscosity of saliva are numerical variables, which will eventually reveal smaller sample sizes.
Many studies (15,18,26,27,28) have established the association between diet and tooth wear, especially erosion. Food frequency questionnaires were used for this purpose to determine the consumption and frequency of consumption such as daily or weekly.
Socio-economic status can influence
Table 4 : Sample size calculated using other associated variables
Variables Po n per
group (A) (A x 1.35=B)Cases Controls(B x 4) Totaln
Caries experience Smoking
Swimming Vomiting Tooth grinding Chewable Vitamin C 1.
2. 3. 4. 5. 6.
0.67 0.18 0.09 1.00 0.09 0.29
111 109 180 -180
86
150 147 243 -243 116
600 588 972 -464
750 735 1,215
-1,215
behavior. Several studies have attempted to evaluate the relationship between socioeconomic status (SES) and tooth wear (18, 23) in children. Al-Dlaigan et al. (25) found that 61% of children from the lowest SES group had erosion compared to 31% in the highest SES group.
Dental erosion is associated with people who have a very high standard of oral hygiene (8). Oral hygiene practices like brushing teeth last at night, technique of tooth brushing, type of toothbrush used and frequency of brushing were found to have an association with erosion (29).
Other associated factors explored in previous studies such as the effect of taking chewable Vitamin C tablets (23), clenching and grinding habits (15,29) and swimming in chlorinated pools were also explored in this pilot study.
After exploration of all possible variables, it was found that intake of oranges yielded the biggest sample size (n=1,715) and the intake of apple juice gave the smallest sample size (n=560). The final selection of sample size for further study depends largely on available time and resources.
Conclusion
The overall prevalence of raw tooth wear among 16-year-old school children was 81.8% and prevalence of pathological tooth wear was 18.2%. The sample size for further study may vary in the range of 560 - 1,715 depending on available time and resources.
Acknowledgements
The authors would like to thank the Head of Department of the School of Medical Sciences and the Dean of the School of Dental Sciences, Universiti Sains Malaysia for their encouragement and support. The authors also would like to express their sincere gratitude to the Headmaster, Health Teachers and students from Sekolah Menengah Kebangsaan Kubang Kerian 2, Kelantan who has been very cooperative during the conduct of the study.
Corresponding Author :
Dr. Nama Bibi Saerah bt. Abd. Karim DBS(Malaya), MCM(USM)
Klinik Pergigian Gerik, Jalan Intan, 33300, Gerik, Perak Malaysia
Email : [email protected], drsaerah@
References
1. Russell VL. Some Practical Guidelines for Effective Sample Size Determination. Department of Statistics, University of Iowa. 2001.
2. Whitley E. and Ball J. Statistics review 4: Sample size calculations. Critical Care 2002 6:335-41.
3. Edwin RT and Hundley V. The importance of pilot studies. Soc res update 2001 35.
4. Jarvinen V, Rytomaa I and Heinonen OP Risk factors of dental erosion. J Dent Res 1991 70(6): 942-947 5. Milosevic A, Young PJ and Lennon MA. The
prevalence of tooth wear in 14-year-old school children in Liverpool. Community Dent Hlth 1994 11(2):83-86 6. Milosevic A and Lo MS. Tooth wear in three ethnic groups in Sabah (Northern Borneo). Int Dent J 1996
46: 572-78
7. Kelleher M and Bishop A. Tooth surface loss: an overview. Br Dent J 1999 186: 61-66
8. Shaw L and Smith, AJ. Dental erosion-the problem and some practical solutions. Br Dent J 1998 186: 115-8.
9. Report of a WHO Study group, WHO, Geneva. Diet, nutrition and the prevention of chronic diseases. Publication of WHO, Geneva Switzealand 1990. 10. Smith BG and Knight JK. Tooth wear index manual.
1984
11. Smith, BG, Knight JK and Robb ND. The Tooth Wear Index: An Introduction and Manual. 2nd edition. 1984.
12. Dupont, WD and Plummer J. Power and Sample Size Calculations for Studies Version 5.0 Tennessee, USA.1998.
13. Smith BG and Robb ND. The prevalence of tooth wear in 1007 dental patient. J Oral Rehab 1996; 23: 232-39.
14. Gordon JC. A Consumer’s guide to Dentistry, 2nd ed.
St Louis: Mosby; 2002.
15. Milosevic A, Bardsley PF and Taylor S. Tooth wear and dental erosion and their relationship with diet and habit. Br Dent J 2004 197: 479-83.
16. Al-Dlaigan, YH, Shaw L and Smith A. Dental erosion in a group of British 14-year-old school children. Part 1: Prevalence and influence of different socio-economic background. Br Dent J 2001 190: 145-49 17. Smith, BG and Robb ND. The prevalence of tooth wear
in 1007 dental patient. J Oral Rehab. 1996 23: 232-39.
18. Bernard G, Smith N and Bartlett DW. The prevalence, etiology and management of tooth wear in the United Kingdom. J Prosthet Dent 1997 78: 367-72
20. Ibbetson R and Eder A. Tooth surface loss: Editors’ introduction. Br Dent J 1999186: 60.
21. Dugmore CR and Rock WP. Factors and prevalence of tooth erosion in children. Br Dent J 2004 196 :283-86.
22. Patient Assessment - Diagnosis and Management of Dental Erosion. http://www.thejcdp.com/issue001/ gandara/assess.htm. Rettrieval date 10/10/04 23. Murray, JJ. The Prevention of oral diseases. 3rd edition.
Great Britain: Bath Press 1996.
24. Scheutzel, P. Etiology of dental erosion-intrinsic factors. Eur J Oral Sci 1996 104:178-90.
25. Al-Dlaigan YH, Shaw L and Smith A. Dental erosion in a group of British 14-year-old school children. Part II: Influence of dietary intake. Br Dent J 2001 190: 258-61
26. Bartlett DW, Coward PY, Nikkah C and Wilson, RF. The prevalence of tooth wear in a cluster sample of adolescent schoolchildren and its relationship with potential explanatory factors. Br Dent J 1998 184: 125-29.
27. Al-Majed I, Maguire A and Murray JJ. Risk factors for dental erosion in 5-6 year-old and 12-14 year-old boys in Saudi Arabia. Community Dent Oral 2002; 30: 38-46.
28. Mathew T, Casamassimo PS and Hayes JR. Relationship between sports drinks and dental erosion in 304 university athletes in Columbus, Ohio, USA.
Caries Res 2002 36(4): 281-87.
29. Al-Dlaigan YH, Shaw L and Smith A. Dental erosion in a group of British 14-year-old school children. Part III: Influence of oral hygiene practices. Br Dent J 2002