Published online December 08, 2014 (http://www.sciencepublishinggroup.com/j/sr) doi: 10.11648/j.sr.20140206.14
ISSN: 2329-0935 (Print); ISSN: 2329-0927 (Online)
Coag-flocculation kinetics of phosphorus containing
effluent using
Corchorus Olitorious
seed
Akinpelu Kamoru Babayemi
1, *, Okechukwu Dominic Onukwuli
2, Akindele Oyetunde Okewale
31
Department of Chemical Engineering, Anambra State University, Uli, Nigeria 2
Department of Chemical Engineering, Nnamdi Azikiwe University, Awka, Nigeria 3
Department of Chemical Engineering, Federal University of Petroleum Resourses Effurun, Nigeria
Email address:
To cite this article:
Akinpelu Kamoru Babayemi, Okechukwu Dominic Onukwuli, Akindele Oyetunde Okewale. Coag-Flocculation Kinetics of Phosphorus Containing Effluent Using. Corchorus Olitorious Seed. Science Research. Vol. 2, No. 6, 2014, pp. 172-178. doi: 10.11648/j.sr.20140206.14
Abstract:
Corchorus olitorius, (CR) an environmentally friendly biomass was used as a coagulant in this work for the treatment of phosphorus containing effluent using Nephelometric method. The research evaluates the coag-flocculation efficiency of CR coagulant as well as kinetic parameter response of CR to varying pH and dosage of the waste water effluent. Coag-flocculation reaction order α, coag-flocculation rate constant K, and coagulation period were determined. The maximum coag-flocculation performance is recorded at rate constant, K of 5x10⁻⁵ l/mg.mm, dosage of 500mg/l, pH of 6 and coagulation period of 5.4 mins. While the coag-flocculation efficiency obtained E > 70% at the condition of the experiment.Keywords:
Coagulation, Corchorus Olitorius, Kinetics, Phosphorus1. Introduction
Coagulation is the destabilization of colloids by neutralizing the forces that keep them apart. Cationic coagulants provide positive electric charges to reduce the negative charge (Zeta potential) of the colloids. As a result, the particles collide to form larger particles (flocs). Rapid mixing is required to disperse the coagulant throughout the liquid. Care must be taken not to overdose the coagulants as this can cause a complete charge reversal and re-stabilize the colloid complex. Flocculation is the action of polymers to form bridge between the flocs, and bind the particles into large agglomerate or clumps [1]. Many coagulating agents are used in processes for treating water, such as inorganic coagulants (salts of aluminum and iron), synthetic and natural organic polymers [2].Aluminum sulphate is widely used worldwide as a coagulant, but recently its use has been questioned due to evidence that Alzheimer’s disease may be as a result of extensive intake of alum [3, 4].Moreover, aluminum is not biodegradable, and can cause disposal problems and require treatment of the generated sludge [5]. The search for an environmentally friendly and inexpensive coagulant as a viable alternative to conventional coagulants has therefore become an important challenge in the water treatment process. Some of these natural coagulants and
flocculants that have been investigated by other researchers include: chitosan, aqueous extracts of the seed of Moringa Oleifera and extracts of Okra seed [6, 7, 8]. This study proposes the use of Corchorus Olitorius seed as a viable alternative for conventional coagulants in the treatment of industrial waste water.
Corchorus Olitorius called “ayoyo” in Hausa and “ewedu” in Yoruba is a popular green vegetable plant [9]. The vegetable is also known by several names in different countries including Jews mallow or Jute mallow in English, Egyptian spinach, and Bush okra in South Africa [10].
Aqueous extracts of the seeds of Corchorus Olitorius were reported to possess peripheral and central anti-nociceptive, anti-inflammatory and anti-pyretic activities [11]. The seeds are used as a purgative and have been found to contain cardenolide glycosides on preliminary analysis while the methanol extracts of the seeds have been reported to possess a broad spectrum of antibacterial activity [12].
2. Materials and Methods
The turbid effluent was collected from the Federal Superphosphate fertilizer company, Kaduna, Nigeria. A 20-litre polyethylene bottle was thoroughly cleaned and rinsed with effluent sample before the final sample collection, after which the bottle was tightly closed and taken to the laboratory for experimental work.
The sample of the CR seed was sourced from a local market in Ibadan, Oyo State. The shell or covering testa of the seeds was removed and winnowed in order to separate the shell from the cotyledon of the seeds. The cotyledons were then dried at 1000c for 2hrs in a hot air oven. The dried seeds were then ground and processed into a coagulant using standard method. The jar test was conducted based on standard Bench scale Nephelometric method (single angle procedure) for the examination of water and waste water [13,14] using model WZS-185Turbidimeter, Gulen hamp magnetic stirrer and Delta 320 pH meter.
The coagulant and the effluent samples were characterized and the results of their characterization are presented in Table 3.2 and 3.1 respectively.
The percentage of turbidity removal was calculated using equation (1 )
Removal efficiency:
E(%)=(C0-C1)/C0x100 (1)
where C0 and C1 are the initial and residual concentration of
the waste water effluent respectively, mg/l.
2.1. Theoretical Principles
The rate of flocculation is a function of the particles (count) concentration C, and the intensity of Brownian motion characterized by the diffusivity D. Consideration of the particle diffusion flux in a mono dispersed system toward a particle of radius ‘a’ (chosen as the central one) on the basis of Fick’s equation yields an expression for the rate of decrease in the particle number.
α
KC dt
dC =− (2)
Integrating Eq (1) gives
(
)
K Cdt
dC ln ln
ln− = +
α
(3)From which
K
and αcan be determined from a plot of( )
dCdtln against lnC.
In eq. (2), K is coagulation rate constant/collision frequency
α
is the order of coagulation reactionC is the concentration of the particles (TSS),mg/l
It has been shown by some researchers that for the conditions described above [16]
D R
K=8
π
′ (4)Where R′=2a
From Einstein’s equation [15, 17]
( )
TB KD= B (5)
Where B is the friction factor, T is the absolute temperature (0K) and KB is the Boltzman constant (Molar gas
constant per particle).
For the simplest case of a smooth spherical particle of radius ‘a’ immersed in a fluid of viscosity µ, B is given by Stoke’s relation [15]
a
B=6πµ (6)
Putting Eq(6) into Eq(5) gives
µ πa T K D B 6
= (7)
But R′=2a
Therefore R T K R T K
D B B
′ =
′
=2 6πµ 3πµ (8)
Putting Eq(8) into Eq(4) gives
= ′ ′
= π π µ K Tµ
R T K R
K B B
3 8 3
8 (9)
Putting Eq(9) into Eq(2) when α=2 yields
−
= C K Tµ dt
dC 2 B
3
8 (10)
Applying the method of separable variable and integrating Eq (2) within the following limits:
At t = 0, C = Co at t = t, C = C, yields
Kdt dC
dC =
− 2 (11)
Integrating Eq (11) above yields
Kt C
C= 0+
1 1
(12)
Multiply both sides of Eq (12) by Co to give
Kt C C C
0
0 =1+ (13)
Making ‘C’ the subject of the formular, yields
+ = + = K C t C Kt C C C 0 0 0 0 1 1 1 (14) Let τ = K C0
Therefore Eq(14) becomes
τ τ
= + =
t C C
1 0
(16)
When
t
=
τ
then Eq(16) becomes2 1 1
0
0 C
C
C =
+
= (17)
Thus at
2 ,C C0
t=τ = .This quantity is called the
coagulation period, which is the time during which the initial concentration of particles is halved
3. Results and Discussion
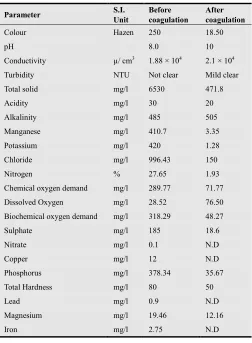
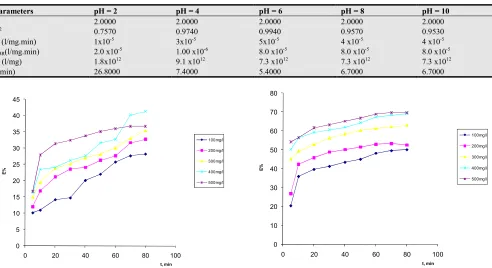
Table3.2 shows the characterization results of the CR coagulant. In all the analyzed parameters (moisture content, ash content, lipid content, crude protein, carbohydrate and crude fibre) protein happens to be the active agent responsible for the coagulation in these substrates [18]. The percentage protein content of CR is 31.25%. Wastewater effluent before and after treatment was characterized and the results obtained are presented in Table 3.1. The result of the wastewater sample indicates that some heavy metals such as iron, lead and copper which are 2.75mg/l, 0.90mg/l and 12.00mg/l before treatment respectively were totally removed during the coagulation process. Between 85% and 91% of magnesium, sulphates, chlorides and phosphates were also removed during the process. Figs.1 to 5 show the effect of coagulant dosage on turbidity removal at various pH. It can be observed from the figures that the removal of turbidity increases with increase in coagulant dosage. Fig 1-3 show the removal efficiency as a function of time for various CR coagulant dosages at pH of 2.4 and 6 respectively. It is observed from the figures that the rate of removal increases very fast within the first ten minutes for a particular dosage particularly as from pHof 4, after which the rate of increase begins to reduce. The sharp increase in removal efficiency at the early stages of coagulation is a product of either floc mechanism or combination of entrapment bridging mechanism[18].The decrease, thereafter in the rate of removal efficiency was due to the fact that as the reaction proceeds the amount of the suspended particles available for coagulation decreases.
The figures also show that the removal efficiency of CR coagulant increases with dosage. However, in fig. 4-5, it was observed that as pHwas increased further from 6 to 10, the rate of removal began to decrease. It could be deduced from the observation that the optimum turbidity removal of CR coagulant occurred at the optimum pH of 6 and 400 mg/l.
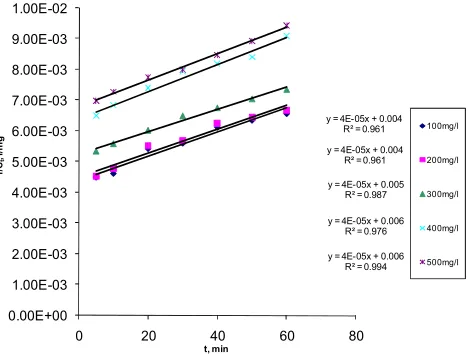
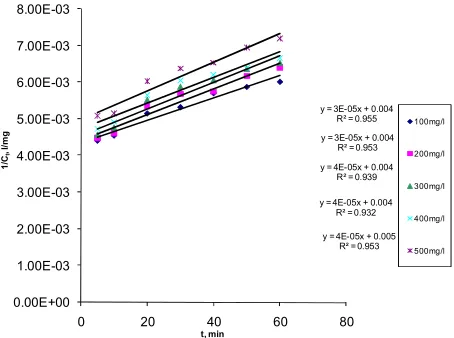
The values of coag-flocculation kinetic parameters at various dosages and pH are presented in tables 1-5. The R2
and coagulation rate constant K contained in the various tables were determined from the linear kinetic plots 1/Ct
versus time as shown in figures 6-10. The values of R2, being
grater than 0.9000 with the exception of few are satisfactory
and this confirms the theory of perikinetics as the controlling mechanism of coag-flocculation under study[18] It is observed that high value of K corresponds to low value of a relationship that establishes a link among collision efficiency εp, coagulation period and coagulation rate constant K .This
is supported by the highest value of K= 5x10⁻⁵ l/mg.min, and
the lowest value of =5.4000mins recorded ,at the dosage of 500mg/l, coagulation period =5.4000mins and at pHof 6 as presented in Table.5.However, at pH of 2 the high value of with the corresponding low value of εp and K indicate
repulsion in the system.
Table 3.1. Characterization result of waste water effluent before and after treatment.
Parameter S.I.
Unit
Before coagulation
After coagulation
Colour Hazen 250 18.50
pH 8.0 10
Conductivity µ/ cm3 1.88 × 10⁴ 2.1 × 10⁴
Turbidity NTU Not clear Mild clear
Total solid mg/l 6530 471.8
Acidity mg/l 30 20
Alkalinity mg/l 485 505
Manganese mg/l 410.7 3.35
Potassium mg/l 420 1.28
Chloride mg/l 996.43 150
Nitrogen % 27.65 1.93
Chemical oxygen demand mg/l 289.77 71.77
Dissolved Oxygen mg/l 28.52 76.50
Biochemical oxygen demand mg/l 318.29 48.27
Sulphate mg/l 185 18.6
Nitrate mg/l 0.1 N.D
Copper mg/l 12 N.D
Phosphorus mg/l 378.34 35.67
Total Hardness mg/l 80 50
Lead mg/l 0.9 N.D
Magnesium mg/l 19.46 12.16
Iron mg/l 2.75 N.D
N.D: Not detected
Table 3.2. Characterization results of coagulants.
Parameter CR
Moisture content (%) 10.00
Ash content (%) 14.50
Lipid content (%) 19.63
Crude protein (%) 31.25
Carbohydrate (%) 35.05
Table 1. Coagulation Kinetic Parameters of CR at varying pH and 100mg/l dosage.
Parameters pH = 2 pH = 4 pH = 6 pH = 8 pH = 10
α 2.0000 2.0000 2.0000 2.0000 2.0000
R2 0.9650 0.8330 0.9610 0.9860 0.9550
K (l/mg.min) 1x10⁻⁵ 3x10⁻⁵ 4x10⁻⁵ 3 x10⁻⁵ 3 x10⁻⁵
βBR(l/mg.min) 2.0 x10⁻⁵ 6.0 x10⁻⁵ 8.0 x10⁻⁵ 6.00 x10⁻⁵ 6.0 x10⁻⁵
εp (l/mg) 1.8x10¹² 5.4 x10¹² 7.3 x10¹² 5.4 x10¹² 5.4 x10¹²
τ(min) 26.8000 9.0000 6.7000 9.0000 9.0000
Table 2. Coagulation Kinetic Parameters of CR at varying pH and 200mg/l dosage.
Parameters pH = 2 pH = 4 pH = 6 pH = 8 pH = 10
α 2.0000 2.0000 2.0000 2.0000 2.0000
R2 0.9140 0.7940 0.9610 0.9770 0.9530
K (l/mg.min) 1x10⁻⁵ 3x10⁻⁵ 4x10⁻⁵ 4x10⁻⁵ 3 x10⁻⁵
βBR(l/mg.min) 2.0 x10⁻⁵ 6.0 x10⁻⁵ 8.0 x10⁻⁵ 8.0 x10⁻⁵ 6.0 x10⁻⁵
εp (l/mg) 1.8x10¹² 5.4 x10¹² 7.3 x10¹² 7.3 x10¹² 5.4 x10¹²
τ(min) 26.8000 9.0000 6.7000 6.7000 9.0000
Table 3. Coagulation Kinetic Parameters of CR at varying pH and 300mg/l dosage.
Parameters pH = 2 pH = 4 pH = 6 pH = 8 pH = 10
α 2.0000 2.0000 2.0000 2.0000 2.0000
R2 0.9230 0.9730 0.9870 0.9870 0.9390
K (l/mg.min) 1x10⁻⁵ 4x10⁻⁵ 4x10⁻⁵ 4 x10⁻⁵ 4 x10⁻⁵
βBR(l/mg.min)
εp (l/mg)
2.0 x10⁻⁵
1.8x10¹²
8.0 x10⁻⁵
7.3 x10¹²
8.0 x10⁻⁵
7.3 x10¹²
8.0 x10⁻⁵
7.3 x10¹²
8.0 x10⁻⁵
7.3 x10¹²
τ(min) 26.8000 6.7000 6.7000 6.7000 6.7000
Table 4. Coagulation Kinetic Parameters of CR at varying pH and 400mg/l dosage.
Parameters pH = 2 pH = 4 pH = 6 pH = 8 pH = 10
α 2.0000 2.0000 2.0000 2.0000 2.0000
R2 0.9120 0.9470 0.9760 0.9720 0.9320
K (l/mg.min) 1x10⁻⁵ 4x10⁻⁵ 4x10⁻⁵ 4 x10⁻⁵ 4 x10⁻⁵
βBR(l/mg.min) 2.0 x10⁻⁵ 8.0 x10⁻⁵ 8.0 x10⁻⁵ 8.0 x10⁻⁵ 8.0 x10⁻⁵
εp (l/mg) 1.8x10¹² 7.3 x10¹² 7.3 x10¹² 7.3 x10¹² 7.3 x10¹²
τ(min) 26.8000 6.7000 6.7000 6.7000 6.7000
Table 5. Coagulation Kinetic Parameters of CR at varying pH and 500mg/l dosage.
Parameters pH = 2 pH = 4 pH = 6 pH = 8 pH = 10
α 2.0000 2.0000 2.0000 2.0000 2.0000
R2 0.7570 0.9740 0.9940 0.9570 0.9530
K (l/mg.min) 1x10⁻⁵ 3x10⁻⁵ 5x10⁻⁵ 4 x10⁻⁵ 4 x10⁻⁵
βBR(l/mg.min) 2.0 x10⁻⁵ 1.00 x10⁻⁶ 8.0 x10⁻⁵ 8.0 x10⁻⁵ 8.0 x10⁻⁵
εp (l/mg) 1.8x10¹² 9.1 x10¹² 7.3 x10¹² 7.3 x10¹² 7.3 x10¹²
τ(min) 26.8000 7.4000 5.4000 6.7000 6.7000
Fig. 1. Coagulation efficiency profile for varying CR dosage at pH=2. Fig. 2. Coagulation efficiency profile for varying CR dosage at pH=4.
0 5 10 15 20 25 30 35 40 45
0 20 40 60 80 100
E
%
t, min
100mg/l 200mg/l 300mg/l 400mg/l 500mg/l
0 10 20 30 40 50 60 70 80
0 20 40 60 80 100
E
%
t, min
Fig. 3. Coagulation efficiency profile for varying CR dosage at pH=6.
Fig. 4. Coagulation efficiency profile for varying CR dosage at pH=8.
Fig. 5. Coagulation efficiency profile for varying CR dosage at pH=10.
Fig. 6. Kinetic plot of 1/ct versus time for varying CR dosage at pH=2.
Fig. 7. Kinetic plot of 1/ct versus time for varying CR dosage at pH=4.
Fig. 8. Kinetic plot of 1/ct versus time for varying CR dosage at pH=6. 0
10 20 30 40 50 60 70 80
0 20 40 60 80 100
E
%
t, min
100mg/l 200mg/l 300mg/l 400mg/l 500mg/l
0 10 20 30 40 50 60 70 80
0 20 40 60 80 100
E
%
t, min
100 200 300 400 500
0 10 20 30 40 50 60 70
0 20 40 60 80 100
E
%
t, min
100mg/l 200mg/l 300mg/l 400mg/l 500mg/l
y = 1E-05x + 0.002 R² = 0.965
y = 1E-05x + 0.003 R² = 0.914
y = 1E-05x + 0.003 R² = 0.923
y = 1E-05x + 0.003 R² = 0.912
y = 1E-05x + 0.003 R² = 0.757
0.00E+00 5.00E-04 1.00E-03 1.50E-03 2.00E-03 2.50E-03 3.00E-03 3.50E-03 4.00E-03 4.50E-03 5.00E-03
0 20 40 60 80
1
/C
t
,
l/
m
g
t, min
100mg/l 200mg/l
300mg/l
400mg/l
500mg/l
y = 3E-05x + 0.003 R² = 0.833
y = 3E-05x + 0.004 R² = 0.794
y = 4E-05x + 0.004 R² = 0.973
y = 4E-05x + 0.005 R² = 0.947
y = 5E-05x + 0.005 R² = 0.974
0.00E+00 1.00E-03 2.00E-03 3.00E-03 4.00E-03 5.00E-03 6.00E-03 7.00E-03 8.00E-03 9.00E-03 1.00E-02
0 20 40 60 80
1
/C
t
,
l/
m
g
t, min
100mg/l
200mg/l
300mg/l 400mg/l
500mg/l
y = 4E-05x + 0.004 R² = 0.961
y = 4E-05x + 0.004 R² = 0.961
y = 4E-05x + 0.005 R² = 0.987
y = 4E-05x + 0.006 R² = 0.976
y = 4E-05x + 0.006 R² = 0.994
0.00E+00 1.00E-03 2.00E-03 3.00E-03 4.00E-03 5.00E-03 6.00E-03 7.00E-03 8.00E-03 9.00E-03 1.00E-02
0 20 40 60 80
1
/C
t
, l
/m
g
t, min
Fig. 9. Kinetic plot of 1/ct versus time for varying CR dosage at pH=8.
Fig. 10. Kinetic plot of 1/ct versus time for varying CR dosage at pH=10.
4. Conclusion
The obtained kinetic results of low coagulation period, high collision efficiency and high coagulation rate constant are satisfactory. The high values of R2 confirm the theory of perikinetics as the controlling mechanism of coag-flocculation under study. The removal efficiency E(%) > 70 recorded at the optimum pH of 6 and dosage of 500mg/l, its biodegradable and non-toxic nature present the potential of CR as a source of organic derived coagulant applicable in large scale water treatment.
Nomenclature
βBR Collision factor for Brownian transport
εp Collision efficiency
1/2 Coagulation period /Half life
R2 Coefficient of Determination
α Coag-flocculation reaction order
CR Corchorus olitorius
K Coagulation rate constant
C Concentration of particles
Acknowledgement
The authors appreciate the Managing Director and the Technical Staff, Federal Superphosphate Fertilizer Company, Kaduna for making the waste water effluent available for this work. Our appreciations also go to Dr.Menkiti M.C and Dr. Nwabanne J.T both of the Department of Chemical Engineering Nnamdi Azikiwe University, Awka for their useful contributions to the success of this work.
References
[1] Holthof H; Egalhealf S.U; Borkovec M; Schurtenberger P and Sticher,H (1996);Coagulation rate measurement of colloidal particles by simultaneous static and dynamic light scattering. Langmuir 12,pp5541-5547
[2] Cardoso K.C.(2007) Estudo do processo de coagulacao/Floculacao for meio da Moringa Oleifera Lam para Obtenca o de Auga Potavel. 123f Dissertacao de Mestrado. Programa de Pos-Graduacao em Engenharia Quimica, Universidade Estadual de Maringa. (In Portuguese). [3] Mclachlan D.R.C (1995), Aluminum and the risk for
Alzheimers disease, Environmetrics. 6233-6275
[4] Diva karan, V.N.S. (Pillai (2001) Flocculation of Kaolinite suspension water by Chitosan, water Res. 35, 3904-3908 [5] Moraes, L.C.K (2004). Estudo da coagulacao-ultrafiltracao
como Biopohmero Quitosana para a producao de Agua Potavel, Dissertacao de Mestrado Quimica, universidade Estadual de Maringa, (in Portuguese).
[6] Ozacar, M and Sengil, I.A (2002) Effectiveness of tannins obtained from Velonia as a coagulant aid for dewatering of sludge. Water Res. 34 (4) 1407 – 1412
[7] Oladoja M.A and Ahu V.D (2008) evaluation of Plantain peelings ash extract as coagulant of colloidal particles in low pH aqua system, Water Quality Research Journal, Canada. [8] Roberts G.A.F, Adv. Chitin Sci 11 (1997), 22, Proceedings of
the 7th International Conference on Chitin R Chitosan, Lysons [9] Ogunrinde, A.T and Fashinmirin, J.T, (2011); Proceedings of
the Environmental Management Conference, Federal University of Agriculture, Abeokuta, Nigeria
[10] Van Wyk B, Garicke .N (2000), People’s Plants. A Guide to useful plants of Southern Africa, Briza publications, Pretoria, South Africa. pp 352.
[11] Ibrahim T.A and E.D Fagbohun,(2011) Physicochemical properties and invitro antibacterial activity of Corchorus olitorius linn. Seed oil. Life sciences leaflets 15: 499-505. [12] Fernandez-Kim (2004); Phsiochemical and functional
properties of crawfish chitosan as affected by different processing protocols, M.Sc. Thesis, Louisiana State University and Agricultural and mechanical College, U.S.A. [13] W.S.T (2003); About coagulation and flocculation Information
Bulletin, U.S.A.
[14] AWWA (2005); Standard Methods for the examination of water and waste water effluent, New York, U.S.A.
y = 3E-05x + 0.004 R² = 0.986 y = 4E-05x + 0.004
R² = 0.977 y = 4E-05x + 0.005
R² = 0.987 y = 4E-05x + 0.006
R² = 0.972 y = 4E-05x + 0.006
R² = 0.957
0.00E+00 1.00E-03 2.00E-03 3.00E-03 4.00E-03 5.00E-03 6.00E-03 7.00E-03 8.00E-03 9.00E-03 1.00E-02
0 20 40 60 80
1
/C
t
,
l/
mg
t, min
100mg/l 200mg/l 300mg/l 400mg/l 500mg/l
y = 3E-05x + 0.004 R² = 0.955 y = 3E-05x + 0.004
R² = 0.953 y = 4E-05x + 0.004
R² = 0.939 y = 4E-05x + 0.004
R² = 0.932 y = 4E-05x + 0.005
R² = 0.953
0.00E+00 1.00E-03 2.00E-03 3.00E-03 4.00E-03 5.00E-03 6.00E-03 7.00E-03 8.00E-03
0 20 40 60 80
1
/Ct
, l
/m
g
t, min
[15] Fridriskhberg, D.A (1984) A course in colloidal chemistry, Mir Publishers, Moscow, Russian
[16] Smoluchowski.M(1917) Versucheiner Mathematic Theory de Coagulations Kinetic Kolloider Louisungen Phys.Chem. 92;129-168.
[17] Danov,D.K, Kralchevsky,P.A and Ivanov I (2001); Dynamic process in surfactants stabilized emulsion, Faculty of Chemistry, University of Sofia.