* Corresponding author Tel.: +393479150738
E-mail: [email protected] (G. La Scalia)
2019 Growing Science Ltd. doi: 10.5267/j.ijiec.2019.2.003
International Journal of Industrial Engineering Computations 10 (2019) 349–360
Contents lists available at GrowingScience
International Journal of Industrial Engineering Computations
homepage: www.GrowingScience.com/ijiec
Firefly algorithm based upon slicing structure encoding for unequal facility layout problem
G. La Scaliaa*, R. Micalea, A. Giallanzaa and G. Marannanoa
aDepartment of Engineering, University of Palermo, Italy C H R O N I C L E A B S T R A C T
Article history:
Received December 18 2018 Received in Revised Format January 26 2019
Accepted February 3 2019 Available online February 4 2019
Finding the locations of departments or machines in a workspace is classified as a Facility Layout Problem. Good placement of departments has a relevant influence on manufacturing costs, work in process, lead times and production efficiency. This paper analyses the problem of allocating departments with restrictions in terms of unequal area and rectangular shape within a facility, in order to minimize the sum of material handling costs taking into account the satisfaction of the aspect ratio requested. In particular, we propose for the first time a Firefly Algorithm based on the slicing structure encoding. The proposed method was tested comparing the results obtained from other authors on the same literature instance. The results confirm the effectiveness of the Firefly Algorithm in solving the Facility Layout Problem by generating the best solutions with respect to those provided by previous researches.
© 2019by the authors; licensee Growing Science, Canada
Keywords:
Unequal Area-Facility Layout Problem
Firefly Algorithm Slicing Structure
1. Introduction
350
particular, the FA is a population-based optimization approach which aims at finding the optimum value of the given objective function. The population consists of a certain number of fireflies, each one is typified by its light intensity, which represents one solution of the objective function. To obtain the optimal solution, the fireflies should move in the direction of the most attractive ones and the new position is calculated based on the different light intensity. In most articles about layout problems, the main objective is to minimize a function related to the total material handling cost, however, to be more realistic, we have also considered more than a single aspect. This article presents a Firefly Algorithm to minimize the sum of the material handling costs maintaining the satisfaction of the department’s aspect ratio requested. There are two main formulations for unequal area facility layout problems: the Flexible Bay Structure (FBS) and the more recent slicing tree representation. In the FBS formulation (Tate & Smith, 1995; Konak et al., 2006), the assignment of departments generates columns or bays with different widths and number of departments. The width of a bay is automatically corrected according to the number of departments contained. The main advantage of the FBS is that the bays can be easily transformed in aisles helping designers to convert the model into a real facility. However, the FBS divides the floor only in one direction (vertically or horizontally). The slicing structure represents an alternative layout fractionation (Tam, 1992) in which an initial rectangular is divided either in horizontal or vertical direction and the procedure is recursively applied to the submatricesgenerated until the whole area is fully represented by rows or columns (Scholz et al., 2010; Aiello et al., 2012). In this paper, in order to explore a wider space of solutions, we propose to solve the facility layout problem by using a Firefly algorithm encoded by a slicing structure. The remainder of this article is organized as follows. The slicing structure and the firefly optimization procedure is formulated in Section 2. Section 3 provides an explanation of the computational models that are used in our proposed method by means of a numerical example. In Section 4, the methodology is discussed and the obtained results are analysed through a benchmarking procedure and a performance analysis. Finally, concluding remarks and future works are presented in Section 5.
2. Slicing layout generation and firefly optimization procedures
2.1 Random layout generation
The proposed FA is based on the referenced slicing structure, where a solution is represented by an n x m matrix E, called location matrix, which contains information about the relative locations of the departments on the floor. In our representation, in order to obtain a uniform encoding scheme, only quadratic matrices (n = m) are considered. Consequently, given N departments, the rank (r) of the corresponding location matrix is determined as the ceiling function of the square root of N:
√ . (1)
The number of elements in the matrix is thus greater or equal to the number of departments. In this case, Dummy departments (D= r2- N) with the null area are introduced. These Dummy departments have null
material fluxes from/to other departments and are indexed as zero. The demonstration steps of the generation of the random layouts based on the slicing structure are reported below using an illustrative example of 20 departments.
The first step of the proposed optimization procedure consists in randomly generating an initial vector corresponding to the first firefly. This firefly contains a set of random numbers equal to the sum of the departments and the dummy departments (j = D+N) belonging to the range [0-1].
This procedure is reported in the following example, in which there are 20 departments and 5 dummy facilities.
1,1... 1,j
A a a
G. La Scalia et al. / International Journal of Industrial Engineering Computations 10 (2019) 351
When r2 >N, the dummy departments D are assigned to the smaller values of the string and they are
substituted by 0 values in the same position.
The second step consistsin the creation of a vector in which the random numbers other than zero of the A vector are ordered (k=20).
The third step substitutes at each element b1,k of the vector B, a number in the range between 1 to 20 and
these numbers are inserted in a vector , … , (k=20) in which their position corresponds to the ones reported in the main vector A, excluding the dummy departments from this procedure:
The fourth step generates a vector (j=25) obtained from the A vector, in which, except the 0 values, each random value is substituted by the value c1,k.
In the fifth step, the D vector is reshaped in a quadratic matrix E
⋯
⋮ ⋮ ⋮
…
where r is the rank of the E matrix (r=5).
In this matrix, the slicing structure is applied and the corresponding layout is generated.
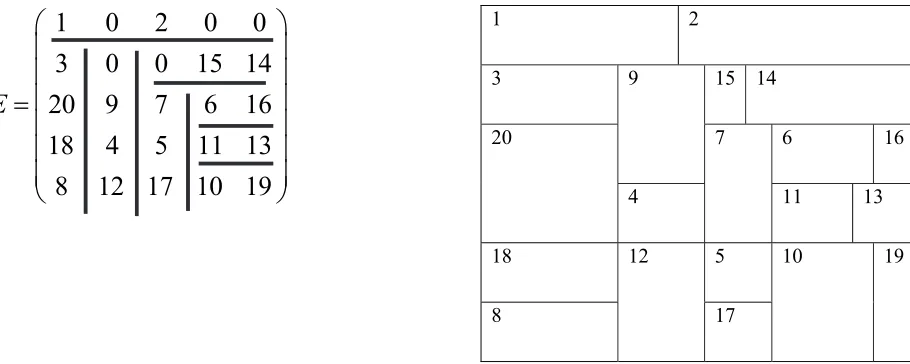
Fig. 1. Location matrix, slicing structure and the corresponding layout
The proposed algorithm generates random values 0 or 1 where 0 indicates a sequence of horizontal– vertical cuts, whereas 1 a sequence of vertical-horizontal cuts. Considering every possible alternative for the decomposition, the maximum number of cuts in which the matrix can be divided, is calculated by the equation reported in Aiello et al., (2012).
In the sixth step, the objective function can be calculated in terms of Material Handling Cost (MHC) and a control on the Aspect Ratio Satisfaction (ARS) is effectuated (section 2.3). Layouts are considered feasible only if the condition ∏ 0 is reached.
0.259 0 0.276 0 0 0.282 0 0 0.663 0.702 0.474 0.433 0.771 0.370 0.832 0.744 0.777 0.755 0.321 0.319 0.522 0.825 0.534 0.877 0.351
A
1,1... 1,k
B b b
0.259 0.276 0.283 0.319 0.321 0.352 0.370 0.433 0.474 0.522 0.534 0.663 0.702 0.744 0.755 0.772 0.777 0.825 0.832 0.877
B
1 2 3 15 14 20 9 7 6 16 18 4 5 11 13 8 12 17 10 19
C
1,1... 1,j
D d d
1 0 2 0 0 3 0 0 15 14 20 9 7 6 16 18 4 5 11 13 8 12 17 10 19
D
1
0
2
0
0
3
0
0 15 14
20 9
7
6 16
18
4
5 11 13
8 12 17 10 19
E
1 2
3 9 15 14
20 7 6 16
4 11 13
18 12 5 10 19
352
The whole procedure starts from 2,000 iterations and it is reiterated until a population of at least ten feasible solutions is obtained. Each feasible layout represents a firefly and the optimization procedure is reported in the section below. Moreover, the software memorizes the sequence of the cuts used to generate the layouts.
2.2. Firefly optimization procedure
In the FA, the variation of the light intensity and attractiveness are main concerns. This attractiveness is determined by brightness, which is associated to the objective function. After generating an initial number of fireflies or solutions of the problem, the light intensity of firefly is updated. Assuming the absorption coefficient γ, the light intensity of firefly varies depending on the square of the distance d, as in the following equation:
, (2)
where L0 denotes the light intensity of the source. The attractiveness of fireflies is proportional to their
light intensity L. Thus, Eq. (3) is given, in order to describe the attractiveness.
, (3)
where β0 is the attractiveness at d = 0. The distance between any two fireflies pi and pj is taken as the
Euclidean distance. Considering each firefly as a sequence of D+N departments, the distance between two fireflies can be formulated as follows:
, , . (4)
The i-th firefly is attracted by another brighter firefly j. The movement of the firefly from one position to another is expressed by the following equation:
(5)
in which =0.2 and is a random number in the range [0,1].The parameter γhas a crucial effect on the convergence speed of the algorithm. The value of this parameter depends on the problem which needs optimization. Typically, its value ranges from 0.1 to 10 (Yang, 2010). The FA is controlled by three parameters: the randomization parameter, the attractiveness, and the absorption coefficient. By adjusting these parameters, we can obtain good results from an optimization problem. The flowchart of the FA is shown in Fig. 2.
In the first step the vectors corresponding to the feasible layouts (fireflies) are sorted on
the basis of theobjective function and afterwards the matrix F
⋯
⋮ ⋮ ⋮
… is built, in which for the example considered j=25 and z as the number of feasible layouts. The first line corresponds to the firefly with the minimum material handling cost and it is considered as a “Firefly Queen” (FQ) of the initial population.
In the second step the distance of each firefly from the best (FQ) is calculated using Eq. (4).
In the third step the position of fireflies is updated by putting the distance and the intensity values in Eq. (5).
1,1... 1,j
G. La Scalia et al. / International Journal of Industrial Engineering Computations 10 (2019) 353
In the fourthstep the software creates a matrix G
⋯
⋮ ⋮ ⋮
…
which memorizes the new values obtained by applying Eq. (5). In order to maintain the FQ, the first line of the G matrix is calculated using 0 and the same cut sequence of the first population.
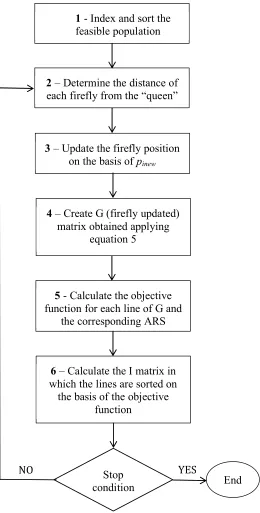
Fig. 2.Flow chart of FA optimization procedure
1 - Index and sort the feasible population
2 – Determine the distance of each firefly from the “queen”
3 – Update the firefly position on the basis of pinew
4 – Create G (firefly updated) matrix obtained applying
equation 5
5 - Calculate the objective function for each line of G and
the corresponding ARS
6 – Calculate the I matrix in which the lines are sorted on the basis of the objective
function
Stop
condition End
354
The fifth step computes the objective function for each line of the G matrixand the corresponding ARS.
Finally, in the sixth step a matrix I
⋯
⋮ ⋮ ⋮
… sorted on the basis of the objective function, is created. The first line represents the new FQ that can or cannot coincide with the old one.
The software memorizes the sequence of the cuts and the procedure is repeated from step 2 until the stop condition (maximum number of iteration) is reached.
2.3 Objective function
In the proposed approach, the objective function (FO) is the minimization of the material handling cost:
, (6)
where fijis the material flow between the departments i and j, cij is the unit cost (the cost to move one
unit load one distance from department i to department j) and dij is the distance between the centres of
departments using the Manhattan distance. For each department, a specific aspect ratio is required, for instance in order to optimize the location of the machines inside. Let h and w be the two dimensions of the rectangle, the aspect ratio of the department j is defined as:
,
, .
(7)
The degree of the aspect ratio satisfaction linearly decreases from an optimal to a minimum value if it is included in a given range, otherwise it drastically drops to zero (unfeasible layout). The simplest shape of such score function is given in (Aiello et al., 2006) where the upper limit was modified according to the instance of Armur and Buffa (1963) in which the maximum value of the range is 4. Moreover, in our approach a specific aspect ratio function could be associated to each department in order to consider the real industrial cases in which the aspect ratio requested could not be the same for all the departments, due to their different uses.
3. Numerical example
In this section the solution of unequal area FLPs is given following the layout solution representation and the layout arrangement procedure described in section 2. In order to validate the proposed algorithm, we consider the instance from Armour and Buffa (1963) to undertake experiments and comparisons. The authors give a specification of the problem set, departmental areas, product flows between departments and material handling costs respectively in tables 1, 2 ,3 and 4.
Table 1
Specification of the problem set
Problem name Floor space dimension Department requirements Data reference
AB20 30.0 x 20.0 ARS max=4 Armour and Buffa, 1963
Table 2
Department areas
G.
La
S
cali
a et al.
/ Interna tio na l Journ al o f Industri al Eng ine eri ng Comp utat ion
s 10 (2019)
355 Ta bl e 3 Pro du ct fl ow s betwee n de pa rtm ent s
1 2 3 4
5 6 7 8 9 10 11 12 13 14 15 16 17 18 19 20 1 0 12 0 80 0 0 0 0 0 0 40 80 0 0 80 0 0 0 0 0 0 2 120 0 80 1, 63 0 30 0 93 0 0 80 90 0
0 0 0 0 0
0 0 46 0 0 3 80 80 0 0 0 130 0 0 21 0 260 0 0 0 87 0 0 0 0 0 91 0 0 4 0 1,630 0 0 60 380 50 0 0 13 0 0 0 70
0 0 0 0
0 100 1,050 0 5 0 30 0 60 0 0 15 0 90 0 60 0 0 0 0 90 0 0 0 0 0 6 0 0 130 38 0 0 0 41 0 0 0 0 0 30
0 0 0 0
0 70 0 0 7 0 93 0 0 50 0 150 410 0 1, 600 0 110 0 0 0 60 0 0 0 110 0 250 8
0 0 0 0
90 0 1,600 0 0 0 0 0 40
0 0 0
0 0 50 0 2, 230 9 0 80 210 13 0 0 0 0 0 0 0 0 0 0 50 0 0 0 500 0 0 0 10 40 9 0 260 0 60 0 1 10 0 0 0 30 800 0 1,240 160 0 0 0 3 50 0 11 80 0 0 0 0 0 0 0 0 30 0 150 0 20 0 80 1, 50 0 350 90 0 0 12
0 0 0
70 0 30 0 0 0 800 15 0
0 0 0
110 0 1, 000 0 56 0 0 13 0 0 0 0 0 0 0 40 0 0 0 0 0 50 0 40 50 0 0 40 0 0 14 80 0 870 0 0 0 60 0 50 0 1, 240 20 0 0 500 0 650 0 0 60 0 0 15 0 0 0 0 90 0 0 0 0 160 80 110 40 65 0 0 0 350 0 0 0 16
0 0 0 0
0 0 0 0 0 0 1, 50 0 0 500
0 0 0
1, 000 0 0 0 17 0 0 0 0 0 0 0 0 50 0 0 35 0 1, 000 0 0 350 1, 00 0 0 0 50 0 0 18
0 0 0
10 0 0 70 11 0 0 0 0 90 0 0 60 0 0 0 0 32 0 0 19 0 46 0 910 1, 05 0 0 0 0 500 0 350 0 560 0 0 0 0 500 320 0 0 20
0 0 0 0
0 0 25 0 2, 230 0 0 0
0 0 0 0 0
0 0 0 0 Ta bl e 4 Mate ri al ha ndl in g co st s
1 2 3 4
5 6 7 8 9 10 11 12 13 14 15 16 17 18 19 20 1 0 0.015 0. 015 0 0 0 0 0 0 0. 026 0. 01 4 0 0 0.015 0 0 0 0 0 0 2 0.
015 0 0.
012 0. 01 5 0. 026 0 0.015 0 0. 01 5 0. 015 0 0 0 0 0 0 0 0 0.015 0 3 0. 015 0.012 0 0 0 0. 01 7 0 0 0. 01 5 0. 015 0 0 0 0.015 0 0 0 0 0.015 0 4 0 0.015 0 0 0. 018 0. 01 5 0.015 0 0. 01 8 0 0 0 .020 0 0 0 0 0 0. 01 5 0.015 0 5 0 0.026 0 0. 01 8 0 0 0.015 0. 015 0 0. 026 0 0 0 0 0. 015 0 0 0 0 0 6 0 0 0. 017 0. 01 5 0 0 0.015 0 0 0 0 0. 015
0 0 0 0
0 0. 01 5 0 0 7 0 0.015 0 0. 01 5 0. 015 0. 01 5 0 0. 015 0 0. 017 0 0 0 0.016 0 0 0 0. 01 5 0 0. 015 8
0 0 0 0
0. 015 0 0.015 0 0 0 0 0 0. 015
0 0 0
0 0 0.015 0. 015 9 0 0.015 0. 015 0. 01 8 0 0 0 0 0 0 0 0 0 0.015 0 0 0. 015 0 0 0 10 0. 026 0.015 0. 015 0 0. 026 0 0.017 0 0 0 0. 01 2 0. 015 0 0.015 0. 012 0 0 0 0.015 0 11 0. 014 0 0 0 0 0 0 0 0 0. 012 0 0. 015 0 0.015 0. 012 0. 01 5 0 0 0.015 0 12 0 0 0 0. 02
0 0 0.
01 5 0 0 0 0. 015 0. 01 5 0 0 0 0. 015 0 0. 015 0 0.015 0 13 0 0 0 0 0 0 0 0. 015 0 0 0 0 0 0.016 0. 026 0. 01 2 0 0 0 0 14 0.
015 0 0.
015 0 0 0 0.016 0 0. 01 5 0. 015 0. 01 5 0 0.
016 0 0.
015 0 0 0. 01 5 0 0 15 0 0 0 0 0. 015 0 0 0 0 0. 012 0. 01 2 0. 015 0. 026 0.015 0 0 0. 015 0 0 0 16
0 0 0 0
0 0 0 0 0 0 0 0 0. 012
0 0 0
0. 012 0 0 0 17 0 0 0 0 0 0 0 0 0. 01 5 0 0 0. 015 0 0 0. 015 0. 01 2 0 0 0.015 0 18
0 0 0
0. 01 5 0 0. 01 5 0.015 0 0 0 0 0 0 0.015 0 0 0 0 0.015 0 19 0 0.015 0. 015 0. 01 5 0 0 0 0. 015 0 0. 015 0. 01 5 0. 015 0 0 0 0 0. 015 0. 01 5 0 0 20
0 0 0 0
0 0 0.015 0. 015 0 0 0
0 0 0 0 0
0 0
0
356
The algorithm is coded using Matlab software and simulations were conducted on an INTEL Core i7 (3.2 GHz) workstation with 16 Gb RAM. Table 5 shows the obtained non- dominated (Pareto) solutions in terms of objective function and ARS calculated as the mean value of the ARS of each department.
Table 5
Summary of the best solutions obtained
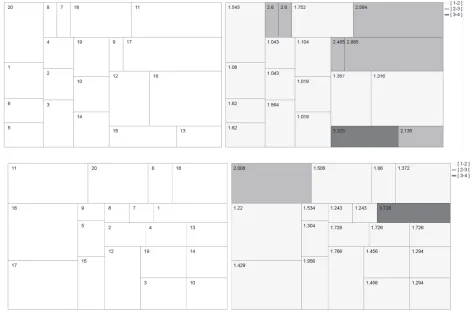
B vector Material Handling cost ARS
20-1-6-5-8-7-18-11-4-2-3-19-10-14-9-17-12-16-15-13 3228.89 0.7662
11-20-6-18-16-17-9-5-15-8-7-1-2-4-13-12-19-14-3-10 3391.90 0.8821 11-16-17-20-6-18-9-5-15-8-7-1-2-12-4-13-19-3-14-10 3410.62 0.8861
11-16-17-20-18-6-9-8-7-5-14-15-13-3-1-4-10-2-12-19 3525.49 0.9294
G. La Scalia et al. / International Journal of Industrial Engineering Computations 10 (2019) 357
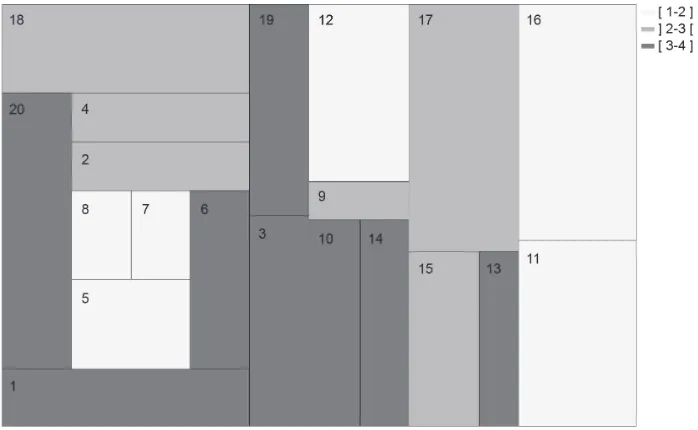
Fig. 3. Block layouts corresponding to the optimal solutions obtained
4. Benchmarking procedure and performance analysis
To evaluate the performance of the proposed approach, the results obtained were compared to the results achieved in the previous studies. In particular, three different approaches are used for the comparison: metaheuristic, mathematical programming and hybrid approaches (Kang & Chae, 2017). The overall comparison between the best solution obtained in this research and the best-known best solution provided by the previous studies are reported in table 6. It shows that the present approach is quite robust in terms of solution quality: it determined the best-known solution in terms of reduction of material handling cost maintaining a good degree of aspect ratio satisfaction. In particular, the comparison has been made in terms of a percentage reduction of the material handling cost obtained in Armour and Buffa (1963).
Table 6
Comparison of results in terms of reduction of Material handling Cost
Problem name
Sholz et al., 2009
Komarundin &Wong 2010
Kulturen Konak &Konak 2011
Gongalves & Resende 2015
Chang& Ku 2013
Kang& Chae 2017
FA approach
AB20 -33.54% -36.75% -32.12% -36.13% -34.47% -36.92% -58.93%
358
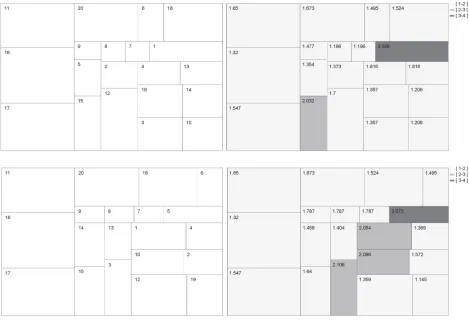
Fig. 4. Best layout obtained by Kang and Chae (2017)
Additionally, the evolution of Pareto-front obtained by taking into account the objective function and the aspect ratio has been determined. In particular, the non-dominated layout (i.e. the Pareto front) has been extracted in five different phases of the evolution procedure (namely 1000, 1500, 2000, 2500, 3000 iterations) as reported in figure 5. The results show that in the initial steps of the evolution, the Pareto fronts are very close and they could even overlap with each other. As the population evolves, however, better solutions are generated and the frontier moves to the upper right corner, in a more evident manner.
Fig. 5. Evolution progress of the Pareto front 0.6
0.65 0.7 0.75 0.8 0.85 0.9 0.95
0.00023 0.00025 0.00027 0.00029 0.00031 0.00033
AS
PECT
R
ATIO S
A
TIS
FA
TION
1/Material Handlig Cost
Evolution
of
the
Pareto
Frontier
G. La Scalia et al. / International Journal of Industrial Engineering Computations 10 (2019) 359
5. Conclusions
The UA-FLP is a NP-hard optimization problem, which still involves designers and researchers in finding efficient and feasible solutions as the recent literature confirms. The development of innovative solution procedure is nowadays frequently considered in order to improve the effectiveness of the traditional approaches. This study has been conducted to propose an advanced method based on the firefly algorithm to solve the plant layout problems encountered in the industrial context. The problem is perceived in association with its multi-dimensional aspects, taking into account both material handling costs and department shapes. The benefits of the proposed method have emerged in the comparison with referenced results. Computational results show, in fact, that the proposed algorithm is robust because it determines the best-known solution to the problem set presented. Further improvements of the proposed methodology will include the comparison of the results obtained using more instances and the analysis of the effects of different parameters of the FA on the final solution for measuring the performance of the proposed approach on UA-FLPs. Moreover, the development of a methodology to treat the decision process considering the uncertainty related to the material flows between departments could be investigated using the fuzzy theory.
References
Aiello, G., Enea, M., & Galante, G. (2006). A multi-objective approach to facility layout problem by genetic search algorithm and Electre method. Robotics and Computer-Integrated Manufacturing, 22(5-6), 447-455.
Aiello, G., La Scalia, G., & Enea, M. (2012). A multi-objective genetic algorithm for the facility layout problem based upon slicing structure encoding. Expert Systems with Applications, 39(12), 10352– 10358.
Aiello, G., La Scalia, G., & Enea, M. (2013). A non dominated ranking multi objective genetic algorithm and electre method for unequal area facility layout problems. Expert Systems with Applications, 40
(12), 4812–4819.
Armour, G.C., & Buffa, E.S., (1963). A heuristic algorithm and simulation approach to relative location of facilities. Management Science, 9(2), 294–309.
Chang, M.S., & Ku, T.C. (2013). A slicing tree representation and QCP-model- based heuristic algorithm for the unequal-area block facility layout problem. Mathematical Problems in Engineering, 1–19. Garey, M.R., & Johnson, D.S. (1979). Computers and intractability: A guide to the theory of
NP-completeness. W.H. Freeman, New York.
Gonçalves, J.F., & Resende, M.G.C. (2015). A biased random-key genetic algorithm for the unequal area facility layout problem. European Journal of Operational Research, 246(1), 86–107.
Kang, S., & Chae, J. (2017). Harmony search for the layout design of unequal area facility. Experts systems with applications, 79, 269-281.
Komarudin, Wong, K.Y. (2010). Applying ant system for solving unequal area facility layout problems.
European Journal of Operational Research, 202(3), 730–746.
Konak, A., Kulturel-Konak, S., Norman, B.A., & Smith, A.E. (2006). A new mixed integer programming formulation for facility layout design using flexible bays. Operations Research Letters, 34(6), 660 – 672.
Kulturel-Konak, S., & Konak, A. (2011). A new relaxed flexible bay structure representation and particle swarm optimization for the unequal area facility layout problem. Engineering Optimization, 43(12), 1263–1287.
McKendall Jr, A.R., & Jaramillo, J.R., (2006). A tabu search heuristic for the dynamic space allocation problem. Computers and Operations Research, 33(3), 768–789.
Palomo-Romero, J.M., Salas-Morera, L., & Garcıa-Hernandez, L., (2017). An island model genetic algorithm for unequal area facility layout problems. Experts Systems with Applications,68, 151–162.
360
Scholz, D., Petrick, A., & Domschke, W. (2009). Stats: A slicing tree and tabu search based heuristic for the unequal area facility layout problem. European Journal of Operational Research, 197(1), 166– 178.
Scholz, D., Jaehn, F., & Junker, A. (2010). Extensions to STaTS for practical applications of the facility layout problem. European Journal of Operational Research, 204(3), 463–472.
Sönmez, Ö. E., & Baray, Ş. A. (2013). Application of firefly metaheuristic algorithm for the single row facility layout problem. In Advances in Sustainable and Competitive Manufacturing Systems (pp. 1165-1172). Springer, Heidelberg.
Tam, K.Y. (1992). Genetic algorithms, function optimization, and facility layout design. European Journal of Operational Research, 63(2), 322 – 346.
Tate, D.M. & Smith, A.E. (1995). Unequal area facility layout by genetic search. IIE Transactions, 27(4), 465– 472.
Tavakkoli-Moghaddam, R., Torabi, N., & Ghaseminejad, A. (2015). A quaternion firefly algorithm to solve a multi-row facility layout problem. International Journal of Engineering, Transactions B: Applications, 28(11), 1605-1613.
Ulutas, B.H., & Kulturel-Konak, S. (2012). An artificial immune system based algorithm to solve unequal area facility layout problem. Expert Systems with Applications, 39(5), 5384–5395.
Yang, X.S. (2010). Firefly algorithm, stochastic test functions and design optimisation. International Journal of Bio-Inspired Computation, 2(2), 78–84.