computers
Article
A Proposed DoS Detection Scheme for Mitigating
DoS Attack Using Data Mining Techniques
Kotey Seth Djanie1 , Tchao Eric Tutu1,* and Gadze James Dzisi2
1 Department of Computer Engineering, Kwame Nkrumah University of Science and Technology, Kumasi AK000-AK911, Ghana; [email protected]
2 Department of Telecommunications Engineering, Kwame Nkrumah University of Science and Technology, Kumasi AK000-AK911, Ghana; [email protected]
* Correspondence: [email protected]
Received: 17 October 2019; Accepted: 14 November 2019; Published: 26 November 2019
Abstract:A denial of service (DoS) attack in a computer network is an attack on the availability of computer resources to prevent users from having access to those resources over the network. Denial of service attacks can be costly, capable of reaching $100,000 per hour. Development of easily-accessible, simple DoS tools has increased the frequency and reduced the level of expertise needed to launch an attack. Though these attack tools have been available for years, there has been no proposed defense mechanism targeted specifically at them. Most defense mechanisms in literature are designed to defend attacks captured in datasets like the KDD Cup 99 dataset from 20 years ago and from tools no longer in use in modern attacks. In this paper, we capture and analyze traffic generated by some of these DoS attack tools using Wireshark Network Analyzer and propose a signature-based DoS detection mechanism based on SVM classifier to defend against attacks launched by these attack tools. Our proposed detection mechanism was tested with Snort IDS and compared with some already existing defense mechanisms in literature and had a high detection accuracy, low positive rate and fast detection time.
Keywords: denial of service; attack tool; defense; detection; signature-based
1. Introduction
The internet today is one of civilization’s most important innovations. The internet is an interconnection of many networks across the globe [1,2]. Internet usage has significantly increased over the past 20 years with more than half the world’s population currently having access to the internet [3]. The advances being made to ensure the internet can cater for the increasing users and services has inevitably introduced some security vulnerabilities [4]. Network resource availability to legitimate users is one of the single most important concepts guiding cybersecurity policies [5]. Network resource availability guarantees constant and reliable access to the network and data by legitimate users. Every organization seeks to make data available to legitimate users when needed to enforce maximum productivity. E-commerce businesses can be put out of business temporarily during the period in which the network is not available to users to access their websites. It is therefore desirable to have the network available to users and consumers as much as possible.
A denial of service (DoS) attack is an attack on the availability of a network resources [6]. A DoS attack is launched by a single attacker by sending a huge amount of bogus traffic to a victim in an attempt to render it inaccessible to legitimate users [7]. A distributed denial of service (DDoS) attack involves multiple attackers launching a coordinated attack on the same victim [8]. DDoS attacks can be viewed as multiple coordinated DoS attacks at the same victim simultaneously. The highest attacks recorded, a 1.3 Tbps attack [9] and a 1.7 Tbps attack [10], were reported in 2018 within days of
each other. Though DoS attacks are generally not perpetrated for financial gain, they end up causing financial losses capable of reaching $100,000 per hour to the victim [11].
DoS attacks in past years required a lot of knowledge and skill to launch. In recent years however, simple DoS attack tools have been developed and made easily accessible on the internet for free or for a little sum of money [12]. This has made it possible for unskilled users to launch disruptive attacks. Though such tools have been available for years, there has been no defense mechanism proposed specifically targeting these tools. Most defense mechanisms in literature are designed to defend attacks captured in datasets like the KDD Cup 99 dataset from 20 years ago and from tools no longer in use in modern attacks [13]. Knowledge of traffic features of current DoS attack tools is also not available.
In this paper, we capture and analyze traffic generated by some easy-to-get DoS tools. We present characteristics of these DoS attack tools and attempt to determine the differences between the attack traffic and legitimate traffic. We also propose a signature-based detection scheme based on support-vector machine (SVM) classifier to detect attacks from these attack tools. SVM is a supervised classifier which uses traffic features to classify traffic as attack or benign. SVM is known to have high accuracy and low false positive rates, which are desired of a good detection scheme. This is possible because previously studied traffic features are used to develop a pattern for matching new traffic. We tested the proposed detection scheme and compared with some existing detection schemes in literature.
The rest of the paper is organized as follows: related works are presented in Section 2, the methodology is presented in Section3, the results are presented in Section4 and the paper is concluded in Section5.
2. Related Works
Different DoS defense mechanisms have been proposed in literature [14] to defend against different types of DoS attacks. There is however very little focus on DoS tools. Several DoS tools are available to download on the internet for unskilled users to launch DoS attacks. However, there is very little literature focusing on characterizing and proposing defense mechanisms targeting these tools. Most studies also focus on tools no longer in use [13]. Very few discussed current DoS attack tools. We review some works which focused on some DoS attack tools.
Bukac and Matyas [15] analyzed comparatively the features of traffic generated by standalone DoS attack tools. Traffic features of the various tools were classified, and the techniques to evade detection in the tools to were presented. To ensure accurate analysis, traffic was generated and captured in a closed environment to prevent interference from background data. Traffic burst behavior, flow parallelism, flow count, flow packet count, HTTP request per flow and HTTP request uniform resource identifiers were analyzed as part of their study. Future research directions were presented without proposing a defense mechanism against the tools studied.
Mahadev et al. [16] presented a classification of threats based on anomalous behaviors at the application layer. Threats were classified according to low rate requests, low rate session and resource depletion attacks. A summary of a number of DoS tools was also presented. Some attack tools presented include Knight, Shaft, Trinity, Trinoo, and LOIC. They further described some DoS prevention methods but did not propose a defense mechanism against the attack tools.
Computers2019,8, 85 3 of 17
3. Methododology
This section presents the processes undertaken during the research. Figure1shows a flowchart of the different phases of the research.
Computers 2019, 8, 85 3 of 18
3. Methododology
This section presents the processes undertaken during the research. Figure 1 shows a flowchart of the different phases of the research.
Figure 1. Research phases.
3.1. Experimental Setup
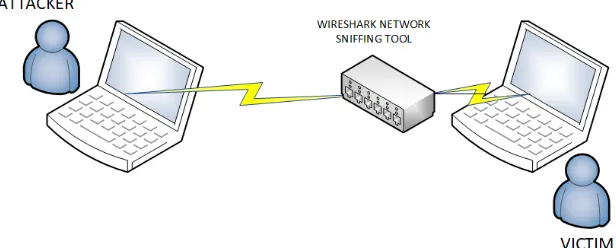
Network traffic used in this research was captured in an isolated environment, as seen in Figure 2, to prevent background traffic interference. A virtual machine running Ubuntu 19 was set up as the victim machine. The host machine was set up as the attacking machine. Wireshark Network Analyzer was used to capture and display network traffic over the wired channel connecting the attacking and victim machines. Network layer attacks were considered for this study. Figure 2 shows the setup used in capturing attack traffic. The algorithm proposed was tested using Snort IDS.
Figure 2. Flow chart of Internet Control Message Protocol (ICMP) attack detection algorithm.
3.2. Attack Launch
Eight DoS attack tools were used as part of the research. The attack tools were selected based on their simplicity to use and ease of access on the internet. The tools used were LOIC v1.0.8, HOIC v2.1,
Figure 1.Research phases.
3.1. Experimental Setup
Network traffic used in this research was captured in an isolated environment, as seen in Figure2, to prevent background traffic interference. A virtual machine running Ubuntu 19 was set up as the victim machine. The host machine was set up as the attacking machine. Wireshark Network Analyzer was used to capture and display network traffic over the wired channel connecting the attacking and victim machines. Network layer attacks were considered for this study. Figure2shows the setup used in capturing attack traffic. The algorithm proposed was tested using Snort IDS.
Computers 2019, 8, 85 3 of 18
3. Methododology
This section presents the processes undertaken during the research. Figure 1 shows a flowchart of the different phases of the research.
Figure 1. Research phases.
3.1. Experimental Setup
Network traffic used in this research was captured in an isolated environment, as seen in Figure 2, to prevent background traffic interference. A virtual machine running Ubuntu 19 was set up as the victim machine. The host machine was set up as the attacking machine. Wireshark Network Analyzer was used to capture and display network traffic over the wired channel connecting the attacking and victim machines. Network layer attacks were considered for this study. Figure 2 shows the setup used in capturing attack traffic. The algorithm proposed was tested using Snort IDS.
Figure 2. Flow chart of Internet Control Message Protocol (ICMP) attack detection algorithm.
3.2. Attack Launch
Eight DoS attack tools were used as part of the research. The attack tools were selected based on their simplicity to use and ease of access on the internet. The tools used were LOIC v1.0.8, HOIC v2.1,
Figure 2.Flow chart of Internet Control Message Protocol (ICMP) attack detection algorithm.
3.2. Attack Launch
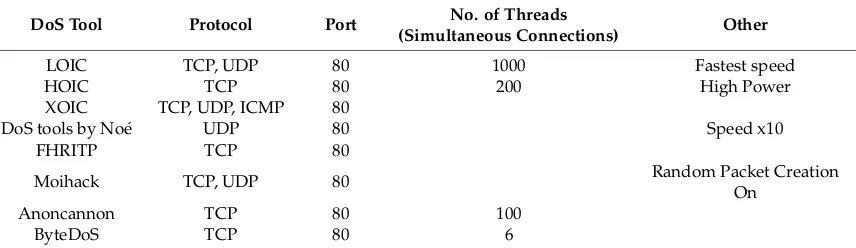
v2.1, XOIC v1.2, DoS tools by Noé, FHRITP, Moihack, Anoncannon v1.06 and ByteDoS v3.2. Table1is a summary of the configurations of the tools used as well as the type of attack traffic they are capable of producing.
Table 1.Summary of tool configurations.
DoS Tool Protocol Port No. of Threads
(Simultaneous Connections) Other
LOIC TCP, UDP 80 1000 Fastest speed
HOIC TCP 80 200 High Power
XOIC TCP, UDP, ICMP 80
DoS tools by Noé UDP 80 Speed x10
FHRITP TCP 80
Moihack TCP, UDP 80 Random Packet Creation
On
Anoncannon TCP 80 100
ByteDoS TCP 80 6
3.3. Traffic Capture
Attack traffic from the tools was captured, as well as benign traffic. Benign traffic was captured by opening several webpages and internet-based services to mimic normal network use. The Dumpcap file generated by Wireshark was saved for offline analysis.
3.4. Traffic Features Identification
Traffic rates are a key identifier of a DoS attack. Traffic packet rates and byte rates as well as the average sizes of packets were identified. Most DoS attacks generally transmit a huge number of packets and or large volume of traffic within a short period of time. High byte or packet rates could therefore indicate an attack. Some TCP-based DoS attacks also exploit the nature of the TCP three-way handshake by opening several connections and either close them immediately without sending data, send very little data and close the connections or leave the connections open without sending any data. The average packet size for TCP traffic can provide an idea of whether or not data is being transmitted.
3.5. Packet Inspection
Traffic packets captured from attack traffic were inspected to determine the type and form of packets they are. For TCP traffic, a three-way handshake is generally expected for establishing a connection, followed by the payload. The number of packets with the syn flag set gives an idea of the number of connections requested by an IP address. ICMP packets have a type field and code field. The type and code field combination determine the type of control message being sent.
3.6. Attack Traffic vs. Benign Traffic
Attack traffic was differentiated from benign traffic using the traffic features and patterns observed from traffic packets. The differences in traffic features and patterns between expected traffic and attack traffic is a very important guide when designing a DoS defense mechanism.
4. Results
In this section, we present the results of analyzing traffic produced by the DoS attack tools studied. We also present our proposed algorithm with the results obtained from testing it. The results of our proposed DoS attack detection algorithm are also compared with some existing DoS detection schemes.
4.1. Traffic Features and Types of Packet
Computers2019,8, 85 5 of 17
packets sent over the network channel with time. Byte rate is the volume of data sent over channel with time. Traffic containing similar sized packets will produce a similar pattern in packet rate and byte rate. This is a key indicator for TCP attacks requesting connections and closing them after connection is given without sending any data. The difference in packet rate and byte rate patterns and values can also indicate the nature of the DoS attack. Attacks with a high byte rate to packet rate ratio indicates the transfer of larger packet sizes, meaning a lot of bogus data is being transmitted. A low byte rate to packet rate ratio means smaller packet sizes are being sent, with the focused on transmitting a large number of packets with very little or no data. Packets without data normally have a size of 60 bytes or less, therefore a byte to packet rate ratio close to 60 indicates little or no data is being sent. The types of packets sent, and their contents, also provide an idea of what could be or not be attack traffic. The features of traffic captured and analyzed are described below.
4.1.1. Benign TCP Traffic
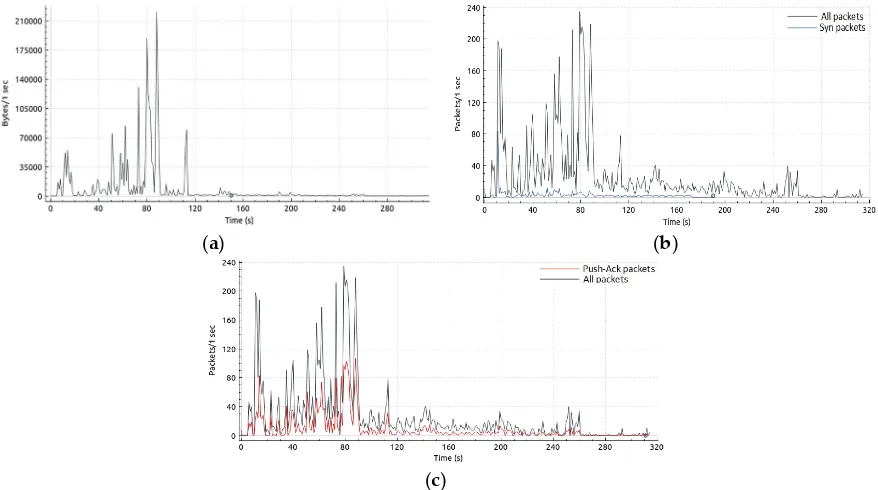
Figure3a shows a sample of benign traffic byte rate and b shows the syn packet rate to total packet rate captured from browsing several pages on the internet. Figure3c shows the Push-Ack packet rate to total packet rate. For this setup, this amount and behavior of traffic can be described as expected traffic to our network. Traffic was captured for approximately five minutes to capture a wider time window of normal behavior.
Computers 2019, 8, 85 5 of 18
4.1. Traffic Features and Types of Packet
For every attack tool studied, certain features were gathered. Packet rates, byte rates, and packet sizes can give an indication of whether traffic is benign or not. Traffic packet rate is the number of packets sent over the network channel with time. Byte rate is the volume of data sent over channel with time. Traffic containing similar sized packets will produce a similar pattern in packet rate and byte rate. This is a key indicator for TCP attacks requesting connections and closing them after connection is given without sending any data. The difference in packet rate and byte rate patterns and values can also indicate the nature of the DoS attack. Attacks with a high byte rate to packet rate ratio indicates the transfer of larger packet sizes, meaning a lot of bogus data is being transmitted. A low byte rate to packet rate ratio means smaller packet sizes are being sent, with the focused on transmitting a large number of packets with very little or no data. Packets without data normally have a size of 60 bytes or less, therefore a byte to packet rate ratio close to 60 indicates little or no data is being sent. The types of packets sent, and their contents, also provide an idea of what could be or not be attack traffic. The features of traffic captured and analyzed are described below.
4.1.1. Benign TCP Traffic
Figure 3a shows a sample of benign traffic byte rate and b shows the syn packet rate to total packet rate captured from browsing several pages on the internet. Figure 3c shows the Push-Ack packet rate to total packet rate. For this setup, this amount and behavior of traffic can be described as expected traffic to our network. Traffic was captured for approximately five minutes to capture a wider time window of normal behavior.
(a) (b)
(c)
Figure 3. (a) Benign TCP byte rate; (b) benign TCP packet and syn rate; (c) benign TCP packet and Push-Ack rate.
The byte rate indicates the amount of data in bytes sent over the channel. This translates into the bandwidth of the network channel being used. The highest recorded data rate was in the region of 220 kB/s. Traffic rate was below 10 kB/s for majority of the time. The recorded average byte rate was 8116 B/s (8 kB/s).
The packet rate indicates the rate at which traffic packets are sent across the network channel. The higher the number of packets, the more time it takes to process packets. For syn packets, a high number per second indicates a high number of connection requests from the source. Benign traffic usually contains few syn packets per second, however, attack traffic usually contains numerous syn
Figure 3. (a) Benign TCP byte rate; (b) benign TCP packet and syn rate; (c) benign TCP packet and Push-Ack rate.
The byte rate indicates the amount of data in bytes sent over the channel. This translates into the bandwidth of the network channel being used. The highest recorded data rate was in the region of 220 kB/s. Traffic rate was below 10 kB/s for majority of the time. The recorded average byte rate was 8116 B/s (8 kB/s).
Computers2019,8, 85 6 of 17
no activity over that connection. A high number of connection requests can also be observed by the number of ports used by a single source to request connections within a short period.
The average packet rate for the benign traffic captured as seen in Figure3b was 25 packets per second with the peak at 232 packets per second. The number of syn packets recorded over the entire five-minute period was also less than 300, approximately 1 per second.
Figure3c was included due to the nature of TCP traffic produced by LOIC tool. The Figure3 shows the rate of Push-Ack packets compared with total packets sent over the network. Push-Ack packets indicate payload data is being sent over the channel. TCP flooding DoS attacks are generally expected to request more connections than send actual payload data to exploit the three-way handshake. Push-Ack packets are expected to be the majority of packets in a TCP connection, indicating actual payload data is being sent as seen in Figure3c.
4.1.2. Anoncannon
Figure4a shows the traffic byte rate of Anoncannon tool. The distribution of bandwidth usage is uneven with no bandwidth used at certain times. The average byte rate recorded however was 188 kB/s, over 20 times that of benign traffic captured.
Computers 2019, 8, 85 6 of 18
packets per second. This is to exploit the nature of the TCP protocol in which a connection established is left opened for a while before being closed either by the source or the destination when there is no activity over that connection. A high number of connection requests can also be observed by the number of ports used by a single source to request connections within a short period.
The average packet rate for the benign traffic captured as seen in Figure 3b was 25 packets per second with the peak at 232 packets per second. The number of syn packets recorded over the entire five-minute period was also less than 300, approximately 1 per second.
Figure 3c was included due to the nature of TCP traffic produced by LOIC tool. The Figure shows the rate of Push-Ack packets compared with total packets sent over the network. Push-Ack packets indicate payload data is being sent over the channel. TCP flooding DoS attacks are generally expected to request more connections than send actual payload data to exploit the three-way handshake. Push-Ack packets are expected to be the majority of packets in a TCP connection, indicating actual payload data is being sent as seen in Figure 3c.
4.1.2. Anoncannon
Figure 4a shows the traffic byte rate of Anoncannon tool. The distribution of bandwidth usage is uneven with no bandwidth used at certain times. The average byte rate recorded however was 188 kB/s, over 20 times that of benign traffic captured.
(a) (b)
Figure 4. (a) Anoncannon byte rate; (b) Anoncannon packet and syn rate.
Packet rate of Anoncannon tool as seen in Figure 4b was irregular with random spikes and periods of inactivity. Syn packet rate was relatively high, with 106 syn requests recorded in the first second. Syn packet rate increased to as high as close to 2000 syn packets per second.
4.1.3. ByteDoS
Figure 5a shows the traffic byte rate of ByteDoS tool. Bandwidth use rose steadily to about 20 kB/s and hovered around the same rate with slight increases and decreases. The average byte rate recorded was 19 kB/s, which was relatively low compared to other attack tools. Packet rate of ByteDoS tool as seen in Figure 5b was relatively stable with very few deviations. Syn packet rate was also relatively stable, with an average of close to 60 syn per minute.
(a) (b)
Figure 5. (a) ByteDoS byte rate; (b) ByteDoS packet and syn rate.
Figure 4.(a) Anoncannon byte rate; (b) Anoncannon packet and syn rate.
Packet rate of Anoncannon tool as seen in Figure4b was irregular with random spikes and periods of inactivity. Syn packet rate was relatively high, with 106 syn requests recorded in the first second. Syn packet rate increased to as high as close to 2000 syn packets per second.
4.1.3. ByteDoS
Figure5a shows the traffic byte rate of ByteDoS tool. Bandwidth use rose steadily to about 20 kB/s and hovered around the same rate with slight increases and decreases. The average byte rate recorded was 19 kB/s, which was relatively low compared to other attack tools. Packet rate of ByteDoS tool as seen in Figure5b was relatively stable with very few deviations. Syn packet rate was also relatively stable, with an average of close to 60 syn per minute.
packets per second. This is to exploit the nature of the TCP protocol in which a connection established is left opened for a while before being closed either by the source or the destination when there is no activity over that connection. A high number of connection requests can also be observed by the number of ports used by a single source to request connections within a short period.
The average packet rate for the benign traffic captured as seen in Figure 3b was 25 packets per second with the peak at 232 packets per second. The number of syn packets recorded over the entire five-minute period was also less than 300, approximately 1 per second.
Figure 3c was included due to the nature of TCP traffic produced by LOIC tool. The Figure shows the rate of Push-Ack packets compared with total packets sent over the network. Push-Ack packets indicate payload data is being sent over the channel. TCP flooding DoS attacks are generally expected to request more connections than send actual payload data to exploit the three-way handshake. Push-Ack packets are expected to be the majority of packets in a TCP connection, indicating actual payload data is being sent as seen in Figure 3c.
4.1.2. Anoncannon
Figure 4a shows the traffic byte rate of Anoncannon tool. The distribution of bandwidth usage is uneven with no bandwidth used at certain times. The average byte rate recorded however was 188 kB/s, over 20 times that of benign traffic captured.
(a) (b)
Figure 4. (a) Anoncannon byte rate; (b) Anoncannon packet and syn rate.
Packet rate of Anoncannon tool as seen in Figure 4b was irregular with random spikes and periods of inactivity. Syn packet rate was relatively high, with 106 syn requests recorded in the first second. Syn packet rate increased to as high as close to 2000 syn packets per second.
4.1.3. ByteDoS
Figure 5a shows the traffic byte rate of ByteDoS tool. Bandwidth use rose steadily to about 20 kB/s and hovered around the same rate with slight increases and decreases. The average byte rate recorded was 19 kB/s, which was relatively low compared to other attack tools. Packet rate of ByteDoS tool as seen in Figure 5b was relatively stable with very few deviations. Syn packet rate was also relatively stable, with an average of close to 60 syn per minute.
(a) (b)
Computers2019,8, 85 7 of 17
4.1.4. FHRITP
Of the TCP attacks tools studied, FHRITP produced the least traffic even after multiple instances of it were run. Traffic was generated at an average of 8 kB/s, similar to benign traffic. Regular peaks were produced. It was however noticed that the tool did not always produce traffic when run. Figure6a shows the byte rate of the tool. Packet rate of FHRITP tool as seen in Figure6b was fairly constant. An average of 137 packets per second was recorded. Syn packet rate was also constant at 67 packets per second.
Computers 2019, 8, 85 7 of 18
4.1.4. FHRITP
Of the TCP attacks tools studied, FHRITP produced the least traffic even after multiple instances of it were run. Traffic was generated at an average of 8 kB/s, similar to benign traffic. Regular peaks were produced. It was however noticed that the tool did not always produce traffic when run. Figure 6a shows the byte rate of the tool. Packet rate of FHRITP tool as seen in Figure 6b was fairly constant. An average of 137 packets per second was recorded. Syn packet rate was also constant at 67 packets per second.
(a) (b)
Figure 6. (a) FHRITP byte rate; (b) FHRITP packet and syn rate.
4.1.5. HOIC
HOIC DoS attack tool produced a constant rate of traffic for about 46 s before decreasing and increasing sharply. This was as a result of the tool crashing around the forty sixth second. Figure 7a shows the traffic byte rate of HOIC tool. The average byte rate recorded was 4.8 MB/s. Total packet rate of HOIC tool was constant with the sharp decrease and increase at the end. Syn packet rate was also constant. An average of 137 packets per second was recorded. Syn packet rate was also constant at 67 packets per second. Figure 7b shows the total packet and syn packet rate.
(a) (b)
Figure 7. (a) HOIC byte rate; (b) HOIC packet and syn rate.
4.1.6. XOIC TCP
XOIC DoS attack tool produced traffic largely at a rate between 300 kB/s and 380 kB/s and 5000– 6000 packets per second. The pattern of traffic generation however was random. Syn packets were also generated at a high and fairly constant rate, mostly hovering around 1000 packets per second. Figure 8a shows the traffic byte rate of XOIC tool. The average byte rate recorded was 333 kB/s. Total packet rate and syn packet rate is shown in Figure 8b. The average packet rate recorded in the study was 5469 packets per second.
Figure 6.(a) FHRITP byte rate; (b) FHRITP packet and syn rate.
4.1.5. HOIC
HOIC DoS attack tool produced a constant rate of traffic for about 46 s before decreasing and increasing sharply. This was as a result of the tool crashing around the forty sixth second. Figure7a shows the traffic byte rate of HOIC tool. The average byte rate recorded was 4.8 MB/s. Total packet rate of HOIC tool was constant with the sharp decrease and increase at the end. Syn packet rate was also constant. An average of 137 packets per second was recorded. Syn packet rate was also constant at 67 packets per second. Figure7b shows the total packet and syn packet rate.
Computers 2019, 8, 85 7 of 18
4.1.4. FHRITP
Of the TCP attacks tools studied, FHRITP produced the least traffic even after multiple instances of it were run. Traffic was generated at an average of 8 kB/s, similar to benign traffic. Regular peaks were produced. It was however noticed that the tool did not always produce traffic when run. Figure 6a shows the byte rate of the tool. Packet rate of FHRITP tool as seen in Figure 6b was fairly constant. An average of 137 packets per second was recorded. Syn packet rate was also constant at 67 packets per second.
(a) (b)
Figure 6. (a) FHRITP byte rate; (b) FHRITP packet and syn rate.
4.1.5. HOIC
HOIC DoS attack tool produced a constant rate of traffic for about 46 s before decreasing and increasing sharply. This was as a result of the tool crashing around the forty sixth second. Figure 7a shows the traffic byte rate of HOIC tool. The average byte rate recorded was 4.8 MB/s. Total packet rate of HOIC tool was constant with the sharp decrease and increase at the end. Syn packet rate was also constant. An average of 137 packets per second was recorded. Syn packet rate was also constant at 67 packets per second. Figure 7b shows the total packet and syn packet rate.
(a) (b)
Figure 7. (a) HOIC byte rate; (b) HOIC packet and syn rate.
4.1.6. XOIC TCP
XOIC DoS attack tool produced traffic largely at a rate between 300 kB/s and 380 kB/s and 5000– 6000 packets per second. The pattern of traffic generation however was random. Syn packets were also generated at a high and fairly constant rate, mostly hovering around 1000 packets per second. Figure 8a shows the traffic byte rate of XOIC tool. The average byte rate recorded was 333 kB/s. Total packet rate and syn packet rate is shown in Figure 8b. The average packet rate recorded in the study was 5469 packets per second.
Figure 7.(a) HOIC byte rate; (b) HOIC packet and syn rate.
4.1.6. XOIC TCP
XOIC DoS attack tool produced traffic largely at a rate between 300 kB/s and 380 kB/s and 5000–6000 packets per second. The pattern of traffic generation however was random. Syn packets were also generated at a high and fairly constant rate, mostly hovering around 1000 packets per second. Figure8a shows the traffic byte rate of XOIC tool. The average byte rate recorded was 333 kB/s. Total packet rate and syn packet rate is shown in Figure8b. The average packet rate recorded in the study was 5469 packets per second.
4.1.7. Moihack TCP
Computers2019,8, 85 8 of 17
7931 packets per second. Syn packet rate was also high, averaging about 1000 syn packets per second. Figure9a shows the traffic byte rate of Moihack tool and total packet rate and syn packet rate is shown
in FigureComputers 20199b., 8, 85 8 of 18
(a) (b)
Figure 8. (a) XOIC TCP byte rate; (b) XOIC TCP packet and syn rate.
4.1.7. Moihack TCP
The Moihack tool produced traffic with no regular pattern, with very significant traffic rate changes at three points. The average byte rate recorded was 2.8 MB/s and the average packet rate was 7931 packets per second. Syn packet rate was also high, averaging about 1000 syn packets per second. Figure 9a shows the traffic byte rate of Moihack tool and total packet rate and syn packet rate is shown in Figure 9b.
(a) (b)
Figure 9. (a) Moihack TCP byte rate; (b) Moihack TCP packet and syn rate.
4.1.8. LOIC TCP
The LOIC DoS attack tool produced traffic with several spikes. A very large amount of data was transmitted over a short period of time as well. Due to this, traffic was captured for 30 s. It was noted that even though the packet rate was very high, averaging 11,829 packets per second over 30 s, the syn packet rate was extremely low, with only 32 syn packets sent to the victim. This indicated the tool was focused on sending out large volumes of data over few connections rather than opening connections and closing them without sending data or sending very little data. The Push-Ack packet rate was therefore included to compare the total packets sent with the number of data packets sent. Figure 10c shows the total packet rate and Push-Ack packet rate. The traffic byte rate is shown in Figure 10a. The average byte rate recorded was 10 MB/s. Total packet rate and syn packet rate is shown in Figure 10b.
(a) (b)
Figure 8.(a) XOIC TCP byte rate; (b) XOIC TCP packet and syn rate.
Computers 2019, 8, 85 8 of 18
(a) (b)
Figure 8. (a) XOIC TCP byte rate; (b) XOIC TCP packet and syn rate.
4.1.7. Moihack TCP
The Moihack tool produced traffic with no regular pattern, with very significant traffic rate changes at three points. The average byte rate recorded was 2.8 MB/s and the average packet rate was 7931 packets per second. Syn packet rate was also high, averaging about 1000 syn packets per second. Figure 9a shows the traffic byte rate of Moihack tool and total packet rate and syn packet rate is shown in Figure 9b.
(a) (b)
Figure 9. (a) Moihack TCP byte rate; (b) Moihack TCP packet and syn rate.
4.1.8. LOIC TCP
The LOIC DoS attack tool produced traffic with several spikes. A very large amount of data was transmitted over a short period of time as well. Due to this, traffic was captured for 30 s. It was noted that even though the packet rate was very high, averaging 11,829 packets per second over 30 s, the syn packet rate was extremely low, with only 32 syn packets sent to the victim. This indicated the tool was focused on sending out large volumes of data over few connections rather than opening connections and closing them without sending data or sending very little data. The Push-Ack packet rate was therefore included to compare the total packets sent with the number of data packets sent. Figure 10c shows the total packet rate and Push-Ack packet rate. The traffic byte rate is shown in Figure 10a. The average byte rate recorded was 10 MB/s. Total packet rate and syn packet rate is shown in Figure 10b.
(a) (b)
Figure 9.(a) Moihack TCP byte rate; (b) Moihack TCP packet and syn rate.
4.1.8. LOIC TCP
The LOIC DoS attack tool produced traffic with several spikes. A very large amount of data was transmitted over a short period of time as well. Due to this, traffic was captured for 30 s. It was noted that even though the packet rate was very high, averaging 11,829 packets per second over 30 s, the syn packet rate was extremely low, with only 32 syn packets sent to the victim. This indicated the tool was focused on sending out large volumes of data over few connections rather than opening connections and closing them without sending data or sending very little data. The Push-Ack packet rate was therefore included to compare the total packets sent with the number of data packets sent. Figure10c shows the total packet rate and Push-Ack packet rate. The traffic byte rate is shown in Figure10a. The average byte rate recorded was 10 MB/s. Total packet rate and syn packet rate is shown in Figure10b.
(a) (b)
Figure 8. (a) XOIC TCP byte rate; (b) XOIC TCP packet and syn rate.
4.1.7. Moihack TCP
The Moihack tool produced traffic with no regular pattern, with very significant traffic rate changes at three points. The average byte rate recorded was 2.8 MB/s and the average packet rate was 7931 packets per second. Syn packet rate was also high, averaging about 1000 syn packets per second. Figure 9a shows the traffic byte rate of Moihack tool and total packet rate and syn packet rate is shown in Figure 9b.
(a) (b)
Figure 9. (a) Moihack TCP byte rate; (b) Moihack TCP packet and syn rate.
4.1.8. LOIC TCP
The LOIC DoS attack tool produced traffic with several spikes. A very large amount of data was transmitted over a short period of time as well. Due to this, traffic was captured for 30 s. It was noted that even though the packet rate was very high, averaging 11,829 packets per second over 30 s, the syn packet rate was extremely low, with only 32 syn packets sent to the victim. This indicated the tool was focused on sending out large volumes of data over few connections rather than opening connections and closing them without sending data or sending very little data. The Push-Ack packet rate was therefore included to compare the total packets sent with the number of data packets sent. Figure 10c shows the total packet rate and Push-Ack packet rate. The traffic byte rate is shown in Figure 10a. The average byte rate recorded was 10 MB/s. Total packet rate and syn packet rate is shown in Figure 10b.
(a) (b)
Computers2019,8, 85 9 of 17
Computers 2019, 8, 85 9 of 18
(c)
Figure 10. (a) LOIC TCP byte rate; (b) LOIC TCP packet and syn rate; (c) LOIC TCP packet and Push-Ack rate.
4.1.9. Benign UDP Traffic
Figure 11a shows a sample of benign UDP traffic byte rate captured from browsing several pages on the internet. Figure 11b shows the packet rate. Traffic was captured for approximately five minutes. The benign packet rate was recorded at an average of 42 packets per second and byte rate had an average of 516 B/s.
(a) (b)
Figure 11. (a) Benign UDP byte rate; (b) benign UDP packet rate.
4.1.10. LOIC UDP
The LOIC tool sent packets at a very high rate, averaging 33,221 packets per second. Byte was also high at an average of 2.4 MB/s. Traffic byte rate remained above 1 MB/s for most of the period, dropping below that only once throughout the capture period. Figure 12a shows the byte rate and Figure 12b shows the packet rate.
(a) (b)
Figure 12. (a) LOIC UDP Byte rate; (b) LOIC UDP packet rate.
4.1.11 DoS Tools by Noe
This tool produced traffic packets at a very low rate, lower than benign traffic. Ten packets per second at 600 B/s was generally the baseline, rising and falling back almost immediately throughout the entire capture period. Average packet rate and byte rate recorded was 13 packets per second and 876 B/s respectively. Figure 13a shows the byte rate and Figure 13b shows the packet rate.
Figure 10. (a) LOIC TCP byte rate; (b) LOIC TCP packet and syn rate; (c) LOIC TCP packet and Push-Ack rate.
4.1.9. Benign UDP Traffic
Figure11a shows a sample of benign UDP traffic byte rate captured from browsing several pages on the internet. Figure11b shows the packet rate. Traffic was captured for approximately five minutes. The benign packet rate was recorded at an average of 42 packets per second and byte rate had an average of 516 B/s.
Computers 2019, 8, 85 9 of 18
(c)
Figure 10. (a) LOIC TCP byte rate; (b) LOIC TCP packet and syn rate; (c) LOIC TCP packet and Push-Ack rate.
4.1.9. Benign UDP Traffic
Figure 11a shows a sample of benign UDP traffic byte rate captured from browsing several pages on the internet. Figure 11b shows the packet rate. Traffic was captured for approximately five minutes. The benign packet rate was recorded at an average of 42 packets per second and byte rate had an average of 516 B/s.
(a) (b)
Figure 11. (a) Benign UDP byte rate; (b) benign UDP packet rate.
4.1.10. LOIC UDP
The LOIC tool sent packets at a very high rate, averaging 33,221 packets per second. Byte was also high at an average of 2.4 MB/s. Traffic byte rate remained above 1 MB/s for most of the period, dropping below that only once throughout the capture period. Figure 12a shows the byte rate and Figure 12b shows the packet rate.
(a) (b)
Figure 12. (a) LOIC UDP Byte rate; (b) LOIC UDP packet rate.
4.1.11 DoS Tools by Noe
This tool produced traffic packets at a very low rate, lower than benign traffic. Ten packets per second at 600 B/s was generally the baseline, rising and falling back almost immediately throughout the entire capture period. Average packet rate and byte rate recorded was 13 packets per second and 876 B/s respectively. Figure 13a shows the byte rate and Figure 13b shows the packet rate.
Figure 11.(a) Benign UDP byte rate; (b) benign UDP packet rate.
4.1.10. LOIC UDP
The LOIC tool sent packets at a very high rate, averaging 33,221 packets per second. Byte was also high at an average of 2.4 MB/s. Traffic byte rate remained above 1 MB/s for most of the period, dropping below that only once throughout the capture period. Figure12a shows the byte rate and Figure12b shows the packet rate.
Computers 2019, 8, 85 9 of 18
(c)
Figure 10. (a) LOIC TCP byte rate; (b) LOIC TCP packet and syn rate; (c) LOIC TCP packet and Push-Ack rate.
4.1.9. Benign UDP Traffic
Figure 11a shows a sample of benign UDP traffic byte rate captured from browsing several pages on the internet. Figure 11b shows the packet rate. Traffic was captured for approximately five minutes. The benign packet rate was recorded at an average of 42 packets per second and byte rate had an average of 516 B/s.
(a) (b)
Figure 11. (a) Benign UDP byte rate; (b) benign UDP packet rate.
4.1.10. LOIC UDP
The LOIC tool sent packets at a very high rate, averaging 33,221 packets per second. Byte was also high at an average of 2.4 MB/s. Traffic byte rate remained above 1 MB/s for most of the period, dropping below that only once throughout the capture period. Figure 12a shows the byte rate and Figure 12b shows the packet rate.
(a) (b)
Figure 12. (a) LOIC UDP Byte rate; (b) LOIC UDP packet rate.
4.1.11 DoS Tools by Noe
This tool produced traffic packets at a very low rate, lower than benign traffic. Ten packets per second at 600 B/s was generally the baseline, rising and falling back almost immediately throughout the entire capture period. Average packet rate and byte rate recorded was 13 packets per second and 876 B/s respectively. Figure 13a shows the byte rate and Figure 13b shows the packet rate.
Figure 12.(a) LOIC UDP Byte rate; (b) LOIC UDP packet rate.
4.1.11. DoS Tools by Noe
Computers 2019, 8, 85 10 of 18
(a) (b)
Figure 13. (a) Denial of service (DoS) tools by Noe UDP byte rate; (b) Figure 4.24 DoS tools by Noe UDP packet rate.
4.1.12. Moihack UDP
The Moihack tool generated some huge sized packets which had to be fragmented. Packet fragmentation is used by some DoS attacks to force the victim to use resources when reassembling packets. The Moihack tool fragmented its packets into two or three during the capture period. Average traffic rates were recorded at 3.6 MB/s and 3093 packets per second. Figure 14a shows the byte rate and Figure 14b shows the packet rate.
(a) (b)
Figure 14. (a) Moihack UDP byte rate; (b) Moihack UDP packet rate.
4.1.13. XOIC UDP
The XOIC tool rose above 4000 packets per second and 240 kB/s and stayed there for the entire capture period, dropping below that and rising immediately just once. Average byte rate was recorded at 267 kB/s and packet rate at 4451 packets per second. Figure 15a shows the byte rate and Figure 15b shows the packet rate.
(a) (b)
Figure 15. (a) XOIC UDP byte rate; (b) XOIC UDP packet rate.
4.1.14. Benign ICMP Traffic
Figure 16a shows a sample of benign ICMP traffic byte rate captured during a ping session. Figure 16b shows the packet rate. Traffic was captured for approximately four and a half minutes. The benign packet rate was recorded at an average of 1563 packets per second and byte rate recorded an average of 79 kB/s.
Figure 13. (a) Denial of service (DoS) tools by Noe UDP byte rate; (b). 24 DoS tools by Noe UDP packet rate.
4.1.12. Moihack UDP
The Moihack tool generated some huge sized packets which had to be fragmented. Packet fragmentation is used by some DoS attacks to force the victim to use resources when reassembling packets. The Moihack tool fragmented its packets into two or three during the capture period. Average traffic rates were recorded at 3.6 MB/s and 3093 packets per second. Figure14a shows the byte rate and Figure14b shows the packet rate.
Computers 2019, 8, 85 10 of 18
(a) (b)
Figure 13. (a) Denial of service (DoS) tools by Noe UDP byte rate; (b) Figure 4.24 DoS tools by Noe UDP packet rate.
4.1.12. Moihack UDP
The Moihack tool generated some huge sized packets which had to be fragmented. Packet fragmentation is used by some DoS attacks to force the victim to use resources when reassembling packets. The Moihack tool fragmented its packets into two or three during the capture period. Average traffic rates were recorded at 3.6 MB/s and 3093 packets per second. Figure 14a shows the byte rate and Figure 14b shows the packet rate.
(a) (b)
Figure 14. (a) Moihack UDP byte rate; (b) Moihack UDP packet rate.
4.1.13. XOIC UDP
The XOIC tool rose above 4000 packets per second and 240 kB/s and stayed there for the entire capture period, dropping below that and rising immediately just once. Average byte rate was recorded at 267 kB/s and packet rate at 4451 packets per second. Figure 15a shows the byte rate and Figure 15b shows the packet rate.
(a) (b)
Figure 15. (a) XOIC UDP byte rate; (b) XOIC UDP packet rate.
4.1.14. Benign ICMP Traffic
Figure 16a shows a sample of benign ICMP traffic byte rate captured during a ping session. Figure 16b shows the packet rate. Traffic was captured for approximately four and a half minutes. The benign packet rate was recorded at an average of 1563 packets per second and byte rate recorded an average of 79 kB/s.
Figure 14.(a) Moihack UDP byte rate; (b) Moihack UDP packet rate.
4.1.13. XOIC UDP
The XOIC tool rose above 4000 packets per second and 240 kB/s and stayed there for the entire capture period, dropping below that and rising immediately just once. Average byte rate was recorded at 267 kB/s and packet rate at 4451 packets per second. Figure15a shows the byte rate and Figure15b shows the packet rate.
Computers 2019, 8, 85 10 of 18
(a) (b)
Figure 13. (a) Denial of service (DoS) tools by Noe UDP byte rate; (b) Figure 4.24 DoS tools by Noe UDP packet rate.
4.1.12. Moihack UDP
The Moihack tool generated some huge sized packets which had to be fragmented. Packet fragmentation is used by some DoS attacks to force the victim to use resources when reassembling packets. The Moihack tool fragmented its packets into two or three during the capture period. Average traffic rates were recorded at 3.6 MB/s and 3093 packets per second. Figure 14a shows the byte rate and Figure 14b shows the packet rate.
(a) (b)
Figure 14. (a) Moihack UDP byte rate; (b) Moihack UDP packet rate.
4.1.13. XOIC UDP
The XOIC tool rose above 4000 packets per second and 240 kB/s and stayed there for the entire capture period, dropping below that and rising immediately just once. Average byte rate was recorded at 267 kB/s and packet rate at 4451 packets per second. Figure 15a shows the byte rate and Figure 15b shows the packet rate.
(a) (b)
Figure 15. (a) XOIC UDP byte rate; (b) XOIC UDP packet rate.
4.1.14. Benign ICMP Traffic
Figure 16a shows a sample of benign ICMP traffic byte rate captured during a ping session. Figure 16b shows the packet rate. Traffic was captured for approximately four and a half minutes. The benign packet rate was recorded at an average of 1563 packets per second and byte rate recorded an average of 79 kB/s.
Figure 15.(a) XOIC UDP byte rate; (b) XOIC UDP packet rate.
4.1.14. Benign ICMP Traffic
Computers2019,8, 85 11 of 17
Computers 2019, 8, 85 11 of 18
(a) (b)
Figure 16. (a) Benign ICMP byte rate; (b) Benign ICMP packet rate.
4.1.15. XOIC ICMP
The XOIC tool generated packets at an average rate of 4655 packets per second and an average byte rate of 237 kB/s. For most part of the capture period, traffic was above 210 kB/s and 4200 packets per second with only one noticeably sharp drop, which normalized almost immediately. Figure 17a shows the byte rate and Figure 17b shows the packet rate of the XOIC DoS tool.
(a) (b)
Figure 17. (a) XOIC ICMP byte rate; (b) XOIC ICMP byte rate.
Table 2 is a summary of the attack characteristics realized. Other notable characteristics of traffic produced by the tools are noted in the table.
Table 2. Summary of attack characteristics.
Attack tool Avg. Packet Rate Avg. Byte Rate Avg. Packet Size (Byte) Comments Anoncannon
TCP 1700.2 188 k 111
Connection request rate unpredictable. Sends one instance of message string several
times per connection granted ByteDoS TCP 315.9 19 k 61 Requests for connections and closes without
sending any data
FHRITP TCP 136.9 8282 60 Requests for connections and closes without sending any data
HOIC TCP 1703.1 307 k 180
Open connections and requests default Apache web page
Sends no data
XOIC TCP 5469.2 333 k 61 Requests for connections and closes without sending any data
LOIC TCP 11,829.9 10 M 914
Requests very few connections Sends large number of packets with message repeated in packets a random number of times
per connection granted
Moihack TCP 7931 2889 k 364 Sends multiple packets with symbols, characters and numbers.
Figure 16.(a) Benign ICMP byte rate; (b) Benign ICMP packet rate.
4.1.15. XOIC ICMP
The XOIC tool generated packets at an average rate of 4655 packets per second and an average byte rate of 237 kB/s. For most part of the capture period, traffic was above 210 kB/s and 4200 packets per second with only one noticeably sharp drop, which normalized almost immediately. Figure17a shows the byte rate and Figure17b shows the packet rate of the XOIC DoS tool.
Computers 2019, 8, 85 11 of 18
(a) (b)
Figure 16. (a) Benign ICMP byte rate; (b) Benign ICMP packet rate.
4.1.15. XOIC ICMP
The XOIC tool generated packets at an average rate of 4655 packets per second and an average byte rate of 237 kB/s. For most part of the capture period, traffic was above 210 kB/s and 4200 packets per second with only one noticeably sharp drop, which normalized almost immediately. Figure 17a shows the byte rate and Figure 17b shows the packet rate of the XOIC DoS tool.
(a) (b)
Figure 17. (a) XOIC ICMP byte rate; (b) XOIC ICMP byte rate.
Table 2 is a summary of the attack characteristics realized. Other notable characteristics of traffic produced by the tools are noted in the table.
Table 2. Summary of attack characteristics.
Attack tool Avg. Packet Rate Avg. Byte Rate Avg. Packet Size (Byte) Comments Anoncannon
TCP 1700.2 188 k 111
Connection request rate unpredictable. Sends one instance of message string several
times per connection granted ByteDoS TCP 315.9 19 k 61 Requests for connections and closes without
sending any data
FHRITP TCP 136.9 8282 60 Requests for connections and closes without sending any data
HOIC TCP 1703.1 307 k 180
Open connections and requests default Apache web page
Sends no data
XOIC TCP 5469.2 333 k 61 Requests for connections and closes without sending any data
LOIC TCP 11,829.9 10 M 914
Requests very few connections Sends large number of packets with message repeated in packets a random number of times
per connection granted
Moihack TCP 7931 2889 k 364 Sends multiple packets with symbols, characters and numbers.
Figure 17.(a) XOIC ICMP byte rate; (b) XOIC ICMP byte rate.
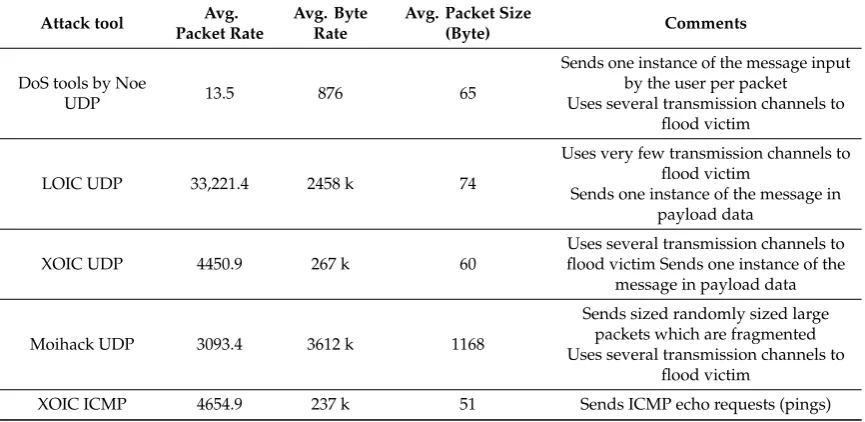
Table2is a summary of the attack characteristics realized. Other notable characteristics of traffic produced by the tools are noted in the table.
Table 2.Summary of attack characteristics.
Attack tool Avg. Packet Rate
Avg. Byte Rate
Avg. Packet Size
(Byte) Comments
Anoncannon TCP 1700.2 188 k 111
Connection request rate unpredictable. Sends one instance of message string several times per connection granted
ByteDoS TCP 315.9 19 k 61 Requests for connections and closes
without sending any data
FHRITP TCP 136.9 8282 60 Requests for connections and closes
without sending any data
HOIC TCP 1703.1 307 k 180
Open connections and requests default Apache web page
Sends no data
XOIC TCP 5469.2 333 k 61 Requests for connections and closes
without sending any data
LOIC TCP 11,829.9 10 M 914
Requests very few connections Sends large number of packets with message repeated in packets a random number of times per connection granted
Moihack TCP 7931 2889 k 364 Sends multiple packets with symbols,
Table 2.Cont.
Attack tool Avg. Packet Rate
Avg. Byte Rate
Avg. Packet Size
(Byte) Comments
DoS tools by Noe
UDP 13.5 876 65
Sends one instance of the message input by the user per packet Uses several transmission channels to
flood victim
LOIC UDP 33,221.4 2458 k 74
Uses very few transmission channels to flood victim
Sends one instance of the message in payload data
XOIC UDP 4450.9 267 k 60
Uses several transmission channels to flood victim Sends one instance of the
message in payload data
Moihack UDP 3093.4 3612 k 1168
Sends sized randomly sized large packets which are fragmented Uses several transmission channels to
flood victim
XOIC ICMP 4654.9 237 k 51 Sends ICMP echo requests (pings)
4.2. Discussion of Attack Features
After analyzing traffic generated by the attack tools, it was realized that DoS attack traffic are increasingly becoming similar to benign traffic in terms of packet structure. Malformed packets were not sent by any of the tools. The differences between TCP attack and benign traffic mostly was the number of connection requests. Attack traffic generally used several ports to request connections simultaneously. Normal TCP operations requests just one or very few connections for data transfer. Benign traffic captured had several but few connection requests, however, even those connection requests involved different IP addresses. LOIC TCP tool on the other hand was the only tool to request few connections. It focused on sending a lot of data over the few connections established to mimic benign traffic, making it nearly impossible to detect with the number of requests. The difference in volume of data transmitted was therefore used in detection. All the tools had a quite steady connection request rate except for the Anoncannon tool. This tool had a random connection request rate, requesting packets without any pattern. LOIC TCP had the highest bandwidth consumption at 10 MB/s. All tools had the Don’t fragment bit set in their packets, however, some benign packets were also noticed to have this bit set. All ports used by the attack tools were ephemeral ports.
UDP attack traffic had no significant packet difference compared with the benign packets. The difference was in the number rate of packets being sent and number of ports used in sending the packets, which was a lot compared to benign traffic, indicating the number of transmission channels used in flooding the victim. The LOIC UDP tool however, used very few ports, just like with its TCP attack. It was also noticed that the UDP tools focused on sending smaller sized packets.
The XOIC ICMP tool sent many ICMP echo requests, more than what is sent in a normal ping session. The Don’t fragment bit was also set, same as that of benign traffic.
4.3. Proposed Algorithm
Based on the differences noticed between the attack traffic and benign traffic, an algorithm was proposed. The algorithm incorporates detection for TCP, UDP, and ICMP DoS attacks. The algorithm begins by monitoring the network channel for activity. If there is activity, the protocol of traffic is checked. Depending on the protocol of traffic detected, the portion of the algorithm for that protocol is run. Algorithm 1 shows the detection algorithm for ICMP traffic.
Computers2019,8, 85 13 of 17
is to ensure traffic matches exactly what is intended to be detected, to prevent processing of packets which may have some of these characteristics. If the conditions of the checks are met, the source IP address is checked and monitored for the number of packets it will send within the period T seconds. If the number of packets exceed the threshold number of packets expected within the time frame, an alert is given of an attack.
Algorithm 1.ICMP Attack detection Algorithm.
1 Monitor network channel for traffic activity 2 For (channel activity)
3 Determine traffic protocol 4 If(Traffic protocol==ICMP)
5 Check ICMP Type field 6 Check ICMP Code value 7 Check fragment bits in IP header
8 If(ICMP type==8 && ICMP code==0 && Fragment bit==0x4000) 9 Check source IP address
10 Check number of packets sent in time T seconds 11 If(number of packets sent>=threshold)
12 Alert ICMP flood attack
13 Elsego to 1
14 Elsego to 1
For UDP traffic, the port number is checked to ensure it is an ephemeral port. The fragment bit in the IP header is then checked. If the More fragments bit is set (0x2000), it is further checked to see if it is the first fragment, which has a fragment offset set to 0. This is to ensure only the first packet in a series of fragmented packets is counted. If the More fragments and fragment offset is passed, the process moves to check the IP address of the source and monitors for the number of fragmented packets with offset set to 0 it sends within the period T seconds. If the More fragments condition fails, the process moves straight to check the IP address of the source and monitors for the number of packets it sends within the period T seconds. If the number of packets exceed the threshold number of packets expected within the time frame, an alert is given of an attack. The algorithm is shown in Algorithm 2.
Algorithm 2.UDP Attack detection Algorithm.
15 Else If(Traffic protocol==UDP)
16 Check port number 17 If(Port>1025)
18 Check fragment bits in IP header 19 If(fragment bit==0x2000)
20 Check fragment offset 21 If(fragment offset==0)
22 go to 26
23 else
24 go to 1
25 else
26 Check source IP address
27 Check number of packets sent in time T seconds 28 If(number of packets sent>=threshold)
29 Alert UDP flood attack
30 Elsego to 1
For TCP traffic, the port number is checked to ensure it is an ephemeral port. The fragment bit in the IP header is then checked and the TCP flags are checked. If the fragment bit is set to Don’t fragment (0x4000) and the TCP flags is set to Syn (0x002) or Push-Ack (0x018), the IP address of the source is checked and monitored for the number of packets it sends within the period T seconds. If the number of packets exceed the threshold number of packets expected within the time frame, an alert is given of an attack. The algorithm is shown in Algorithm 3.
Algorithm 3.TCP Attack detection Algorithm.
24 Else If(Traffic protocol==TCP)
25 Check Port number
26 Check Fragment bit in IP header 27 Check TCP flags
28 If(Port>1025 && Fragment bit==0x4000 && TCP flag==0x002||0x018)
29 Check source IP address
30 Check number of packets sent in time T seconds 31 If(number of packets sent>=threshold)
32 Alert TCP flood attack
33 Elsego to 1
34 Elsego to 1
35 Elsego to 1
4.4. Evaluation of Algorithm
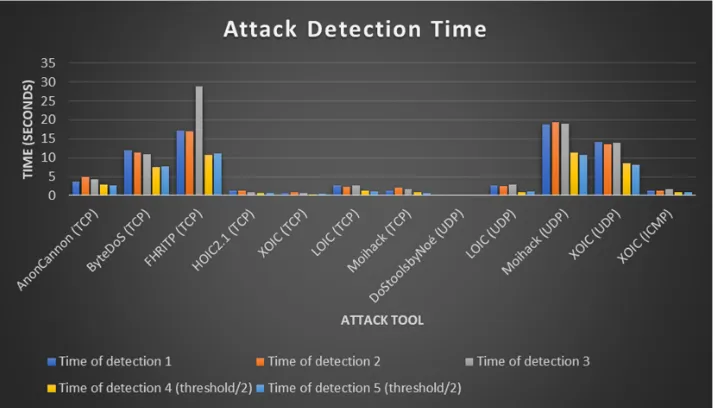
Snort IDS was used to test the algorithm. The detection rules written based on the algorithm were implemented and tested five times for each DoS attack to have a good idea of how fast detection of an attack was. The detection times are shown in Figure18. Benign traffic was generated in the background determine false positive occurrences. The time (T) was set at 60 s. For ICMP traffic, the threshold number of packets was set at 6000 packets. For UDP traffic, the threshold was set at 60, 000 packets for unfragmented traffic and 20,000 packets for fragmented traffic. For TCP traffic, the threshold for Syn packets was set at 600 packets and 30,000 for Push-Ack packets. The thresholds were chosen to incorporate worst-case scenarios whilst using the victim machine for network access. After the first three tests, the final two tests were done using thresholds reduced to half the initial values to reduce the detection times and test for false positives. The detection method was compared with other detection methods proposed in literatureComputers 2019, 8, 85 15 of 18
Figure 17. Attack detection times.
ByteDoS and FHRITP tools had high detection times due to the low rate of traffic produced by these tools. The highest recorded TCP attack detection time was 28.9 s with the FHRITP tool. This was most likely as a result of the tool not producing traffic for some periods of time after it was launched. This bug was encountered several times when testing this tool.
The LOIC UDP was detected consistently under five seconds. However, the Moihack and XOIC attacks were detected between ten and twenty seconds for most of the period. This was due to the huge difference in attack packets sent by the LOIC tool and the other tools for UDP attacks. DoS tools by Noe was never detected during the attack due to the very low rate at which it sends packets and therefore will not be capable of launching a disruptive DoS attack alone.
The ICMP attack was also detected under five seconds. The benign ICMP traffic was also detected around the around seven seconds. Pinging sessions are used to determine if a server or machine has connection to the network. Since it carries no important message, dropping even benign ping packets after a period helps prevent unnecessary use of network bandwidth. Due to this, ICMP traffic was not included in finding the false positive rates.
Reducing the detection times is possible by reducing the threshold further. Reducing it too much, however, could cause a rise in false positives, where benign traffic is wrongly flagged as attack traffic. The threshold therefore should be selected to ensure a fast detection time whilst minimizing the false positive rates.
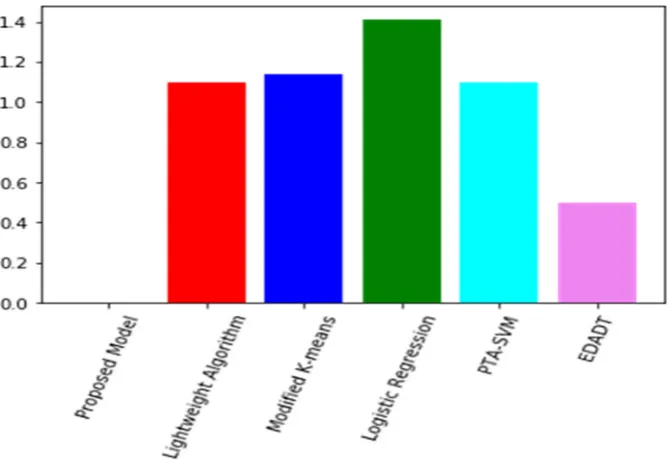
False positive rates were compared with the Packet Threshold Algorithm-Support Vector Machine (PTA-SVM) model proposed by [18], Efficient Data Adapted Decision Tree (EDADT) proposed by [19], Lightweight detection algorithm proposed by [20], Modified K-means proposed by [21], and a logistic regression model proposed by [22]. The false positive rate for the proposed model was 0, outperforming the algorithms it was compared with, as shown in Figure 18.
Computers2019,8, 85 15 of 17
4.5. Test Results and Discussion
The detection times during the runtimes of the algorithm and attack tools is shown in Figure18. Early detection of DoS attacks ensures they are stopped before causing a lot of damage. Of the seven TCP attacks tested, five were consistently detected under five seconds.
ByteDoS and FHRITP tools had high detection times due to the low rate of traffic produced by these tools. The highest recorded TCP attack detection time was 28.9 s with the FHRITP tool. This was most likely as a result of the tool not producing traffic for some periods of time after it was launched. This bug was encountered several times when testing this tool.
The LOIC UDP was detected consistently under five seconds. However, the Moihack and XOIC attacks were detected between ten and twenty seconds for most of the period. This was due to the huge difference in attack packets sent by the LOIC tool and the other tools for UDP attacks. DoS tools by Noe was never detected during the attack due to the very low rate at which it sends packets and therefore will not be capable of launching a disruptive DoS attack alone.
The ICMP attack was also detected under five seconds. The benign ICMP traffic was also detected around the around seven seconds. Pinging sessions are used to determine if a server or machine has connection to the network. Since it carries no important message, dropping even benign ping packets after a period helps prevent unnecessary use of network bandwidth. Due to this, ICMP traffic was not included in finding the false positive rates.
Reducing the detection times is possible by reducing the threshold further. Reducing it too much, however, could cause a rise in false positives, where benign traffic is wrongly flagged as attack traffic. The threshold therefore should be selected to ensure a fast detection time whilst minimizing the false positive rates.
False positive rates were compared with the Packet Threshold Algorithm-Support Vector Machine (PTA-SVM) model proposed by [18], Efficient Data Adapted Decision Tree (EDADT) proposed by [19], Lightweight detection algorithm proposed by [20], Modified K-means proposed by [21], and a logistic regression model proposed by [22]. The false positive rate for the proposed model was 0, outperforming the algorithms it was compared with, as shown in FigureComputers 2019, 8, 85 19. 16 of 18
Figure 18. False positive rates. PVA-SVM: Packet Threshold Algorithm-Support Vector Machine; EDAET: Efficient Data Adapted Decision Tree.
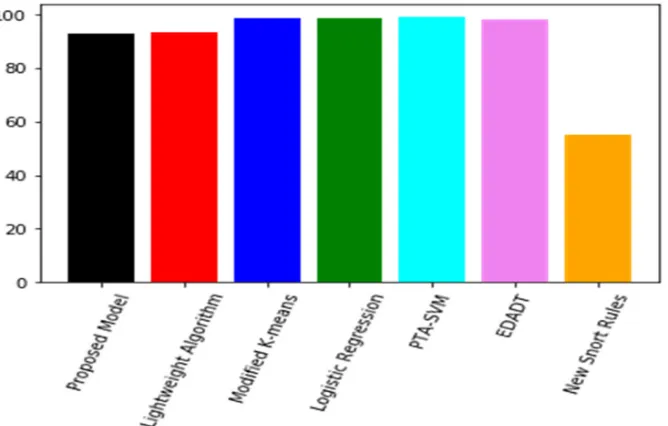
New snort rules proposed by [7] was included in the detection accuracy comparison. The detection accuracy however was realized to be 92%, outperforming the model proposed by [7], and a little lower than most of the other algorithms as seen in Figure 19. This was due to the inability of the algorithm to detect the very low rate attack by the Noe DoS tool. The proposed model however was able to detect attacks from the other tools throughout the entire period of testing.
Figure 19. Detection accuracy.
5. Conclusions
Development of simple to use DoS tools has made it possible for even unskilled users to launch DoS attacks. Though these tools have been around for some years, there has been no defense mechanism designed specifically to defend against attacks from these tools.
Figure 19. False positive rates. PVA-SVM: Packet Threshold Algorithm-Support Vector Machine; EDAET: Efficient Data Adapted Decision Tree.
Computers2019,8, 85 16 of 17
than most of the other algorithms as seen in Figure20. This was due to the inability of the algorithm to detect the very low rate attack by the Noe DoS tool. The proposed model however was able to detect attacks from the other tools throughout the entire period of testing.
Figure 18. False positive rates. PVA-SVM: Packet Threshold Algorithm-Support Vector Machine; EDAET: Efficient Data Adapted Decision Tree.
New snort rules proposed by [7] was included in the detection accuracy comparison. The detection accuracy however was realized to be 92%, outperforming the model proposed by [7], and a little lower than most of the other algorithms as seen in Figure 19. This was due to the inability of the algorithm to detect the very low rate attack by the Noe DoS tool. The proposed model however was able to detect attacks from the other tools throughout the entire period of testing.
Figure 19. Detection accuracy.
5. Conclusions
Development of simple to use DoS tools has made it possible for even unskilled users to launch DoS attacks. Though these tools have been around for some years, there has been no defense mechanism designed specifically to defend against attacks from these tools.
Figure 20.Detection accuracy.
5. Conclusions
Development of simple to use DoS tools has made it possible for even unskilled users to launch DoS attacks. Though these tools have been around for some years, there has been no defense mechanism designed specifically to defend against attacks from these tools.
In this paper, we captured and analyzed traffic from eight DoS tools. The DoS tools used as part of the study produced either TCP, UDP, or ICMP traffic. We further proposed a signature-based algorithm to detect attacks from these DoS attack tools. Our proposed detection scheme was designed based on traffic properties identified from analyzing traffic produced by the attack tools used in this study. We tested the proposed algorithm with Snort IDS and presented the results as well as a comparison with some existing DoS detection schemes. The proposed scheme performed with high detection accuracy, low false positive rate and fast detection time.
Author Contributions: Conceptualization, K.S.D. and T.E.T.; methodology, K.S.D. and T.E.T.; formal analysis, K.S.D., T.E.T. and G.J.D.; writing—original draft preparation, K.S.D.; writing—review and editing, K.S.D., T.E.T. and G.J.D.; supervision, T.E.T. and G.J.D.
Funding:This research received no external funding.
Acknowledgments: Authors would like to acknowledge the efforts of Dr. Jerry John Kponyo, the Dean of the Faculty of Electrical and Computer Engineering, KNUST, in helping to mobilize resources from the KNUST-MTN Innovation fund to help pay for the article processing charge.
Conflicts of Interest:The authors declare no conflict of interest.
References
1. Bijalwan, A.; Wazid, M.; Pilli, E.S.; Joshi, R.; Joshi, C. Forensics of Random-UDP Flooding Attacks.J. Netw.
2015,10, 287–293. [CrossRef]
2. Kolahi, S.; Treseangrat, K.; Sarrafpour, B. Analysis of UDP DDoS flood cyber attack and defense mechanisms on Web Server with Linux Ubuntu 13. In Proceedings of the 2015 International Conference on Communications, Signal Processing, and their Applications (ICCSPA’15), Sharjah, UAE, 17–19 February 2015.