Poultry Science Journal
ISSN: 2345-6604 (Print), 2345-6566 (Online)
http://psj.gau.ac.ir
Effect of Phytase Superdoses and Citric Acid on Growth
Performance, Plasma Phosphorus and Tibia Ash in Broilers Fed
Canola Meal-Based Diets Severely Limited in Available Phosphorus
Taheri HR & Taherkhani S
Department of Animal Science, Faculty of Agriculture, University of Zanjan, Zanjan, Iran.
Poultry Science Journal 2015, 3 (1): 27-36
Please cite this article as:Taheri HR & Taherkhani S. 2015. Effect of phytase superdoses and citric acid on growth performance, plasma phosphorus and tibia ash in broilers fed canola meal-based diets severely limited in available phosphorus. Poult. Sci. J. 3 (1): 27-36.
© 2015 PSJ. All Rights Reserved
Abstract
Article history:
Received: September 29, 2014 Revised: January 29, 2015 Accepted: March 6, 2015
This experiment was conducted to investigate the effect of phytase superdoses alone or in combination with citric acid (CA) in canola meal-based diets severely limited in available phosphorus (Pa) on growth performance, plasma phosphorus (P), and tibia ash (TA) in broilers from 22 to 42 d of age. Two hundreds and eighty 21-d-old male broilers were used in 28 pens of 10 birds per each. The experimental diets consisted of a positive control (PC) diet and six negative control (NC) diets which consisted of two levels of CA (0 and 20 g/Kg) and three levels of phytase (0, 1000 and 4000 U/Kg) in a 2 × 3 factorial arrangement. The PC diet contained 4.3 g/Kg Pa, but all NC diets contained 1.5 g/Kg Pa. Results indicated that the birds fed the PC diet had a significantly higher average daily gain (ADG), plasma P and TA, but a lower feed conversion ratio (FCR) than those fed the NC diet. The ADG, FCR and plasma P values in birds fed NC diets supplemented with 4000 U/Kg phytase enzyme (with or without CA) significantly reached those of birds fed the PC diet. But, addition of phytase enzyme at 1000 U/Kg only plus CA to the NC diet could significantly improve FCR and plasma P. A significant interaction was observed between phytase and CA for FCR and plasma P. Although TA values in NC + 1000 U/Kg phytase treatments (with or without CA) were similar to the PC treatment, TA values of NC + 4000 U/Kg phytase treatments (with or without CA) was greater than that of the PC treatment. Results of this study showed that, in severely limited Pa corn-canola meal-based diets, supplementing 4000 U/Kg phytase or also 1000 U/Kg phytase plus CA will be sufficient to obtain the comparable feed efficiency in broilers to those fed the adequate Pa diet.
Corresponding author: Hamid Reza Taheri, Ph.D [email protected] [email protected]
Keywords:
Introduction
Approximately two-third of P in feedstuffs of plant origin presents in the form of phytate which is poorly digested by endogenous enzymes of monogastric animals. Consequently, inorganic sources of P, which are expensive, are supplemented to the diets to meet P needs for poultry. Additionally, phytate decreases nutrient digestibility and is excreted to environment, leading to environmental pollution. The negative effects of phytate on nutrients utilization can be partly ameliorated by exogenous phytase, which degrades phytate (Selle and Ravindran, 2007). Phytase increases P digestibility and utilization and hence reduces P excretion into the environment (Shirley and Edwards, 2003). The standard use of exogenous phytase as a source of dietary P often limits its
inclusion in broiler diets to approximately 500 U/Kg. Obviously, P is not
completely removed from phytate by phytase supplementation to poultry diets (Olukosi et al., 2007; Woyengo et al., 2008).
Several methods including dietary supplementation with phytase superdoses and citric acid (CA), which has a potential to increase the release of P from phytate, have been investigated. It has been shown that CA improves the efficiency of microbial phytase, because it can chelate cations like Ca and Mg that form insoluble complexes with phytate, thereby increasing phytate solubility (Maenz et
al., 1999). CA reduces the pH of the digesta (Radcliffe et al., 1998), which then
increases the dissociation between phytate and minerals (Maenz et al., 1999) and enhances the activity of phytase, which expresses its optimal activity at a low pH (Simon and Igbasan, 2002). The improvement of P utilization in broilers due to addition of CA to a phytase-supplemented corn-soybean meal-based diet has been reported in the literature (Snow et al., 2004; Woyengo et al., 2010).
For increasing the release of P from phytate, many studies have focused on the use of phytase superdoses in soybean meal-based diets limited in available P up to 1000 (Dilger et al., 2004; Jendza et al., 2006; Liu et al., 2008, 2010), 1500 (Walk et al., 2013, 2014), 2000 (Shaw et al., 2011; Rutherfurd et al., 2012; Gehring et al., 2013 ); 2500 (Zhang et al., 2000; Pirgozliev et al., 2007, 2008, 2009; Walk et al., 2012; Pirgozliev and Bedford, 2013;), 4000 (Han et al., 2009) or 12000 (Shirley and Edwards, 2003) U/Kg. It seems that addition of phytase at 6000 (Shirley and Edwards, 2003) or 4000 (Taheri et al., 2015) U/Kg of the diet severely limited in available phosphorus improves growth performance of the birds to the similar extent to those fed the control. However, high levels of phytase may not be always cost effective. On the other hand, based on our information, there is a lack of information of phytase superdoses in canola-meal-based diets limited in available P.
detecting more improvement in performance of broilers at phytase doses lower than 4000 U/Kg of the diet. There is a lack of information regarding phytase superdoses in canola-meal-based diets limited in available P. In addition, there is a lack of information on the effect of supplementing a combination of phytase superdoses and CA to a diet limited in available P on the performance of poultry.
Therefore, in the present study, the effect of phytase supplementation alone or in combination with CA in corn-canola meal-based diets contained insufficient Pa was evaluated compared with a control diet containing sufficient Pa in broilers from 22 to 42 d post hatch.
Materials and Methods
Birds, husbandry and experimental diets
Two hundred eighty 21-d-old Ross 308 male broilers were distributed into 28 pens and reared from 22 to 42 d of age. All birds received a regular diet containing 5.0 and 4.5 g/Kg Pa, respectively, from 1-10 and 11-21 d of age. Mean body weight of the birds in all pens was similar (750 ± 15 g) at the beginning of the experiment (22 d of age). Each treatment had 4 replicates of 10 broilers each. Birds were reared in floor pens (1.5 × 1.5 m) and in an environmentally controlled house and they were exposed to a 23L:1D lighting cycle. The experimental birds were given ad
libitum access to water and mash diets.
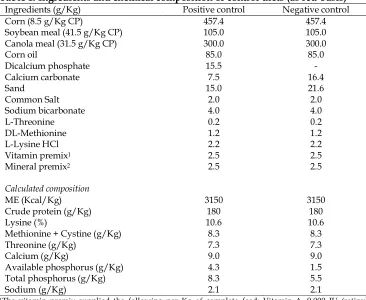
The National Research Council’s nutrient values for ingredients (NRC, 1994) were used to formulate the diets with the exception of CP. Since the CP values of the ingredients can be variables, therefore, it was analyzed for corn, soybean meal and canola meal, and the amino acids compositions of these ingredients were calculated based on equations (NRC, 1994). Two corn-canola meal-based diets were formulated to meet Ross 308 broiler nutrient requirements with an adequate (positive control, PC) or inadequate (negative control, NC) quantity of Pa from 22 to 42 d of age (Aviagen, 2009; Table 1). The NC diet was supplemented with two levels of CA (0 and 20 g/Kg) and three levels of phytase (0, 1000 and 4000 U/Kg) in a 2 × 3 factorial arrangement making six diets. All six diets were kept at a Pa level of 1.5 g/Kg. In addition, the PC diet was composed of 4.3 g/Kg Pa. The supplemental phytase was a commercially available Natuphos phytase (BASF, Mt. Olive, NJ) that was derived from Aspergillus niger and had an enzyme activity of 1,000 U/g phytase.
Sample collection
spectrophotometer following the instructions of corresponding reagent kits (Pars Azmoon, Iran).
On d 42, one bird/pen (four birds/treatment) was randomly slaughtered to obtain the tibia samples. Soft tissue was stripped off the bone, and the tibias were dried overnight at 100°C, extracted in ether for 6 h, and ashed in a muffle furnace for 15 h at 540°C. Tibia ash (TA) percentage was calculated as: [tibia ash weight/dry defatted tibia weight] × 100.
Table 1. Ingredients and chemical composition of control diets (as fed-basis)
Ingredients (g/Kg) Positive control Negative control
Corn (8.5 g/Kg CP) 457.4 457.4
Soybean meal (41.5 g/Kg CP) 105.0 105.0
Canola meal (31.5 g/Kg CP) 300.0 300.0
Corn oil 85.0 85.0
Dicalcium phosphate 15.5 -
Calcium carbonate 7.5 16.4
Sand 15.0 21.6
Common Salt 2.0 2.0
Sodium bicarbonate 4.0 4.0
L-Threonine 0.2 0.2
DL-Methionine 1.2 1.2
L-Lysine HCl 2.2 2.2
Vitamin premix1 2.5 2.5
Mineral premix2 2.5 2.5
Calculated composition
ME (Kcal/Kg) 3150 3150
Crude protein (g/Kg) 180 180
Lysine (%) 10.6 10.6
Methionine + Cystine (g/Kg) 8.3 8.3
Threonine (g/Kg) 7.3 7.3
Calcium (g/Kg) 9.0 9.0
Available phosphorus (g/Kg) 4.3 1.5
Total phosphorus (g/Kg) 8.3 5.5
Sodium (g/Kg) 2.1 2.1
1The vitamin premix supplied the following per Kg of complete feed: Vitamin A, 9,000 IU (retinyl
acetate); Cholecalciferol, 2,000 IU; Vitamin E, 18 IU (dl-α-tocopheryl acetate); Vitamin B12, 0.015 mg; Menadione, 2 mg; Riboflavin, 6.6 mg; Thiamine, 1.8 mg; Pantothenic acid, 30 mg; Niacin, 10 mg; Choline, 500 mg; Folic acid, 1 mg; Biotin, 0.1 mg; Pyridoxine, 3 mg.
2The mineral premix supplied the following per Kg of complete feed: Manganese (MnSO4·H2O), 80 mg;
Zinc (ZnO), 80 mg; Iron (FeSO4·7H2O), 80 mg; Copper (CuSO4·5H2O), 10 mg; Selenium (Na2SeO3), 0.3 mg; Iodine (Iodized NaCl), 0.8 mg; Cobalt (CoCl2), 0.25 mg.
Statistical analysis
which the individual bird was the experimental unit. Ash data presented as percentages were transformed to their arcsine square root before statistical analysis, and the non-transformed data are presented in the table. The data of six NC treatments were additionally analyzed as a 2 × 3 factorial arrangement to determine the main effects of CA, phytase and their interactions. The treatment means were compared using LSD at P<0.05.
Results and discussion
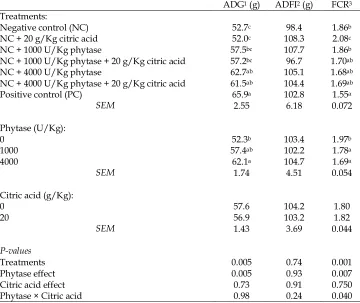
The effects of phytase and CA on growth performance are presented in Table 2. Overall (d 22 to 42) mortality was approximately less than 4%, and not related to dietary treatments (P>0.05; data not shown). Birds fed the PC diet had a higher ADG, and also lower FCR than those of the birds fed the NC diet, confirming that the NC diet was indeed Pa-deficient. Phytase supplementation significantly affected ADG and FCR, while CA addition did not influence these parameters. The beneficial effect of phytase superdoses on feed efficiency or weight gain have been observed when supplemented to soybean meal-based diets limited in Pa (Shirley and Edwards, 2003; Han et al., 2009; Liu et al., 2010; Shaw et al., 2011; Walk et al., 2012, 2013, 2014; Pirgozliev and Bedford, 2013). However, there are a few research that show no significant effect on feed efficiency when phytase was supplemented to the NC diet (Pirgozliev et al., 2007; Rutherfurd et al., 2012; Gehring et al., 2013).
There was no significant difference of ADFI among treatments. A deficiency of Pa in chickens is characterized by a reduction in feed intake and reduced circulating levels of growth hormone (Parmer et al., 1987). The lack of significant difference in ADFI between treatments may indicate that young birds may be more susceptible to an Pa deficiency than older birds which were used in our trials. Walk
et al. (2013) also found Pa deficiency and phytase addition did not affect feed intake even in chicks from 1 to 21 d of age. There are some studies that showed no significant difference of feed intake when phytase was supplemented to Pa deficient diets (Pirgozliev et al., 2010; Shaw et al., 2011; Chung et al., 2013; Walk et
al., 2013), however, other researchers found that feed intake was influenced when
phytase was supplemented to NC (Shirley and Edwards, 2003; Han et al., 2009; Liu
et al., 2010; Rutherfurd et al., 2012; Walk et al., 2012, 2014; Pirgozliev and Bedford, 2013).
(1999) who showed that phytase more readily hydrolyses phytate in soybean meal (72.4%) than in canola meal (55.8%), although the latter contained higher levels of phytate. On the other hand, the results of FCR show that, if CA is supplemented (at 20 g/Kg) to severely limited Pa diets based on corn-canola meal, a lower level of phytase (1000 U/Kg) can be sufficient to obtain the comparable FCR to those fed the NC + 4000 U/Kg phytase or the PC diet. In agreement with our results, Snow et
al. (2004) reported the improved growth performance of broilers due to the
addition of CA to a phytase (300 U/Kg) supplemented low Pa diet.
Table 2. Effect of phytase superdoses and citric acid on growth performanceof
male broilers from 22 to 42 d post hatch
ADG1 (g) ADFI2 (g) FCR3
Treatments:
Negative control (NC) 52.7c 98.4 1.86b
NC + 20 g/Kg citric acid 52.0c 108.3 2.08c
NC + 1000 U/Kg phytase 57.5bc 107.7 1.86b
NC + 1000 U/Kg phytase + 20 g/Kg citric acid 57.2bc 96.7 1.70ab
NC + 4000 U/Kg phytase 62.7ab 105.1 1.68ab
NC + 4000 U/Kg phytase + 20 g/Kg citric acid 61.5ab 104.4 1.69ab
Positive control (PC) 65.9a 102.8 1.55a
SEM 2.55 6.18 0.072
Phytase (U/Kg):
0 52.3b 103.4 1.97b
1000 57.4ab 102.2 1.78a
4000 62.1a 104.7 1.69a
SEM 1.74 4.51 0.054
Citric acid (g/Kg):
0 57.6 104.2 1.80
20 56.9 103.2 1.82
SEM 1.43 3.69 0.044
P-values
Treatments 0.005 0.74 0.001
Phytase effect 0.005 0.93 0.007
Citric acid effect 0.73 0.91 0.750
Phytase × Citric acid 0.98 0.24 0.040
1Average daily gain; 2Average daily feed intake; 3Feed conversion ratio.
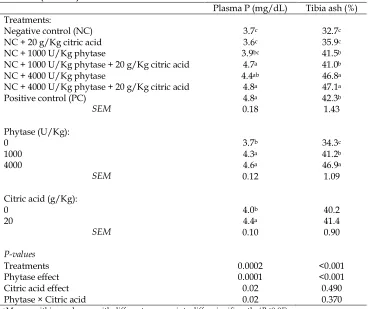
Table 3. Effect of phytase superdoses and citric acid on plasma P (on d 32) and tibia ash (on d 42) of male broilers
Plasma P (mg/dL) Tibia ash (%)
Treatments:
Negative control (NC) 3.7c 32.7c
NC + 20 g/Kg citric acid 3.6c 35.9c
NC + 1000 U/Kg phytase 3.9bc 41.5b
NC + 1000 U/Kg phytase + 20 g/Kg citric acid 4.7a 41.0b
NC + 4000 U/Kg phytase 4.4ab 46.8a
NC + 4000 U/Kg phytase + 20 g/Kg citric acid 4.8a 47.1a
Positive control (PC) 4.8a 42.3b
SEM 0.18 1.43
Phytase (U/Kg):
0 3.7b 34.3c
1000 4.3a 41.2b
4000 4.6a 46.9a
SEM 0.12 1.09
Citric acid (g/Kg):
0 4.0b 40.2
20 4.4a 41.4
SEM 0.10 0.90
P-values
Treatments 0.0002 <0.001
Phytase effect 0.0001 <0.001
Citric acid effect 0.02 0.490
Phytase × Citric acid 0.02 0.370
a-c Means, within a column, with different superscripts differ significantly (P<0.05).
plasma P compared with the PC. They found phytase addition only at 12000 U/Kg to the NC enhanced the plasma P to the similar extent of that obtained by the PC. With regard to the high content of phytate in canola meal (NRC, 1994; Leske and Coon, 1999), it seems that 4000 U/Kg phytase or 1000 U/Kg phytase plus CA are sufficient to increase plasma P in broilers fed severely Pa limited diets. In the present study, the improvement in feed efficiency seems to be due to the phytase that increases the plasma P. Nevertheless, in soybean meal based diets, reduction of anti-nutritional effects of phytate may be involved in improvement of broilers performance as well (Taheri et al., 2015).
Although TA values of the NC + 1000 U/kg phytase treatments (with or without CA) were significantly similar to the values of the PC treatment, TA of the NC + 4000 U/Kg phytase treatments (with or without CA) were significantly more than that of the PC treatment. The results of TA were in agreement with those obtained by soybean meal-based diets (Taheri et al., 2015). Other studies also have shown that bone ash content was increased by graded levels of phytase supplementation (Zhang et al., 2000; Dilger et al., 2004; Han et al., 2009; Shaw et al., 2011; Rutherfurd et al., 2012; Walk et al., 2012, 2013, 2014). Although the overall response of phytase addition to low Pa diets between the previous research (Shirley and Edwards, 2003; Han et al., 2009) and this study are similar, the degree of response differs. These differences are most likely due to the differences in processing of the tibia for ash analysis, Ca, total P and Pa contents of the diets used, variable levels of supplemental vitamin D, the environment in which the experiment was conducted, type of strains used, or a combination of them. Greater response of TA in NC + 4000 U/Kg phytase treatment may be related to the non-phosphoric and inositol effects of phytase superdoses (Cowieson et al., 2011).
In conclusion, the results of this study showed that, in severely limited Pa corn-canola meal-based diets, supplementing 4000 U/Kg phytase or also 1000 U/Kg phytase plus CA will be sufficient to obtain comparable feed efficiency in broilers to those fed the adequate available P diet.
References
Aviagen. 2009. Ross 308 Broiler Nutrition Specifications. http://en.aviagen.com/ross-308/. Chung TK, Rutherfurd SM, Thomas DV & Moughan PJ. 2013. Effect of two microbial
phytases on mineral availability and retention and bone mineral density in low-phosphorus diets for broilers. British Poultry Science, 54: 362-373.
Cowieson AJ, Wilcock P & Bedford MR. 2011. Super-dosing effects of phytase in poultry and other monogastrics. World's Poultry Science Journal, 67: 225-235. Dilger RN, Onyango EM, Sands JS & Adeola O. 2004. Evaluation of microbial
phytase in broiler diets. Poultry Science, 83: 962-970.
Gehring CK, Bedford MR & Dozier WA. 2013. Extra-phosphoric effects of phytase with and without xylanase in corn-soybean meal-based diets fed to broilers. Poultry Science, 92: 979-991.
& Feng XY. 2009. Evaluation of equivalency values of microbial phytase to inorganic phosphorus in 22- to 42-day-old broilers. Journal of Applied Poultry Research, 18: 707-715.
Jendza JA, Dilger RN, Sands JS & Adeola O. 2006. Efficacy and equivalency of an
Escherichia coli-derived phytase for replacing inorganic phosphorus in the diets of broiler chickens and young pigs. Journal of Animal Science, 84: 3364-3374. Leske KL & Coon CN. 1999. A bioassay to determine the effect of phytase on phytate
phosphorus hydrolysis and total phosphorus retention of feed ingredients as determined with broilers and laying hens. Poultry Science, 78: 1151–1157.
Liu N, Ru YJ, Cowieson AJ, Li FD & Cheng XCH. 2008. Effects of phytate and phytase on the performance and immune function of broilers fed nutritionally marginal diets. Poultry Science, 87: 1105-1111.
Liu N, Ru Y, Wang J & Xu T. 2010. Effect of dietary sodium phytate and microbial phytase on the lipase activity and lipid metabolism of broiler chickens. British Journal of Nutrition, 103: 862-868.
Maenz DD, Engele-Schaan CM, Newkirk RW & Classen HL. 1999. The effect of minerals and mineral chelators on the formation of phytase-resistant and phytase-susceptible forms of phytic acid in solution and in a slurry of canola meal. Animal Feed Science and Technology, 81: 177-192.
NRC (National Research Council). 1994. Nutrient Requirements of Poultry. 9th Rev.
Ed. National Academy Press. Washington, DC. 176 Pages.
Olukosi OA, Cowieson AJ & Adeola O. 2007. Age-related influence of a cocktail of xylanase, amylase, and protease or phytase individually or in combination in broilers. Poultry Science, 86: 77-86.
Parmer TG, Carew LB, Alster FA & Scanes CG. 1987. Thyroid function, growth hormone, and organ growth in broilers deficient in phosphorus. Poultry Science, 66: 1995-2004.
Pirgozliev V, Acamovic T & Bedford MR. 2009. Previous exposure to dietary phytase reduces the endogenous energy losses from precision-fed chickens. British Poultry Science, 50: 598-605.
Pirgozliev V & Bedford MR. 2013. Energy utilisation and growth performance of chicken fed diets containing graded levels of supplementary bacterial phytase. British Journal of Nutrition, 109: 248-253.
Pirgozliev V, Karadas F, Pappas A, Acamovic T & Bedford MR. 2010. The effect on performance, energy metabolism and hepatic carotenoid content when phytase supplemented diets were fed to broiler chickens. Research in Veterinary Science, 89: 203-205.
Pirgozliev V, Oduguwa O, Acamovic T & Bedford MR. 2007. Diets containing
Escherichia coli-derived phytase on young chickens and turkeys: Effects on performance, metabolizable energy, endogenous secretions, and intestinal morphology. Poultry Science, 86: 705-713.
Radcliffe JS, Zhang Z & Kornegay ET. 1998. The effects of microbial phytase, citric acid, and their interaction in a corn-soybean meal-based diet for weanling pigs. Journal of Animal Science, 76: 1880-1886.
Rutherfurd SM, Chung TK, Thomas DV, Zou ML & Moughan PJ. 2012. Effect of a novel phytase on growth performance, apparent metabolizable energy, and the availability of minerals and amino acids in a low-phosphorus corn-soybean meal diet for broilers. Poultry Science, 91: 1118-1127.
SAS (Statistical Analysis System). 2003. SAS/STAT® 9.1. User’s Guide. SAS
Institute Inc. Cary, North Carolina.
Selle PH & Ravindran V. 2007. Microbial phytase in poultry nutrition. Animal Feed Science and Technology, 35: 1-41.
Shaw AL, Hess JB, Blake JP & Ward NE. 2011. Assessment of an experimental phytase enzyme product on live performance, bone mineralization, and phosphorus excretion in broiler chickens. Journal of Applied Poultry Research, 20: 561-566. Shirley RB & Edwards HM. 2003. Graded levels of phytase past industry standards
improves broiler performance. Poultry Science, 82: 671-680.
Simon O & Igbasan F. 2002. In vitro properties of phytases from various microbial origins. International Journal of Food Science and Technology, 37: 813-822. Snow JL, Baker DH & Parsons CM. 2004. Phytase, citric acid, and
1α-hydroxycholecalciferol improve phytate phosphorus utilization in chicks fed a corn-soybean meal diet. Poultry Science, 83: 1187-1192.
Taheri HR, Heidari A & Shahir MH. 2015. Effect of high-dose phytase supplementation in broilers from 22 to 42 days post-hatch given diets severely limited in available phosphorus. British Poultry Science, 56: 330-336.
Walk CL, Bedford MR & McElroy AP. 2012. Influence of limestone and phytase on broiler performance, gastrointestinal pH, and apparent ileal nutrient digestibility. Poultry Science, 91: 1371-1378.
Walk CL, Bedford MR, Santos TS, Paiva D, Bradley JR, Wladecki H, Honaker C & McElroy AP. 2013. Extra-phosphoric effects of superdoses of a novel microbial phytase. Poultry Science, 92: 719-725.
Walk CL, Santos TT & Bedford MR. 2014. Influence of superdoses of a novel microbial phytase on growth performance, tibia ash, and gizzard phytate and inositol in young broilers. Poultry Science, 93: 1172-1177.
Woyengo TA, Guenter W, Sands JS, Nyachoti CM & Mirza MA. 2008. Nutrient utilisation and performance responses of broilers fed a wheat-based diet supplemented with phytase and xylanase alone or in combination. Animal Feed Science and Technology, 146: 113-123.
Woyengo TA, Slominski BA & Jones RO. 2010. Growth performance and nutrient utilization of broiler chickens fed diets supplemented with phytase alone or in combination with citric acid and multicarbohydrase. Poultry Science, 89: 2221-2229. Zhang ZB, Kornegay ET, Radcliffe JS, Denbow DM, Veit HP & Larsen CT. 2000.