IJSRR, 8(3) July. – Sep., 2019 Page 233
Research article Available online www.ijsrr.org
ISSN: 2279–0543
International Journal of Scientific Research and Reviews
Development and Validation of Stability Indicating UPLC method for
simultaneous Quantification of Thiophanate-methyl, Metalaxyl and
Captan in Pesticide Formulation
Patel Dilip K* and Rajawat T.L.
School of Basic and Applied Sciences, Raffles University,Neemrana-Alwar, Rajasthan-301705, India
ABSTRACT
A novel stability-indicating ultra-performance liquid chromatography (UPLC) method has been developed and validated for quantification of Thiophanate-methyl, Metalaxyl and Captan in pesticide formulation (DS), using Poroshell 120 EC-C18 (100 mm × 4.6 mm, 2.7µm) column. Mixture of 0.1% ortho-phosphoric acid: Acetonitrile (50:50 v/v) was used as mobile phase. The flow rate was kept 0.7 ml/min and detection was carried out at 205 nm. The limit of detection was 0.0002 mg/ml, 0.0002 mg/ml and 0.001 mg/ml for Thiophanate-methyl, Metalaxyl and Captan respectively.The limit of quantitation values was 0.0004 mg/ml, 0.0004 mg/ml and 0.0020 mg/ml for Thiophanate-methyl, Metalaxyl and Captan respectively. The linearity of proposed method was investigated in the range of 0.0004-0.297 mg/ml (r2=0.9998), 0.0004-0.153 mg/ml (r2=0.9993) and 0.0020-0.742 mg/ml (r2=0.9996) for Thiophanate-methyl, Metalaxyl and Captan respectively. The percentage recovery found to be in range from 99.7-100.8 %,100.2-100.9% and 99.2-100.7% for Thiophanate-methyl, Metalaxyl and Captan respectively. The % RSD values for intraday precision study and inter-day precision study were < 1.90, < 2.10 and < 1.65 for Thiophanate-methyl, Metalaxyl and Captan respectively as per modified Horwitz equation as requirements by CIPAC.The developed method was found to be specific, linear, precise, accurate and robust.
KEYWORDS
: Thiophanate-methyl; Metalaxyl; Captan; Stability indicating; Validation; Horwitzequation; DS-Dry powder for Seed treatment, CIPAC
* Corresponding Author
Mr. Dilip K. Patel
Research Scholar
School of Basic and Applied Sciences
Raffles University, Neemrana-Alwar, Rajasthan-301705 Email: [email protected],
IJSRR, 8(3) July. – Sep., 2019 Page 234
INTRODUCTION
Thiophanate-methyl, is dimethyl 4, 4′-(o-phenylene) bis (3-thioallophanate). Thiophanate-methyl is Systemic Fungicide with protective and curative action, absorbed by the leaves and roots of plants / crops , effective against a wide range of fungal pathogens including eyespot and other disease of cereals. Also used additionally as a wound protectant for pruning cuts of trees. Metalaxyl
is methyl N-(methoxyacetyl)-N-(2, 6-xylyl)-DL-alaninate; methyl 2-{[(2, 6-dimethylphenyl) methoxyacetyl] amino} propionate. Metalaxyl is Systemic fungicide with protective and curative action, taken up by leaves, stems and roots. Captan is N-(trichloromethylthio) cyclohex-4-ene-1, 2-dicarboximide. Captan is non-systemic fungicide with protective and curative action. Structures of compounds shown in figure 1-3.
Figure 1. Structure of Thiophanate-methyl Figure 2. Structure of Metalaxyl
Figure 3. Structure of Captan
IJSRR, 8(3) July. – Sep., 2019 Page 235
RP-HPLC method for simultaneous determination of Captan and Metalaxyl residues in grapes
17
and RP-HPLC method for simultaneous determination of Thiophanate-methyl and Captan residue in IPA solution used by orchard workers 18
To the best of our knowledge, there is no reported UPLC method for simultaneous quantification of Thiophanate-methyl, Metalaxyl and Captan in pesticide formulations. Thus, efforts were made to develop fast, selective and sensitive stability indicating method for quantification of Thiophanate-methyl, Metalaxyl and Captan in their combined pesticide formulation using ultra performance liquid chromatography. In the current work developed a simple, reliable and reproducible, stability indicating UPLC method which was duly validated by statistical parameters precision, accuracy-recovery, linearity, robustness, solution stability. The method has been applied to the simultaneous quantification of Thiophanate-methyl, Metalaxyl and Captan in technical and pesticide formulations.
EXPERIMENTAL
Materials:
Certified Reference materials (CRM) of Thiophanate-methyl, Metalaxyl andCaptan were procured from Sigma Aldrich. The technical grade materials of above active ingredients were obtained from market. The analytical standards were prepared by purification of these technical grade materials. The analytical standards were qualified against CRMs and purity found as Thiophanate-methyl (98.3%), Metalaxyl (98.6%) and Captan (98.8%). These standards used for further analysis. Sample of Pesticide formulation for seed treatment (DS) containing Thiophanate-methyl 10% w/w, Metalaxyl 5% w/w and Captan 25% w/w was prepared in laboratory. HPLC grade acetonitrile was purchased from Fischer Scientific, Mumbai (India). Mili-Q (Millipore India Pvt. Ltd) system used to obtain HPLC grade water. Analytical grade Ortho-phosphoric acid (88%), Hydrochloric acid (35%), Sodium Hydroxide pellets and 30% v/v Hydrogen Peroxide solution were obtained from SD Fine Chemicals Ltd, Mumbai (India).
Instrumentation:
Agilent Infinity-II UPLC system is used for the development andvalidation of method, which is comprised of a quaternary solvent pump, Photo Diode array detector and auto sampler with Open-Lab software.
Mobile phase preparation:
The mobile phase consists of 0.1 % Ortho-phosphoric acidand Acetonitrile in 50:50 (v/v) ratio. Buffer was prepared by adding 1.0 ml of Ortho-phosphoric acid in 1000 ml HPLC grade water and filtered through a 0.45 µm nylon membrane (Millipore Pvt. Ltd, Bengaluru, India) and degassed in an ultrasonic bath.
IJSRR, 8(3) July. – Sep., 2019 Page 236
Standard Preparation:
The Standard stock solution prepared in 50 ml volumetric flask bydissolving 102.3 mg of Thiophante-methyl (98.3%), 50.85 mg of Metalaxyl (98.6%) and 250.17 mg of Captan (98.8%) standard in 20 ml of Acetonitrile. This solution then sonicated for 10 minutes and diluted to volume with diluent. Further 5 ml of this solution is taken in 50 ml volumetric flask and made up to mark with the diluent. This standard solution contains 0.2011 mg/ml of Thiophanate-methyl, 0.100 mg/ml of Metalaxyl and 0.494 mg/ml of Captan.
Sample Preparation:
Sample solution was prepared by taking about 100 mg of sample in50 ml volumetric flask and about 10 ml of diluent was added and sonicated for 10 minutes with intermittent shaking. The content was brought back to ambient temperature and diluted to volume with diluent. The sample was filtered through 0.45µm nylon syringe filter.
Chromatographic condition:
Column : Poroshell 120 EC-C18 (Agilent Technologies) (100 mm x 4.6 mm, 2.7 µm)
Mobile phase : Mobile Phase-A: Mobile Phase-B 0.1 % OPA: Acetonitrile (50:50 v/v) Flow : 0.70 ml/min
Injection Volume : 1 µl Column Temperature : 30°C Wavelength : 205 nm Run Time : 12 minutes
Initial analysis of sample:
Sample was analyzedand results were tabulated in Table 1.Table 1: Results of initial analysis
Sr. No Ingredients Active Ingredient content (A.I) % w/w
1 Thiophanate-methyl 9.55
2 Metalaxyl 5.11
3 Captan 25.94
Calculation:
Active content (%w/w) forThiophanate-methyl/ Metalaxyl / Captan
= × ℎ
50 ×
5
50×
50
IJSRR, 8(3) July. – Sep., 2019 Page 237
RESULTS AND DISCUSSION
Development and optimization of UPLC Method
In the present work, an analytical method based on UPLC using PDA detector has been developed and validated for the quantification of Thiophanate-methyl, Metalaxyl and Captan in pesticide formulation. The analytical condition was selected, keeping in mind the different chemical nature of these three actives. The development trials were taken by using the degraded sample of each component was done, by keeping them in various extreme conditions.
The column selection has been done on the basis of back pressure, resolution, peak shape and day to day reproducibility of retention time. After evaluating all these factors, Agilent make Poroshell 120 EC C18 (100 mm x 4.6 mm, 2.7 µm particle size) column was found to be giving satisfactory results. Mobile phase is selected on the basis of the chemical structure of three actives. The acidic pH range of mobile phase was found suitable for solubility, resolution, stability and peak shape of three components. Considerably good results were obtained with 0.1 % Ortho-phosphoric acid solutions as buffer. Acetonitrile was chosen as organic constituents to reduce the longer retention time and better peak shape. Finally the mobile phase composition consisting of 0.1% OPA and Acetonitrile in 50:50 ratio (v/v) was fixed. Optimized proportion of mobile phase has shown good resolution between Thiophanate-methyl, Metalaxyl and Captan and also the degradation product which generated during forced degradation study. Wavelength selection and PDA scan graph are given in figure 4.
Figure 4. Wavelength Scan Overlay of Standard Preparation
Forced degration study (Stress study) and stability indicating test
IJSRR, 8(3) July. – Sep., 2019 Page 238
not complete degradation of active materials. The discovery such conditions was based on trial and error. Refer Table 2 for % degradation (%w/w) in each stress conditions.
Acidic condition:Acidic degradation study was performed by taking about 100 mg of sample in 50 volumetric flask and added 5 ml of 0.1N HCl and kept for 15 minutes at room temperature. After 15 minutes sample was neutralized with 0.1N NaOH, diluted with diluent and filtered through 0.45µ nylon syringe filter and injected.
Alkaline condition: Alkaline degradation study was performed by taking about 100 mg of sample in 50 volumetric flask and added 5 ml of 0.1N NaOH and kept for 15 minutes at room temperature. After 15 minutes sample was neutralized with 0.1N HCl, diluted with diluent and filtered through 0.45µ nylon syringe filter and injected.
Oxidative condition:Oxidative degradation study was performed by taking about 100 mg of sample in 50 volumetric flask and added 5 ml of 5% H2O2 and kept for 15 minutes at room
temperature. After 15 minutes sample was diluted with diluent and filtered through 0.45µ nylon syringe filter and injected.
Thermal condition:Thermal degradation was performed by exposing formulation sample at 54°C for 14 days, also known as Accelerated Heat Study (AHS). About 100 mg of sample taken in 50 volumetric flask diluted with diluent, sonicate and filtered through 0.45µ nylon syringe filter and injected.
Photolytic condition:Photolytic degradation study was performed by exposing formulation sample to sunlight for 14 days. About 100 mg of sample taken in 50 volumetric flask diluted with diluent, sonicate and filtered through 0.45µ nylon syringe filter and injected.
Table 2: Results of Forced degradation study Active Ingredient Content (A.I) (% m/v)
Condition Thiophanate-methyl Metalaxyl Captan
Degradation Degradation Degradation
Initial 9.55 --- 5.11 --- 25.94 ---
Acidic 8.50 1.05 4.90 0.21 22.73 3.21
Alkaline 6.03 3.52 4.46 0.65 20.59 5.35
Oxidative 7.04 2.51 3.86 1.25 24.63 1.31
Thermal 9.53 0.02 5.02 0.09 24.00 0.94
Photolytic 9.50 0.05 3.90 1.21 25.39 0.55
Method validation
The method validation was carried out as per ICH guidelines21 and SANCO guidelines 22.Various method validation parameters were performed.
IJSRR, 8(3) July. – Sep., 2019 Page 239
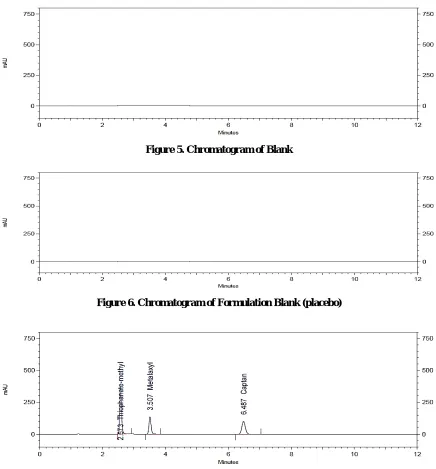
sample solution. Since there was no interference between the peaks of active ingredients in standard, sample as well as in mobile phase blank and formulation blank. Also peak purity was found satisfactory. Refer figure 5-8.
Figure 5. Chromatogram of Blank
Figure 6. Chromatogram of Formulation Blank (placebo)
IJSRR, 8(3) July. – Sep., 2019 Page 240
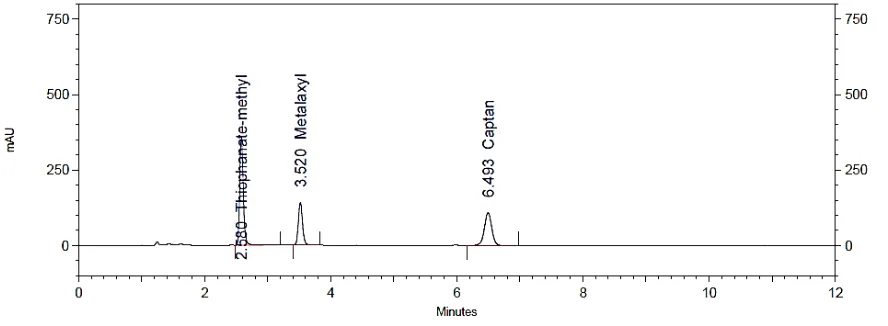
Figure 8. Chromatogram of Sample Preparation
System Suitability:System suitability is integral part of method validation. % RSD of retention times and peak area of six replicate injection of standard solution were less than 1.0 %.( Refer Table 3)
Table 3: System Suitability of standard solution
Parameters Results Limits
Thiophanate-methyl Metalaxyl Captan
% RSD of retention time 0.11 0.01 0.06 < 1.0 %
% RSD of peak area 0.54 0.49 0.68 < 1.0 %
Precision:The Precision was evaluated at three levels, repeatability and reproducibility (intraday) and intermediate precision (inter-day). Each level of precision was investigated by six replicate injections of concentration 0.201 mg/ml, 0.10 mg/ml and 0.50 mg/ml of Thiophanate-methyl, Metalaxyl and Captan respectively. Table 4 showing acceptable % RSD values calculated by modified Horwitz equation
% =< ( . ) × 0.67
The results of precision was expressed as % RSD and was tabulated in Table 5 Table 4: Acceptable % RSD values calculated by modified Horwitz Equation
Sr. no. Compound % Analyte (w/w) Analyte Ratio (C) % RSD (calc.)
1 Thiophanate-methyl 10 0.10 1.90
2 Metalaxyl 5 0.05 2.10
3 Captan 25 0.25 1.65
Table 5: Results of Precision studies
Thiophanate-methyl (% w/w) Metalaxyl (% w/w) Captan (% w/w)
Intraday Inter-day Intraday Inter-day Intraday Inter-day
Mean (% w/w) 9.52 9.48 5.16 5.11 26.00 25.99
% RSD 0.83 0.34 0.80 0.22 0.40 0.60
IJSRR, 8(3) July. – Sep., 2019 Page 241
from system suitability standard solution. The solution was injected 6 times and % RSD calculated. If % RSD was less than 10%, then this level termed LOQ. If % RSD exceeds 10%, then this level termed LOD. Table 5 showing LOD and LOQ values. Refer Table 6
Table 6: Limit of Detection and Limit of Quantitation study
Thiophanate-methyl (mg/ml) Metalaxyl (mg/ml) Captan (mg/ml)
Limit of Detection 0.00020 0.00020 0.0010
Limit of Quantitation 0.00040 0.00040 0.0020
Linearity:The linearity was evaluated by measuring 6 different concentration levels from LOQ, 50%, 80%, 100%, 120 % and 150% of standard solution of Thiophanate-methyl, Metalaxyl and Captan. The linearity curve plotted concentration of standard (mg/ml) against mean peak areas and the correlation coefficient value was computed. The summary of the parameters shown in Table 7.
Table 7: Linearity study
Thiophanate-methyl (mg/ml) Metalaxyl (mg/ml) Captan(mg/ml)
Linearity Range 0.0004-0.297 0.0004-0.153 0.002-0.742
Correlation Coefficient (R2) 0.9998 0.9993 0.9994
Slope (m) 988776258.17 867786917.34 220740984.90
Y-intercept (C) -707442.87 559956.74 1098760.22
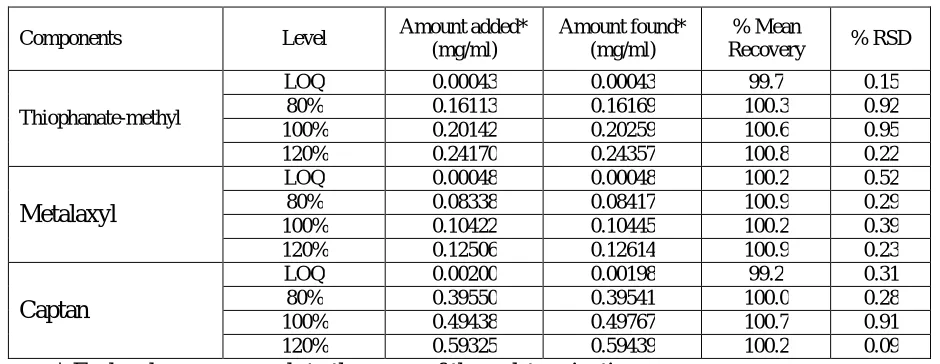
Accuracy and recovery:Accuracy (% Recovery) of analytical method was determined at four concentration levels by spiking known amount of pure actives in placebo i.e. LOQ, 80%, 100% and 120%. The accuracy was calculated as % of recovery. The mean recovery results were tabulated in Table 8.
Table 8: Results of accuracy study
Components Level Amount added*
(mg/ml)
Amount found* (mg/ml)
% Mean
Recovery % RSD
Thiophanate-methyl
LOQ 0.00043 0.00043 99.7 0.15
80% 0.16113 0.16169 100.3 0.92
100% 0.20142 0.20259 100.6 0.95
120% 0.24170 0.24357 100.8 0.22
Metalaxyl
LOQ 0.00048 0.00048 100.2 0.52
80% 0.08338 0.08417 100.9 0.29
100% 0.10422 0.10445 100.2 0.39
120% 0.12506 0.12614 100.9 0.23
Captan
LOQ 0.00200 0.00198 99.2 0.31
80% 0.39550 0.39541 100.0 0.28
100% 0.49438 0.49767 100.7 0.91
120% 0.59325 0.59439 100.2 0.09
* Each value corresponds to the mean of three determinations
IJSRR, 8(3) July. – Sep., 2019 Page 242
in peak areas and assay values. It was concluded that the standard and samplesolutions were found stable up to 72 hours at ambient temperature.
Robustness:The robustness of method was studied by performing small, deliberate changes in flow, mobile phase composition and column temperature. The quantification values of sample solutions were unaffected and in accordance with that of initial.
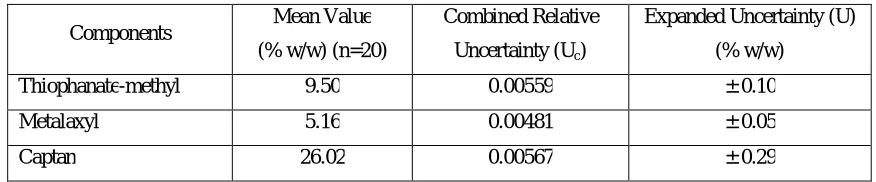
Uncertainty of measurement (U): Uncertainty of method was measured through the data of uncertainty due to Repeatability, Calibration uncertainty of equipment or glassware, Readability of equipment, CRM purity of concentration, Linearity of calibration curve and Recovery of the analyte. The Combined Relative Uncertainty (Uc) and Expanded Uncertainty (U) were calculated. Refer
Table 9.
Table 9: Calculated Combined and Expanded Uncertainty
Components Mean Value
(% w/w) (n=20)
Combined Relative
Uncertainty (Uc)
Expanded Uncertainty (U)
(% w/w)
Thiophanate-methyl 9.50 0.00559 ± 0.10
Metalaxyl 5.16 0.00481 ± 0.05
Captan 26.02 0.00567 ± 0.29
CONCLUSION
A simple, specific, rapid, sensitive and reliable UPLC method has been developed for quantification of Thiophanate-methyl, Metalaxyl and Captan in their pesticide formulation. Stress study showed that all degradation products were well separated from Thiophanate-methyl, Metalaxyl and Captan peaks confirming its stability indicating power. Method validation study showed that the method is specific, linear, accurate and easily reproducible. This method can also be used for quantification of Thiophanate-methyl, Metalaxyl and Captan in their single or combination formulated products with different strengths and different formulation types. Hence developed method can be adopted to regular quality control analysis of production samples and stability samples.
ACKNOWLEDGMENT
The authors are thankful to School of Basic and Applied Science, Raffles University, Rajasthan, India for encouragement and permission for publication.
REFERENCES
IJSRR, 8(3) July. – Sep., 2019 Page 243
Tea using Isotope Dilution Ultra Performance Liquid Chromatography-Tandem Mass Spectrometry. Journal of Chromatographic Science. 2014;52:1157-1164.
2. Monika Skowron, Witold Ciesielski. Determination of Thiophate Methyl using Iodine Azide Reaction. Chem. Anal.(Warsaw).2008;53:133.
3. W Dobrat, A. Martinj. Analysis of Technical and Formulated Pesticides (Vol. E). Collaborative Interntional Pesticides Analytical Council Ltd, England,1993
4. Malhat, F. M. Persistence of Metalaxyl Residues on Tomato fruit using High Performance Liquid Chromatography and QuChERs Methodology. Arabian Journal of Chemistry, 2017, S765-S768. Available from URL: http.//www.ksu.edu.sa
5. K Navyaja and B Ramya Kuber. Analysis of Pesticide Residue in Coconut Water and Tomatoes around Tirupati Region by Using Reverse Phase Ultra High Performance Liquid Chromatography. Chemical Science Reviews and Letters.2017;6 (24): 2616-2621.
6. Jean Hsu, Stephen Siegel. Determination of Linuron, Isoxaben, Mefenoxam, Metalaxyl, Methomyl and Propyzamide in Well Water by Ultra Performance Liquid Chromatography Coupled to Tandem Mass Spectrometry. Center for Analytical Chemistry, Environmental Analysis Section, California Department of Food and Agriculture, Sacramento, CA.2013. 7. Eva Pose-Juan, Raquel Rial-Otero, Elena Martines-Carballo. Determination of Metalaxyl
and Identification of adjuvents in wettable powder pesticides technical formulas. Analytical and Bioanalytical Chemistry.2009;394(6):1535-1544.
8. Marvin CH, Brindle ID, Hall CD and Chiba M. Development of an automated high-performance liquid chromatographic method for the on line pre-concentration and determination of trace concentration of pesticides in drinking water. Journal of chromatography.1990; 503(1): 167-176.
9. Mu Wei, Liu feng, Sun Zuo-yang, Liu Yan-liang and Pan Jin-ju Study on the qualitative analysis of captan and folpet by GC and HPLC. Chinese Journal of Analysis Laboratory
2006.
10.Aurelie Berthet, Michele Bouchard, Patrick Schupfer, David Vernez Brigitta Danuser, and Cong Khanh Huynh. Liquid Chromatography-tandem mass spectrometry (LC/APCI-MS/MS) method for the quantification of Captan and folpet phthalimide metabolites in human plasma and urine. Analytical Bioanalytical Che. 2011; 399: 2243-2255.
11.Steven J. Lehotay, Andre de kok, Maurice Hiemstra and peter van Bodegraven. Validation of a Fast and Easy Method for the Determination of Residues from 229 Pesticides in Fruits and Vegetables Using Gas and Liquid Chromatography and Mass Spectrometric Detection.
IJSRR, 8(3) July. – Sep., 2019 Page 244
12.Kari Organtini, Susan Leonard, Simon Hird, Eimear McCall and Gareth Cleland. A new strategy for the determination of Captan and folpet in food matrices. 2017. Available from URL: http://www.waters.com/posters.
13.Philip L. Wylie and Chin-Kai Meng. A method for the trace analysis of 175 pesticides using Agilent triple quadrupole GC/MS/MS Application note food safety. Available from URL: http://www.agilent.com/chem 2009 590-3578EN
14.Simultaneous analysis of residual pesticides including Captan in foods via QuEChERS method utilizing GC-MS/MS (MRM) technique. Available from URL: http://www.shimadzu.com/an 71, 2013.
15.Maria Luisa Fernandez-Cruz, Susana Grimalt, Mercedes Villarrya, Francisco Jose Lopez, Susana Lianos, Jose Maria Garcia-Badin. Residue levels of Captan and Trichlorfon in field-tratedkakifruits, individual versus composite samples and after household processing. Food additives and contaminants.2006;23(06): 591-600.
16.Sunitasood. Spectrophotometric determination of the fungicides captan and folpet in their commercial formulations. ChemXpress.2014;3(1): 24-27.
17.L. Velkoska-Markovska*, B. Petanovska-Ilievska, M. S.Jankulovska and U. Ilievski. Development and Validation of High-Performance Chromatography Method for Determination of Some Pesticide residues in Table Grape. Acta Chromagraphica, 2017:1-5. 18.Ronnee N Andrews, Larry B. Jaycob. Captan and Thiophanate-methyl in hand rinse, method
9202, NIOSH manual of Analytical methods (NMAM) (4th ed.), 2003:1-4.
19.ICH,” Stability of New Drug Substances and Products,” International Conference on Harmonization Guidance Documents, 2005, Q1A. Available from URL: http://www.ich.org 20.ICH,” Photo-stability Testing of New Drugs Substances and Products,’ International
Conference on Harmonization Guidance Documents, 2005, Q1B. Available from URL: http://www.ich.org
21.ICH,” Validation of Analytical Procedures: Text and Methodology,” International Conference on Harmonization Guidance Documents, 2005, Q2 (R1). Available from URL: http://www.ich.org
22.SANCO guidelines. Guidance on Storage Stability Data Requirements for Non-Agricultural Pesticides Products.2004.
23.Tomlin,C. D. S.The Pesticide Manual(15 ed.), BCPC.
IJSRR, 8(3) July. – Sep., 2019 Page 245