www.nat-hazards-earth-syst-sci.net/12/1407/2012/ doi:10.5194/nhess-12-1407-2012
© Author(s) 2012. CC Attribution 3.0 License.
and Earth
System Sciences
Wet-snow avalanche interaction with a deflecting dam: field
observations and numerical simulations in a case study
B. Sovilla1, I. Sonatore1,2, Y. B ¨uhler1, and S. Margreth1
1Warning and Prevention Research Unit, WSL Institute for Snow and Avalanche Research SLF, Fl¨uelastrasse 11, Davos Dorf, 7260, Switzerland
2Universit`a degli Studi di Milano – Bicocca, Dipartimento di Scienze Geologiche e Geotecnologie, Piazza della Scienza 4, Milano 20126, Italy
Correspondence to: B. Sovilla ([email protected])
Received: 22 November 2011 – Revised: 29 February 2012 – Accepted: 5 March 2012 – Published: 11 May 2012
Abstract. In avalanche-prone areas, deflecting dams are widely used to divert avalanches away from endangered ob-jects. In recent years, their effectiveness has been questioned when several large and multiple avalanches have overrun such dams.
In 2008, we were able to observe a large wet-snow avalanche, characterized by an high water content, that in-teracted with a deflecting dam and overflowed it at its lower end. To evaluate the dam’s performance, we carried out an airborne laser scanning campaign immediately after the avalanche. This data, together with a video sequence made during the avalanche descent, provided a unique data set to study the dynamics of a wet dense snow avalanche and its flow behavior along a deflecting dam.
To evaluate the effect of the complex flow field of the avalanche along the dam and to provide a basis for discus-sion of the residual risk, we performed numerical simula-tions using a two-dimensional dense snow avalanche dynam-ics model with entrainment.
In comparison to dry dense snow avalanches, we found that wet-snow avalanches, with high water content, seem to be differently influenced by the local small-scale topogra-phy roughness. Rough terrain close to the dam deflected the flow to produce abrupt impacts with the dam. At the impact sites, instability waves were generated and increased the already large flow depths. The complex flow dynam-ics around the dam may produce large, local snow deposits. Furthermore, the high water content in the snow may de-crease the avalanche internal friction angle, inducing wet-snow avalanches to spread further laterally than dry-wet-snow avalanches.
Based on our analysis, we made recommendations for de-signing deflecting dams and for residual risk analysis to take into account the effects of wet-snow avalanche flow.
1 Introduction
Avalanche deflecting dams are often considered to reduce the vulnerability of endangered objects in the track and run-out zone of avalanches. However, dam design and the evalua-tion of the residual risk after a dam have been completed has been subject of discussion after the catastrophic winter 1999 in the Alps, when multiple avalanches overran dams, draw-ing attention to the limits of such protection measures (SLF, 2000).
In recent years, both laboratory experiments and theoreti-cal analysis have improved our understanding of the interac-tion of the flow of snow avalanches with dams and, conse-quently, new design criteria have been proposed on the ba-sis of jumps or shocks theories for fast dry-snow avalanches (H´akonard´ottir et al., 2003; Faug et al., 2007; Cui et al., 2007; J´ohannesson et al., 2009; Baillifard, 2007). Nevertheless, full-scale observations that might support these new find-ings are rare and have generally been of dry-snow avalanches (Harbitz and Doomas, 1997; J´ohannesson, 2001; Gauer et al., 2009).
Fig. 1. Gatschiefer avalanche of April 2008. On the left, release zones]1 and]2, deposit]1, and the upper flowing zone. On the right, main
deposit]2. The red circle indicates the dam location, the blue arrow the area where several trees were uprooted, and the red arrow the dam
overflow.
of wet-snow avalanches are considered in the design as well, typically by relying on expert judgement, but they cannot be treated in a quantitative manner since an adequate theory is lacking and the realistic calculation of flow depths and de-posit heights is still challenging.
The dynamics of wet-snow avalanches differ from those of dry-snow avalanches (Sovilla et al., 2008; Kern et al., 2009). They are slower than dry dense avalanches, but typically have larger flow depths and higher flow densities. Because of the low velocities and high flow depths, wet-snow avalanches generally interact with obstacles located in the run-out zone in a sub-critical flow regime (Sovilla et al., 2008). Recent investigations have shown that, in this flow regime, they can exert enormous forces in spite of their small velocities (So-villa et al., 2010a, 2008; Baroudi et al., 2011). Furthermore, their flow is strongly influenced by rugged topography; they may spread out laterally forming finger and following small terrain irregularities regardless of the original flow direction, and may have a long run-out in spite of their low velocities (Sovilla et al., 2008; Kern et al., 2009).
On 23 April 2008, we were able to observe a large, natural wet-snow avalanche in the Gatschiefer avalanche path and how it interacted with a deflecting dam (Fig. 1). Although the dam was designed to deflect large dry-snow avalanches, the observed slow moving wet-snow avalanche was able to
overflow it at its downward end. This event underscores the necessity to include this avalanche type in the design of de-flecting dams.
Studies of wet-snow avalanches are rather limited, as are those of interactions between full-scale avalanches and dams (J´ohannesson, 2001). The Gatschiefer avalanche was there-fore investigated in detail to obtain a better understanding of wet-snow avalanche dynamics and how such avalanches interact with protection structures. We performed a laser scanning campaign and the event was also filmed from the opposite side of the valley. The excellent data set on the Gatschiefer avalanche event was the starting point of our analysis. Methods of data collection and data are briefly described in Sect. 3, while the data analysis is presented in Sect. 4.
In the second part of this paper (Sect. 5), the Gatschiefer avalanche is back-calculated using a two-dimensional nu-merical model to elucidate the complex flow dynamics around the dam. The wet-snow avalanche was compared with calculation scenarios including a dry dense extreme avalanche and a simulation without a dam.
Fig. 2. Outlines of the 1999 avalanche (black dashes) and the 2008 avalanche (red line). The buildings in the blue circle were severely damaged in 1999, but those in the green circle (Brosi area) were not. Arrows indicate the main flow direction of the 1999 avalanche. The red dotted line on the left shows the local direction of the dam axis. Note that it also coincides with the 2008 avalanche main flow di-rection. The red dotted line on the right shows the maximum lateral spreading of the 2008 avalanche.
2 The avalanche deflecting dam
During the catastrophic winter 1999, a large avalanche from the Gatschiefer starting zone located in the Klosters region, Switzerland, reached several houses situated in the western part of the run-out zone and severely damaged two inhabited buildings (Fig. 2).
The deflecting dam “Usser Chinn” was constructed in 2003 to protect the two buildings. The planning of the dam was particularly challenging, because the dam should not in-crease the risk to the buildings uninhabited during the winter season, situated downstream of the dam (Fig. 2), and should preserve the high value grazing land in the avalanche run-out zone. Therefore, the dam axis was designed to have a small turn in a NNE-direction from 12◦ (upper part of the
dam) to 20◦(lower part of the dam), relative to the expected
main flow direction. The dam was designed for a 100-year scenario characterized by a velocity upstream the dam of 27 m s−1and a flow depth of 5.0 m (Schaer, 2000). Multiple avalanche events were not explicitly considered in the design of the dam and were accepted as residual risk.
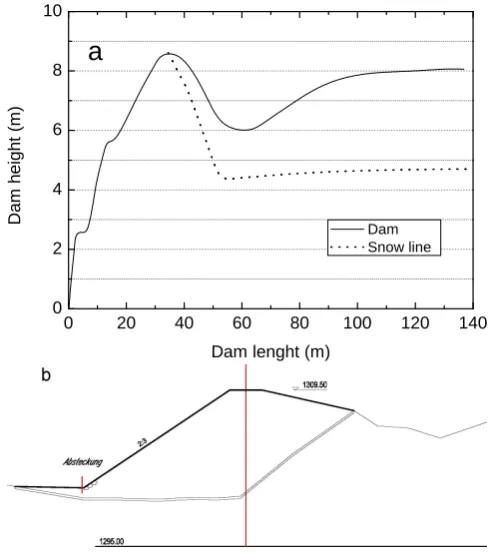
The approximately 6.0–8.5 m high and 140 m long deflect-ing dam (Fig. 3a) was built 50 m east of the two builddeflect-ings damaged in winter 1999, at the end of the confined avalanche
0 2 0 4 0 6 0 8 0 1 0 0 1 2 0 1 4 0
0
2
4
6
8
1 0
D
a
m
h
e
ig
h
t
(m
)
D a m l e n g h t ( m )
D a m S n o w l i n e
a
Fig. 3. The Gatschiefer deflecting dam. The upper panel is a sketch of the dam’s longitudinal profile. The avalanche flows from right to left. The dashed line indicates the highest flow mark left by the avalanche of April 2008. The lower panel shows a representative dam section (courtesy of Ing. Fromm).
track on a gently sloping terrain characterized by a mean slope of about 10–13◦. The deflecting dam was constructed as a simple embankment of well compacted earth. The up-stream side of the dam has a slope of 2:3 (Fig. 3b). The ter-rain above and along the dam contains deposits of material partly due to transport of debris by a small creek, descend-ing the avalanche slope and partly due to human activities (Fig. 4). A narrow and smooth channel was excavated on the upstream side of the dam with the goal to gently convey the avalanche along the dam and thus avoid speed reduction and consequent accumulation of snow. A walking path interrupts the channel continuity and locally decreases the slope angle. The height of the deflecting dam was calculated using the traditional equation (Salm et al., 1990; Norem, 1994):
Hdam=Hu+H+Hs, (1)
whereHuis the run-up height,His the thickness of the flow-ing dense core andHsis the thickness of the snow cover and previous avalanche deposits in front of the dam. The termHu was computed according to the equation:
Hu=
(Usinϕ)2
2gλ , (2)
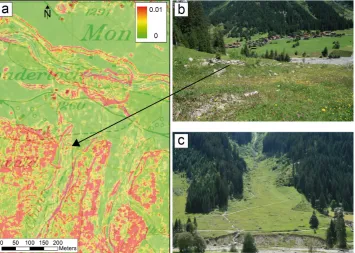
Fig. 4. Terrain features in the run-out zone. Panel (a) shows terrain roughness, as defined by Sappington et al. (2007), derived from a DTM with 2 m grid resolution. Panel (b) shows rock deposits situated beside the dam. Panel (c) is a view of the run-out zone.
gravitational acceleration and λ is an empirical parameter that describes the energy loss during the impact with the dam (Salm et al., 1990; Norem, 1994). A dry dense-flow with a re-turn period of 100 years was chosen as the design avalanche. Theλparameter was chosen to be 1, which means that no energy dissipations were taken into account.
3 Methods and data
3.1 Snow depth from airborne laser scanning
An airborne laser scanning survey was performed three days after the avalanche release. No precipitation had occurred in the meantime. The survey allowed the extraction of a high resolution, digital snow surface model. Measurements ex-tended over the entire avalanche path with a spatial resolu-tion of 0.5 m and a total vertical accuracy of±0.1 m. For more detailed information on airborne data acquisition for snow depth measurements, see, for example, Gruenewald and Lehning (2011), Lehning et al. (2011), Sovilla et al. (2010b), Prokop et al. (2008), and Buehler et al. (2009).
In order to measure the snow depth variability in the avalanche path, the snow surface of the area is generally mapped before (coordinatez1) and after the avalanche was triggered (coordinate z2). Thus, the net erosion and depo-sition can be calculated by subtracting these two depths di-rectly: hs=z1−z2(Sovilla et al., 2010b). In our case, the avalanche released spontaneously, which made it impossible
to measure the snow surface before the event. The calcu-lation of the snow depth,hs, was approximated by directly subtracting the summer digital terrain model coordinates,zs, from thez2coordinates.
Following this definition, in areas crossed by the avalanche, hs=hd+hsc, where hd is the depth of snow deposits left behind by the avalanche, and hsc is the snow cover depth that was not entrained. We assume that hsc is negligible. This approximation did not substantially affect our estimation of the release volumes, entrainment depth and avalanche trajectory (Sect. 4), but it may have had an influ-ence on the quantification of deposit depths.
At locations where the avalanche slid directly on the ground, hd∼=hs. However, in areas where the avalanche slid on the snow cover, this approximation may induce an overestimation of hd. This is particularly true for steep slopes, where hschd, especially above an elevation of 1750 m a.s.l. As Fig. 1 shows, the exposed terrain started ap-proximately at this elevation, where the avalanche flow split into two gullies. Above this limit, only some of the snow cover was entrained by the avalanche.
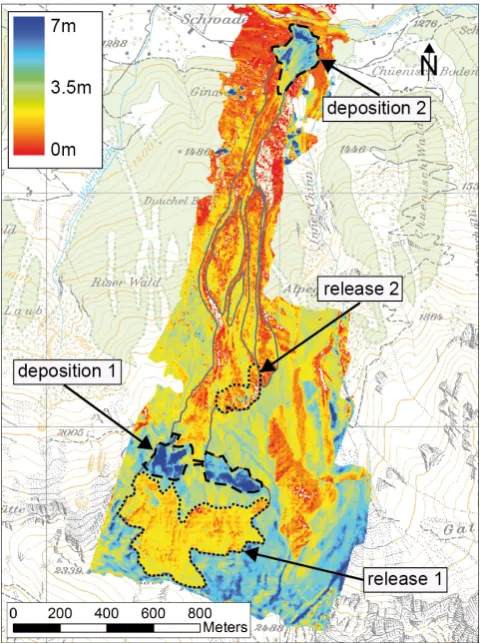
Fig. 5. Calculated snow depth,hsin the Gatschiefer avalanche track after the event of April 2008. Dotted contours show release zones]1 and]2, as well as deposits]1 and]2.
3.2 Video analysis
The Gatschiefer avalanche was filmed from the opposite side of the valley by a passing bus driver using a cell phone cam-era (the video can be seen on YouTube http://www.youtube. com/watch?v=kgY43LZ8o94). The video shows the run-out zone of the avalanche from an altitude of 1500 m a.s.l., where two flow channels converge, to an altitude of 1100 m a.s.l., corresponding to the valley bottom near the river Landquart (Fig. 6). The video was scanned every 10 s, and analyzed focusing on the avalanche fronts and roll wave propagation. Video frames were used to investigate the avalanche flow di-rection, its velocity, and the interaction with the deflecting dam (Sonatore, 2010).
3.3 Field observations
The deposit of the Gatschiefer avalanche was investigated immediately after the release. Attention was specially given to the snow traces left by the avalanche along the dam, which were documented in numerous pictures. Both the position of the dam crown and the snow line were measured using a GPS
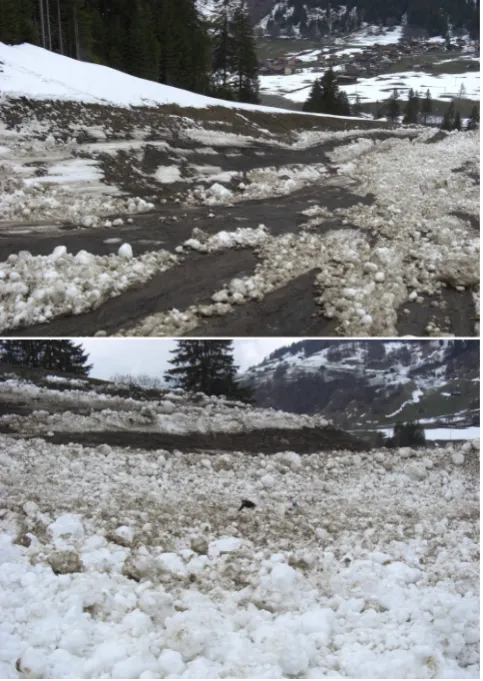
Fig. 6. Video frames of the Gatschiefer event of April 2008 (www. youtube.com). Upper panel: the avalanche was characterized by a series of roll waves. Middle and lower panels: the avalanche was probably characterized by a saturated snow-water mixture.
Table 1. The Gatschiefer avalanche mass balance.
Release Release Avg. fracture Release Estimated Release
area depth volume density mass
Ar] h] Vr] ρr Mr]
[]] [m2] [m] [m3] [kg m−3] [kg]
1 140 000 2.5 350 000 300 ≈105×106
2 20 400 1.6 31 640 300 ≈9.8×10⁶
1 + 2 160 400 – 381 640 300 ≈115×106
Deposit Deposit Avg. deposit Deposit Estimated Deposit
area depth volume density mass
Ad] hd] Vd] ρd Md]
[]] [m2] [m] [m3] [kg m−3] [kg]
1 54 600 3.55 194 000 400 ≈78×106
2 52 000 2.95 153 000 500 ≈77×106
1 + 2 106 600 – – – ≈155×106
Snow Potential Avg. entrain. Entrained Estimated Entrained
Entrainment erosion area depth volume density mass
APe he Ve ρe Me
[m2] [m] [m3] [kg m−3] [kg]
280 000 0.3 84 000 500 ≈42×106
0 5 10 15 20 25 30 35 40 45
0 1 2 3 4 5 6
Slope [°]
Snow depth [m]
0 5 10 15 20 25 30 35 40 45
0 200 400
Number of samples
measured modeled
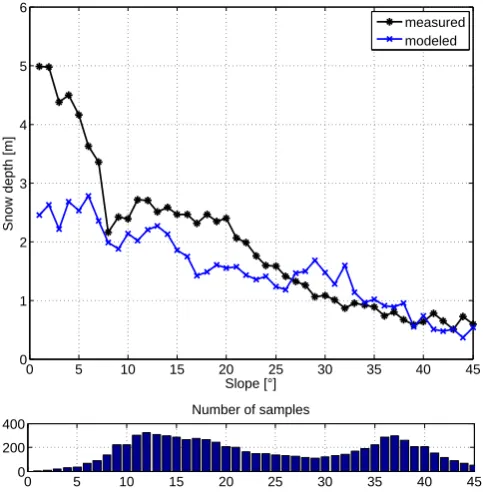
Fig. 7. Snow/deposition depth as a function of slope angle. The black line corresponds to measured snow depths,hs, while the blue
line refers to deposit depths,hd, from simulation]1. We assume
hs∼=hd. Note that, for steep slopes, this approximation may not hold, and thushdis probably overestimated (see Sect. 3.1).
4 Data analysis
4.1 The Gatschiefer avalanche and its mass balance
Two release areas were identified from laser scanning mea-surements (Fig. 5). Release zone]1 was situated in a partly vegetated area between 2100 and 2300 m a.s.l. The area was 140 000 m2with a mean inclination of 38◦. A much smaller release zone]2, located between 1900 and 2000 m a.s.l., had an area of 20 400 m2and a mean inclination of 42◦. Both areas released as a slab with an average fracture depth of ap-proximately 2.5 m (release ]1) and 1.6 m (release ]2) (Ta-ble 1). Release depths were estimated by subtracting the av-erage snow depth inside the release areas from the avav-erage snow depth in areas located outside the avalanche track but were close enough to the release areas to be representative.
Using the physical SNOWPACK model (Lehning and Fierz, 2008), we estimated the density in the release zone to be approximately 300 kg m−3.
Immediately below release]1, on a small terrain terrace, the avalanche deposited around 194 000 m3 of snow (de-posit]1 in Fig. 5). Assuming the densification of the snow ranged from 300 kg m−3 in the release zone to 400 kg m−3 in deposit]1, the deposited mass corresponds to≈70 % of release]1. Thus, only≈37×106kg of the snow from both release areas continued down into the track.
Fig. 8. Avalanche run-up along the side of the dam. Beside the dam, the ground is exposed and traces of glide are visible (upper panel). Far from the dam, deposition depths are up to 2–3 m on similar slope angles (lower panel).
entered a relatively wide, channeled and non-vegetated run-out segment with a mean slope of abrun-out 10–15◦. Two
mean-dering flow channels were observed at the beginning of this segment. However, the video revealed that the flow com-bined and then flowed with a regular, straight flow front, ex-tending across the entire 100 m wide channel (Fig. 6).
At the end of this track segment, on the left flow side of the channel, the avalanche struck the deflecting dam, overflow-ing it slightly at its downward end. The avalanche entered a forest stand about 100 m away from the dam. Several spruce trees (diameterd=0.60 m; age greater than 100 years) were fractured, overturned or uprooted by the slow moving mass (Fig. 1). The avalanche did not reach the river Landquart, but it did descend the steep banks about 150 m beyond the end of the dam, where it stopped. The maximum width of the deposit was about 150 m.
It is interesting to note that this avalanche was character-ized by a high water content and, at least in the run-out zone, the flow was probably close to saturation. Figure 6, the
mid-dle panel, shows a slush front reaching the steep bank. The high water content in avalanches lowers the internal friction angle of snow, which has important consequences for the flow dynamics. This is most probably the case presented here.
From laser scanning measurements, the estimated volume of the lower deposition (deposit]2) was 153 000 m3. Assum-ing a deposit]2 density of 500 kg m−3due to snow densifi-cation along the avalanche path, the mass of deposit]2 was ≈77×106kg. Thus, the avalanche approximately doubled its mass between the entrance into the gulleys to the tip of the run-out. Assuming a potential erosion area of 280 000 m2, this would correspond to the entrainment of≈0.3 m of snow with a density of 500 kg m−3, uniformly distributed all over the flowing and run-out areas (Sovilla et al., 2006).
4.2 Avalanche deposit depths and surface morphology
Figure 7 shows the average snow depths,hs, as a function of the slope angle for the Gatschiefer avalanche. If we assume in a first approximation thaths∼=hd(Sect. 3.1), we see that deposit depths are negatively correlated with the slope angle (for a similar analysis, see Sovilla et al., 2010b).
The Gatschiefer avalanche deposited on average∼4 m of snow on areas less inclined than ∼10◦. On slopes of 10– 13◦, which correspond to the terrain inclination in front of the dam, the average deposition depth was of≈2.5–3 m. In-terestingly, this average distribution does not correspond to the deposition depth directly measured at the dam location. At the dam, deposition was located only toward the dam tip where snow accumulated up to≈8 m, while a large icy, glid-ing zone, with practically no accumulation, formed in the upper part of the narrow and smooth channel (Fig. 8).
Furthermore, the deposition morphology was character-ized by numerous levees. Their characteristic pattern is eas-ily recognizable: lateral static edges corresponding to the borders of the flow, and a central zone, generally lower in depth, corresponding to the flow drainage. The levees con-sisted of large snow clods covered with dirt on each border of the flow and at a few points in the drainage channel, the gliding surface was exposed (Bartelt and McArdell, 2009).
a
b
Fig. 9. Panel (a) shows hillshade of the lower deposition zone of the Gatschiefer avalanche from laser scanning measurements. The flow direction is highlighted by the presence of numerous levees. Panel (b) shows a comparison between flow lines (dashed red lines) and the direction of the steepest descent (blue lines). The boundaries of the 1999 and 2008 avalanches are also shown.
4.3 The avalanche front and roll wave velocities
The avalanche flow was characterized by a main front fol-lowed by a series of surges (Fig. 6). Front and surge veloc-ities in the run-out and deposition zones were deduced from video sequences taken every 10 s. The first front entering the run-out zone we refer to as front]1 (Fig. 10, upper panel). It was followed by numerous roll waves (Fig. 6), some of which disappeared before reaching the main front, while oth-ers flowed slightly faster than the front]1, catching up to it and merging with it before it hit the dam.
Roll waves are large-amplitude disturbances that tend to develop in turbulent water flow, but also in a variety of grav-ity currents such as mud or granular flows. The presence of such perturbations may substantially change the flow depth and thus affect practical applications (Balmforth and Man-dre, 2004). In our case study, we found that the roll wave for-mation was related to the failure of natural, temporary dams generated at topographic discontinuities at the flow bound-ary (Forterre and Pouliquen, 2003; Zanuttigh and Lamberti, 2007).
In the lower part of the track, we observed two main to-pographic sources of surges. The first source was located toward the end of the dam, where the flow was strongly de-flected from its initial direction (pointAin Fig. 10, lower panel). The first impact with the deflecting dam led to the accumulation of snow and the formation of two additional waves that overtook front]1 and spread laterally to the right,
in a NE direction towards the forest. These new fronts were named front]A1 and front]A2 (Fig. 10, lower panel). The most advanced avalanche front (front]0) was the result of the merging of fronts]1,]A1 and]A2. It is marked in Fig. 10, upper panel, in blue.
The second topographic surge source was located on the right of the channel (pointB in Fig. 10, lower panel). The main roll wave fronts generated by this topographic discon-tinuity were named as fronts]B1 and]B2. The frontsAand B had an approximate wavelength of 20–30 m. We could not estimate the wave amplitude directly, because the picture quality of the video recording was not good enough. Never-theless, snow traces left along the dam embarkment by the frontAsuggest that the flow depth of the avalanche doubled at the place where the roll waves appeared (pointAin Fig. 10, lower panel).
The velocity was calculated along two longitudinal pro-files from the outset of the run-out zone, where the two veg-etated gullies converged (Fig. 10, upper panel). The red lon-gitudinal profile in Fig. 10, upper panel, refers to front]1 and represents the flow velocity on the far side of the deflect-ing dam. The blue longitudinal profile marks the intersection with front ]0 and symbolizes the flow velocity next to the dam.
100 s
80 s
60 s
120 s
B
A
Front #A1 Front #A2 Front #B1 Front #B2
Avalanche boundaries 2008 Deflecting dam
Fig. 10. The upper panel shows avalanche front locations at 10 s intervals according to the video sequences. The blue lines show the time position of the most advanced avalanche front (front]0), while
the red dashed lines show the time position of front]1. The lower
panel shows the time position of the most relevant roll waves. These waves are generated at topographic discontinuities.
progressively accelerated again to reach a maximum veloc-ity of≈9 m s−1. When the avalanche reached the deflecting dam, its velocity was≈8 m s−1. It then progressively decel-erated to a minimum velocity of about 2 m s−1, and, there-after, traveled at an approximately constant velocity. The avalanche crossed the road near the Landquart river, sliding down as far as the riverbed before it finally stopped. After the impact with the dam, no significative differences between the velocities along the two profiles were observed (Fig. 11).
4.4 Avalanche flow depth, run-up depth and snow cover deposit depth at the dam
The maximum height reached by the avalanche along the dam could be deduced from the traces left by the flow on the dam embankment (Fig. 8). Both the position of the dam crown and the snow line were measured using a GPS re-ceiver. A schematic view of the dam crown and snow line are shown in Fig. 3. Snow traces indicated that flow depths were more than 4–5 m. Toward the lower end of the dam, the flow depth increased abruptly up to 8.5 m. Here, part of the avalanche mass overran the dam and stopped close to the houses in the Brosi area (Figs. 1 and 2).
Equation (1) suggests that the maximum influence height of an avalanche interacting with a deflecting dam may be given by the sum of three different factors: the snow cover depth and former avalanche deposits,Hs, the run-up height, Hu, and the avalanche core depthH. Figure 8 shows evi-dence that the avalanche glided directly on the ground and it entrained all snow cover in front of the dam. At the location of the dam, snow cover depth, measured with laser scanning, varied from 0.3 to 0.5 m. Furthermore, we did not observe previous avalanche deposits. Thus, in this case, the termHs was small.
The avalanche reached the dam with a velocity of about 8 m s−1. Assuming a flow depth of 5 m and dam deflecting angles of∼30◦using Eq. (2), we would expect a maximum run-up height of about 0.8 m toward the dam tip. Thus, the run-up heightHuwas not relevant in this case and could not explain the sudden increase in flow depth toward the end of the dam. Moreover, the Froude number just before impact was around 1 (withU=8 m s−1andH=5 m), while on ap-proach to positionAin Fig. 11, it rapidly decreased to 0.6 (withU=4 m s−1andH=5 m). This, respectively, is the source location of the roll waves. Thus, the avalanche ap-proached the dam dominantly in sub-critical flow condition.
Interestingly, the point where the avalanche abruptly in-creases its flow depth, from 4–5 m to 8.5 m, approximately corresponds to the location of roll waves generation (Fig. 10, lower panel). This suggests that roll waves may have played a role in the dam overflow by increasing the avalanche flow depth by a factor of two.
0 1 0 0 2 0 0 3 0 0 4 0 0 5 0 0 0 1 2 3 4 5 6 7 8 9 1 0 Α
α≈30°
V e lo c it y ( m s -1 )
Projected distance (m) Front #1
Front #0
α≈10°
Fig. 11. Avalanche front velocities according to the longitudinal profiles shown in Fig. 10, upper panel. The axis origin corresponds to the run-out begin, located at an altitude of 1370 m a.s.l. The red line shows the average velocity of front]1, while the blue line shows the average velocity of front]0. Vertical dotted lines indicate
the dam location. The dam deviation angle,α, is also shown. A
indicates the source location of the roll waves.
5 Numerical avalanche dynamics simulations
5.1 Avalanche dynamics model
We performed numerical simulations using RAMMS (Rapid Mass Movements) to better interpret the field data and to evaluate the effects of the complex flow field around the de-flecting dam. We also wanted to provide an accurate pre-diction of the residual risk of avalanche run-out in terms of varying distances and lateral spreading. RAMMS is a two-dimensional dense snow avalanche dynamic model with mul-tilayered entrainment, based on the 2-D shallow water equa-tions. It is routinely used in Switzerland to calculate snow avalanche run-out and flow velocities. A detailed presenta-tion of the model and case studies are given in Christen et al. (2010a,b).
The model describes the avalanche mass balance by solv-ing the followsolv-ing equation:
∂tH+∂x(H Ux)+∂y(H Uy)= ˙Q(x,y,t ) (3)
where H (x,y,t ) denotes the avalanche flow height, and
Ux(x,y,t ), andUy(x,y,t )the mean avalanche velocity
com-ponent in the x- and y-directions, respectively. For details on the coordinate system, see Christen et al. (2010a,b). The right-hand side of Eq. (3) represents the volumetric snow en-trainment rate ifQ(x,y,t ) >˙ 0 or the snow deposition rate if
˙
Q(x,y,t ) <0.
The momentum balance equations are
∂t(H Ux)+∂x H Ux2+gz
H2
2
!
+∂y(H UxUy)=Sgx−Sfx (4)
and
∂t(H Uy)+∂y H Uy2+gz
H2
2
!
+∂x(H UxUy)=Sgy−Sfy (5) wheregx andgy are the gravitational acceleration compo-nents in the x- and y-directions. On the right-hand side, Sgx=gxH andSgy=gyH denote the driving acceleration forces andSfxandSfydenote frictions.
RAMMS include an entrainment module that takes into account the snow mass entrained along the avalanche track. Entrainment is modeled using a rate-controlled approach, proportional to the avalanche velocity,U, which allows regu-lations of both the mass uptake and the time delay required to accelerate the mass to the avalanche velocity (Christen et al., 2010b). In RAMMS, the erodible snow cover can be defined as ann-layered snowpack, wherehesiandρesiare the height and density of thei-th snow layer (Sovilla et al., 2006). The entrainment rateQ(x,y,z)˙ is given by
˙
Q(x,y,t )=
0 for
h
hes(x,y,0)−R0tQ(x,y,τ )dτ˙
i =0
ρesi
ρ kiUfor
h
hes(x,y,0)−R0tQ(x,y,τ )dτ˙
i >0(6)
where ki is the dimensionless entrainment coefficient that characterizes the resistance of each snow layer, and ρ the avalanche density. By varyingkit is possible to reproduce different erosion mechanisms. Typically, ifk >1, the snow cover is entrained almost instantaneously as in ploughing en-trainment, where all snow at the avalanche front is entrained immediately. Ifk <0.5, the snow cover is slowly entrained as in basal erosion, where snow is gradually scraped from the snow cover surface (Sovilla et al., 2006).
To describe the frictional deceleration forcesSfx andSfy in the x- and y-directions, we used the Voellmy-Salm model (VS), which combines dry Coulomb friction (coefficientµ) with a velocity-squared dependent turbulent friction (coeffi-cientξ[m s−2]) (Salm, 1993; Voellmy, 1955):
Sfx=
Ux
q
U2
x+Uy2
"
µgzH+
g(Ux2+Uy2)
ξ #
(7)
and
Sfy=
Uy
q
U2
x+Uy2
"
µgzH+
g(Ux2+Uy2)
ξ #
(8)
The fundamental VS model assumption is that shear de-formations are concentrated near the basal sliding surface. This assumption is in agreement with measured shear rates in wet-snow avalanche flow, which indicate that wet-snow avalanches are characterized by slow, plug flow which over-rides a highly sheared basal layer (Kern et al., 2009; Sovilla et al., 2008).
avalanches, which are characterized by a strongly sheared velocity profile and large fluctuations in velocity between the head and the tail of the avalanche. Validations of model sim-ulations against real-scale data reveal that, in this case, the VS model cannot reproduce the complex evolution of ve-locity over the entire avalanche length (Bartelt and Buser, 2010). The model does not correctly describe the distribu-tion of mass within the avalanche body, nor the distribudistribu-tion of mass deposited along the avalanche path (Sovilla et al., 2010b). Because the rheology of wet-snow avalanches dif-fers from that of dry dense snow avalanches, we expect this problem to be different, but it is not clear whether the model is more or less suitable for wet-snow avalanches than for dry-snow avalanches.
Second, the numerical procedure in the RAMMS model is shock capturing, but the VS model does not take into account the loss of momentum during the impact of the avalanche with the dam. Again, while this aspect may be very important for dry dense snow avalanches, we expect less energy dissi-pation during impact with wet-snow avalanche flow, because it is more dense and thus less compressible (J´ohannesson et al., 2009).
5.2 Input parameters
To perform the Gatschiefer avalanche simulations, we had to provide first a digital elevation terrain model (DTM) with a sufficient spatial resolution (Buehler et al., 2011). To correctly reproduce the dam contour and the rough terrain around the dam, we chose a DTM with 2 m grid resolution. The release zones]1 and]2 were specified by polygons de-rived from laser scanning.
RAMMS does not take into account the snow densifica-tion occurring in the flowing avalanche as it moves down-ward. Thus, we chose a representative average calculation density. As our primary interest was to obtain for the area around the dam a snow volume as close as possible to that in the real case scenario, we assumed a calculation density of 500 kg m−3and converted release and erosion input snow volumes accordingly.
Accurate predictions of flow depths and snow deposits along the path are crucial to analyze the effects of the de-flecting dam. However, obtaining the correct mass balance is not a trivial task since both erosion and deposition processes play a fundamental role, but are difficult to model (Sovilla et al., 2006, 2010b). In our calculations, the erodible snow-pack was defined as a layer with a heighthes=0.40 m and densityρes=500 kg m−3. The entrainment rate, which is de-fined by the dimensionless parameterk, was assumed to be 0.75, which corresponds to a slow entrainment of the snow cover as in the basal erosion mechanism (Sovilla et al., 2006). Figure 12 on the left shows the erosion domain as defined in a typical simulation, while on the right erosion details cor-responding to the Gatschiefer back-calculation are given. We can observe that the simulated avalanche entrained the whole
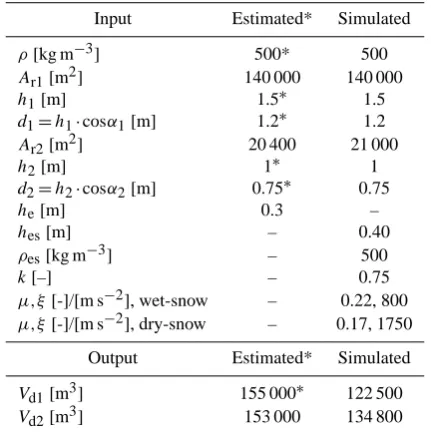
Table 2. Simulation parameters and calculated mass balance. The
symbol∗indicate parameters whose original value, in Table 1, has
been converted using a constant density of 500 kg m−3.
Input Estimated* Simulated
ρ[kg m−3] 500* 500
Ar1[m2] 140 000 140 000
h1[m] 1.5∗ 1.5
d1=h1·cosα1[m] 1.2∗ 1.2
Ar2[m2] 20 400 21 000
h2[m] 1∗ 1
d2=h2·cosα2[m] 0.75∗ 0.75
he[m] 0.3 –
hes[m] – 0.40
ρes[kg m−3] – 500
k[–] – 0.75
µ,ξ[-]/[m s−2], wet-snow – 0.22, 800
µ,ξ[-]/[m s−2], dry-snow – 0.17, 1750
Output Estimated* Simulated
Vd1[m3] 155 000∗ 122 500
Vd2[m3] 153 000 134 800
snow layer with the exception of some snow at the location of deposit]1 and deposit]2, where low velocities imply smaller entrainment rates. An overview of all input parameters used for the VS simulations is given in Table 2.
5.3 Gatschiefer avalanche simulations
We performed three simulations:
– Simulation]1: back-calculation of the Gatschiefer wet-snow avalanche. The simulation was performed to im-prove the data interpretation. Input parameters were set as close as possible to the real event. Friction parame-ters were set constant along the track and chosen to fit the observed velocity and run-out distance (Table 2). – Simulation]2: back-calculation of the Gatschiefer
wet-snow avalanche, without the dam. The simulation was run on a modified DTM, reproducing the topography during winter 1999 to better evaluate the dam influence on the flow dynamics. Input parameters were set as in simulation]1 (Table 2).
– Simulation]3: extreme dry dense avalanche. This sim-ulation was performed to investigate differences in be-havior between wet- and dry dense avalanche flow. In-put parameters were set as in the previous simulations, but the friction parameters were chosen to represent an extreme dry dense avalanche event with a return period of 100 years (Table 2, Christen et al., 2010b).
Fig. 12. On the left: erosion domain. The erodible snowpack was defined as a layer of heighthes=0.40 m, densityρes=500 kg m−3and
k=0.75. On the right: back-calculation of the Gatschiefer avalanche. The avalanche entrained most of the erodible snowpack with the
exception of a little snow under deposition]1 and]2.
measured front velocities are compared. Both the simulation and data refer to the longitudinal profiles reported in Fig. 10, upper panel. Maximum velocities along the path are gener-ally overestimated by the model, but they reproduce well the deceleration around the dam. The simulation does not repro-duce the avalanche deceleration at the run-out onset. More-over, the model does not predict any relevant velocity varia-tions between the two profiles, which thus suggests that the dam had little influence on the overall avalanche maximum velocity.
At the dam, simulated maximum velocities are reached at the avalanche front, while the model predicts a flow decel-eration in the avalanche body (Fig. 14, on the left). This deceleration favors both an increase in flow depth at the dam (Fig. 13b) and the formation of a large deposit just in front the dam (Fig. 13c, and Fig. 14, on the right). The maximum flow depth calculated at the tip of the dam corresponds to the measured snow line.
In Fig. 15 the laser scanning measurements and simulated deposits are compared. The volumes and approximative lo-cations of deposits]1 and ]2 are similar to those recorded in the laser scanning measurements (Table 2), but the depen-dency between the slope angle and the deposition depth dif-fers. The average deposit depths are displayed in Fig. 7 as a function of slope for both simulation]1 and measurements. The model underestimates deposit depths for slopes with an incline less than ∼25◦ and overestimates them on steeper slopes (see also Sect. 3.1), i.e. the simulated avalanche pre-dicts more mass on deposits in steeper slopes than occurs in reality.
Furthermore, simulation]1 predicts a large deposition at the dam location with only little mass reaching the Landquart river, which is not in agreement with observations (Fig. 16). Moreover, the simulations underestimate the lateral spread-ing in the direction of the forest.
In Fig. 17 simulations]1 and]2 are compared at the dam site. Maximum flow depths from simulation ]2 (without dam) are only 1–2 m lower than in simulation]1 (with dam), but velocity and lateral spreading are similar in both simula-tions.
Finally, in Fig. 18 simulations]1 and]3 are compared at the dam site. Figure 18 displays screen shots of the sim-ulations, showing the arrival of the avalanche at the dam. The velocity fields and corresponding flow depths for the two case scenarios differ considerably. In particular, snow depths along the dam are smaller for the dry dense flow simulation, probably due to the small-scale topographic roughness be-side the dam (Fig. 4), which deflected the slow avalanche toward the dam, but prevented the fast avalanche from reach-ing the dam. Simulation]3 is also not able to reproduce the correct lateral spreading.
6 Discussion
0 5 0 1 0 0 1 5 0 2 0 0 2 5 0 3 0 0 3 5 0 4 0 0 4 5 0 0 2 4 6 8 1 0 1 2 1 4 1 6 1 8
α≈30°
V e lo c it y ( m s -1 )
Projected distance (m) data prof.#0 data prof.#1 calculation prof. #0 calculation prof. #1
α≈10°
a
2 0 0 2 5 0 3 0 0 3 5 0 4 0 0
0 2 4 6 8 1 0 F lo w / D a m h e ig h t (m )
P r o j e c t e d d i s t a n c e ( m ) d a m
d a t a s n o w l i n e c a l c u l a t i o n p r o f . # 0 c a l c u l a t i o n p r o f . # 1
b
2 0 0 2 5 0 3 0 0 3 5 0 4 0 0
0 2 4 6 8 1 0
c
D e p o s it h e ig h t (m )P r o j e c t e d d i s t a n c e ( m ) d a t a p r o f . # 0
d a t a p r o f . # 1 c a l c u l a t i o n p r o f . # 0 c a l c u l a t i o n p r o f . # 1
Fig. 13. Simulation]1. In panel (a), simulated maximum veloc-ities are compared to measured front velocveloc-ities, in panel (b), sim-ulated maximum flow depths to the snow line at the dam location and in panel (c), simulated deposit heights to laser scanning mea-surements. Velocity, flow and deposition depths refer to the profiles drawn in Fig. 10, upper panel. Vertical dotted lines indicate the dam location.
Fig. 14. Simulation]1. Screen shot of a velocity field around the dam (left) and the corresponding flow depth (right). The model predicts that the avalanche body will decelerate during the impact with the dam and a large deposit will form. The avalanche impacts the dam at a sharp inclination angle.
video analysis, we observed that the flow jammed at the to-pographic discontinuity pointAin Fig. 10, lower panel, ap-proximately located where the dam slightly turns in a NNE direction. Here, a series of instability waves were gener-ated, which increased the local flow depth and caused the dam overflow.
Simulation]1 suggests the snow accumulation inAwas the result of a local deceleration of the flow due to an in-crease in the effective dam deflecting angle (Fig. 14). We estimated that the impact of the avalanche was toward the lower end of the dam, at an angle of∼=30◦. The dam was, however, designed to deflect a flow of 20◦. Interestingly, this deflecting angle approximately coincides with the an-gle derived by comparing the outlines of the 1999 and 2008 avalanches (Fig. 2).
The change in the expected direction of the relatively slow wet-snow avalanche was probably caused by the local small-scale topographic roughness (Fig. 4) of the terrain beside the dam. If, however, the avalanche had been faster, the same topography may well have played a protective role and have deflected the avalanche away from the dam (Fig. 18). This underscores the importance of both small-scale topographic roughness, previous avalanche deposits and avalanche veloc-ity in predicting the impact of an avalanche. Furthermore, it suggests that fast avalanches are not necessarily the most hazardous, especially in situations with a small deflecting angle.
Fig. 15. Comparison between the measured snow depth,hs(left)
and the deposit depths, hd, obtained from simulation]1 (right).
The simulation reproduces the approximative location and volume of deposits]1 and]2, but it fails to reproduce the correct correlation between the slope angle and deposition depth (Fig. 7).
and 2008 avalanches, we found that the dam shifted the whole avalanche body by about 25◦ in a NE direction to-wards the forest by changing the flow direction up to 45◦, with respect to the topography steepest descent.
Finally, simulations with dam, ]1, and without dam, ]2, are shown in Fig. 17. There is considerably more overflow in simulation]2 and the thickness of the deposit on the down-stream side of the dam is greater than in simulation]1. How-ever, run-out distance and velocities in NNE-direction, in re-spect to the dam, are similar.
None of the simulations we performed were able to re-produce the observed lateral spreading (Fig. 16), which is surprising because numerical models normally overestimate avalanche spreading due to numerical diffusion (Christen et al., 2010b), nor could they reproduce the deposit distri-bution. The primary reason for this is probably the water content in wet-snow avalanches, which lowers the internal friction angle of snow, but is not taken into account in the simulations. The video of the Gatschiefer avalanche showed the avalanche acting as a quasi-fluid mass. It formed numer-ous roll waves and finally released a saturated snow-water mixture when it reached the river.
We speculate that water, probably squeezed out from the wet-snow during the descent of the avalanche, may percolate through the granular structure and collect at the base of the flow, generating a layer of saturated snow. This layer may work as a lubricant and make the avalanche extremely mo-bile in spite of its low velocity. The presence of icy sliding surfaces formed during the avalanche descent may also be an indication that there was free water that froze as soon as it was exposed at the surface.
7 Conclusions
Information about wet-snow avalanche flow and its interac-tion with a deflecting dam was obtained from laser scanning measurements, video analysis and numerical calculations. Our analysis shows how wet avalanche flow may have impli-cations for dam design and for the evaluation of the residual risk. In particular,
– the small-scale roughness (within 1–2 m) in the terrain beside the dam had considerable influence on the flow dynamics. The roughness effect on the flow direction, however, depends on the incoming flow velocity. The highest velocities are not necessarily decisive for the design of a deflecting dam. Both slow and fast mov-ing avalanches should be taken into account. This also means that an appropriate DTM model that captures any significative terrain roughness should be used as an in-put for the avalanche dynamics calculations (Buehler et al., 2011).
– the velocity of the avalanche we studied was very low, which means the calculated run-up height produced by a wet-snow avalanche (Hu∼=0.8 m for the avalanche of 2008) on a dam may be negligible in comparison with that of an extreme dry dense snow flow (Hu∼=4.3 m for an avalanche with 100 year return period) accord-ing to Salm et al. (1990). On the other hand, wet-snow avalanches tend to have larger flow depths, which may be further increased if roll waves are formed. The flow depth along the dam was nearly doubled due to the com-bined effects of surface roughness and roll wave forma-tion. Furthermore, a slow velocity alongside the dam may favor deposition, which would lead to a further in-crease in the risk of an avalanche overrunning the dam. These findings are especially relevant for the design of deflecting dams with small deflection angles situated in sections of the avalanche path with small slopes. – the slope at the dam location has an influence on
deposition depth. The relationship between deposit depth and slope differs markedly with wet- and dry-snow avalanches. If the deposition depth of previous avalanches must be taken into account, this distinction should be carefully considered.
– wet-snow avalanches, characterized by a high water content and low internal friction angle, may spread lat-erally over large terrain portions. They may thus reach areas that dry dense snow flow cannot reach. Particu-lar attention should be paid to assess the residual risk at the lateral end of the hazard zones. This conclusion confirms similar observations from J´ohannesson et al. (2009).
Fig. 16. Deposit]2. Comparison between the measured snow depth,hs(left) and the deposit depths obtained from simulation]1 (center). The right panel shows differences between the measured and simulated depths. The simulation overestimates the deposition depths at the dam.
N
N
7m
0m
+2m
-2m 0m
15m/s
0m/s
+10m/s
-10m/s 0m
a
b
c
d
e
f
Fig. 17. Comparison between simulations]2, without dam, and]1, with dam. Panels show: maximum flow depth from simulation]2 (a);
maximum flow depth from simulation]1 (b); difference between (a) and (b) (c); maximum velocity from simulation]2 (d); maximum
N
N
7m
0m
20m/s
0m/s
+40m/s
-10m/s 0m
a
b
c
d
Fig. 18. Comparison between simulations]1 and]3. Panels show the arrival of the avalanche at the dam. Panels (a) and (b) show screen shots of the simulated flow depth for wet- and dry-snow avalanches, respectively, while panels (c) and (d) show the corre-sponding velocity fields.
solely on the impact of fast flowing dry-snow avalanches. The effects of wet-snow avalanches on flow depth, deposition height, and roll wave formation should be also considered.
Several processes need to be further investigated to im-prove the design of deflecting dams. In particular, we need to find out more about the complex rheology of wet snow flow and how this can influence frictional interactions with the terrain and lateral spreading. Finally, understanding of roll wave development needs to be improved in order to be able to better predict their occurrence, depth and velocity.
Airborne laser scanning proved to be an effective tech-nique to gather detailed information about the extent, run-out distances, deposition heights and general flow behavior of an avalanche. The estimated accuracy of the measurements in the deposition zone (about 0.1 m) allowed a detailed study of the interaction of the avalanche with the dam and we recom-mend using this technique to collect additional data in future research.
Acknowledgements. Part of the funding for this research was provided by the Swiss Federal Office for the Environment (FOEN) and by the Office for Forest, Natural Hazards section, of Canton Grisons. The authors would like to thank the avalanche dynamics team for their support in the field campaign, Ing. Fromm for pro-viding the technical information on the dam design, Perry Bartelt, Christian Wilhelm, Arthur Sandri for the interesting discussion, Dr. Silvia Dingwall for the editing of the English text, G. Crosta for the supervision on a part of this work and T´omas J´ohannesson and an anonymous reviewer for their constructive feedback on this work.
Edited by: J. M. Vilaplana
Reviewed by: T. Faug and another anonymous referee
References
Baillifard, M.-A.: Interaction between snow avalanches and catch-ing dams, Ph.D. thesis, ETHZ, Z¨urich, 2007.
Balmforth, N. and Mandre, S.: Dynamics of roll waves, J. Fluid Mech., 514, 1–33, 2004.
Baroudi, D., Sovilla, B., and Thibert, E.: Effects of flow regime and sensor geometry on snow avalanche impact pressure mea-surements, J. Glaciol. 57, 1–12, 2011.
Bartelt, P. and Buser, O.: Frictional relaxation in avalanches, Ann. Glaciol., 54, 121–130, 2010.
Bartelt, P. and McArdell, B. W.: Granulometric investigations of snow avalanches, J. Glaciol., 55, 829–833, 2009.
Buehler, Y., Hueni, A., Christen, M., Meister, R., and Kellenberger, T.: Automated detection and mapping of avalanche deposits us-ing airborne optical remote sensus-ing data, Cold Reg. Sci. Tech-nol., 57, 99–106, 2009.
Buehler, Y., Christen, M., Kowalski, J., and Bartelt, P.: Sensitivity of snow avalanche simulations to digital elevation model quality and resolution, Ann. Glaciol. 52, 72–80, 2011.
Christen, M., Bartelt, P., and Kowalski, J.: Back calculation of the in den arelen avalanche with ramms: Interpretation of model re-sults, Ann. Glaciol., 51, 161–168, 2010a.
Christen, M., Kowalski, J., and Bartelt, P.: RAMMS: Numerical simulation of dense snow avalanches in three-dimensional ter-rain, Cold Reg. Sci. Technol., 63, 1–14, 2010b.
Cui, X., Gray, J., and J´ohannesson, T.: Deflecting dams and the for-mation of oblique shocks in snow avalanches at Flateyri, Iceland, J. Geophys. Res., 112, F04012, doi:10.1029/2006JF000712, 2007.
Faug, T., Naaim, M., and Fourri´ere, A.: Dense snow flowing past a deflecting obstacle: An experimental investigation, Cold Reg. Sci. Technol. 49, 64–73, 2007.
Forterre, Y. and Pouliquen, O.: Long-surface-wave instability in dense granular flows, J. Fluid Mech., 486, 21–50, 2003. Gauer, P., Lied, K., and Kristensen, K.: Analysis of avalanche
mea-surements out of the runout area of NGI’s full-scale test-site Ryg-gfonn, Cold Reg. Sci. Technol., 57, 1–6, 2009.
Gruenewald, T. and Lehning, M.: Altitudinal dependency of snow amounts in two small alpine catchments: can catchment-wide snow amounts be estimated via single snow or precipitation sta-tions?, Ann. Glaciol., 52, 153–158, 2011.
dam experiments with snow: A study of the airborne jet, Surv. Geophys. 24, 543–554, 2003.
Harbitz, C. B. and Doomas, U.: Mapping of natural deflecting dams. Tech. Rep. Report 581210-2, Norwegian Geotechnical In-stitute, Oslo, 1997.
J´ohannesson, T.: Run-up of two avalanches on the deflecting dams at Flateyri, north-western Iceland, Ann. Glaciol., 32, 350–354, 2001.
J´ohannesson, T., Gauer, P., Issler, D., and Lied, K.: The design of avalanche protection dams, Tech. rep., Report of the European commission, 2009.
Kern, M. A., Bartelt, P., Sovilla, B., and Buser, O.: Measured shear rates in large dry and wet snow avalanches, J. Glaciol., 55, 327– 338, 2009.
Lehning, M. and Fierz, C.: Assessment of snow transport in avalanche terrain, Cold Reg. Sci. Technol., 51, 240–252, doi:10.1016/j.coldregions.2007.05.012, 2008.
Lehning, M., Gr¨unewald, T., and Schirmer, M.: Mountain snow dis-tribution governed by elevation and terrain roughness, Geophys. Res. Lett., 38, L19504, doi:10.1029/2011GL048927, 2011. Norem, H.: Snow engineering for roads, Tech. rep., Norwegian
Public Roads Administration, Oslo, 1994.
Prokop, A., Schirmer, M., Rub, M., Lehning, M., and Stocker, M.: A comparison of measurement methods: terrestrial laser scan-ning, tachymetry and snow probing for the determination of the spatial snow depth distribution on slopes, Ann. Glaciol., 49, 210– 216, 2008.
Salm, B.: Flow, flow transition and runout distances of flowing avalanches, Ann. Glaciol., 18, 221–226, 1993.
Salm, B., Burkard, A., and Gubler, H. U.: Berechnung von Fliess-lawinen: eine Anleitung fuer Praktiker mit Beispielen, Mittlg. No. 47, Eidg. Institut f. Schnee- und Lawinenforschung, 7260 Davos Dorf, Switzerland, 1990.
Sappington, J., Longshore, K., and Thomson, D.: Quantifiying landscape ruggedness for animal habitat anaysis: A case study using bighorn sheep in the mojave desert, J. Wildl. Manage., 71, 1419–1426, 2007.
Schaer, M.: Lawinenschutz Usser Chinn, Klosters-Serneus (GR), Tech. Rep. G2000.18, WSL Institute for Snow and Avalanche Research SLF, 2000.
SLF: Der Lawinenwinter 1999, Ereignisanalyse, Eidg. Institut f. Schnee- und Lawinenforschung, 7260 Davos Dorf, Switzerland, 2000.
Sonatore, I.: Laserscanning data analysis and numerical simulation of wet avalanche interacting with a deflecting dam, Master’s the-sis, University of Milano-Bicocca, 2010.
Sovilla, B., Burlando, P., and Bartelt, P.: Field experiments and numerical modeling of mass entrainment in snow avalanches, J. Geophys. Res., 111, F03007, doi:10.1029/2005JF000391, 2006. Sovilla, B., Schaer, M., Kern, M., and Bartelt, P.: Impact pres-sures and flow regimes in dense snow avalanches observed at the Vall´ee de la Sionne test site, J. Geophys. Res., 113, F01010, doi:10.1029/2006JF000688, 2008.
Sovilla, B., Kern, M., and Schaer, M.: Slow drag in wet avalanche flow, J. Glaciol., 56, 587–592, 2010a.
Sovilla, B., McElwaine, J. N., Schaer, M., and Vallet, J.: Varia-tion of deposiVaria-tion depth with slope angle in snow avalanches: Measurements from Vall´ee de la Sionne, J. Geophys. Res., 115, F02016, doi:10.1029/2009JF001390, 2010b.
Voellmy, A.: Uber die Zerst¨orungskraft von Lawinen (On¨
the destructive forces of avalanches), Schweiz. Bauztg.,
73 (12/15/17/19), 159–162, 212–217, 246–249, 280–285, 1955.
Zanuttigh, B. and Lamberti, A.: Instability and surge