R E S E A R C H
Open Access
Structurally differentiated
cis-elements that
interact with PU.1 are functionally distinguishable
in acute promyelocytic leukemia
Maoxiang Qian
1,3, Wen Jin
2, Xuehua Zhu
1, Xiaohong Jia
2, Xianwen Yang
2, Yanzhi Du
1, Kankan Wang
2*and Ji Zhang
1,2*Abstract
Background:Transcription factor PU.1, a member of the ETS family, is a master regulator of myeloid differentiation whose functional disruption is often associated with acute myeloid leukemia (AML). Although much has been learned about PU.1 over the past decades, relatively little is known aboutcis-elements that interact with this factor under physiological or pathological conditions, especially in the whole-genome scale. We aimed to define the cistrome of PU.1 in acute promyelocytic leukemia (APL) cells and characterize thecis-elements bound by PU.1. Methods:Chromatin immunoprecipitation with specific antibody coupled with deep sequencing (ChIP-seq) was used to investigate thein vivoPU.1 binding sites at the whole-genome scale in APL-derived NB4 cells. The ChIP-quantitative (q)-PCR and luciferase reporter assays were used to validate the binding events andtrans-activity, respectively. Various computational analyses, including motif mining, evolutionary conservation analysis and functional enrichment analysis, were performed to characterize thecis-elements that interacted with PU.1. Results:A total of 26,907 significantly enriched binding regions of PU.1 were identified under the false discovery rate 0.1% in NB4 cells. PU.1 bound to various types of genomic regions and acted as a promoter-enhancer dual binding transcription factor. Based on the sequence length and composition, two types of representative motifs were identified in PU.1 binding sites: a long and a short motif. The long motif, characterized by high sequence specificity and binding affinity, predominantly resided in the promoter-distal regions. In contrast, the short one, with strong evolutionary constraint, represented the primary PU.1cis-elements in the promoter-proximal regions.
Interestingly, the short one showed more preference to be correlated with the binding of other factors, especially PML/RARα. Moreover, genes targeted by both PU.1 and PML/RARαwere significantly involved in categories associated with oncogenesis, hematopoiesis and the pathogenesis of acute myeloid leukemia.
Conclusions:Our results demonstrate that structurally differentiatedcis-elements that interact with PU.1 are functionally distinguishable in APL, suggesting that the sequence diversity ofcis-elements might be a critical mechanism by which cells interpret the genome, and contribute to distinct physiological and/or pathological function.
Keywords:PU.1, PML/RARα, ChIP-seq, Acute promyelocytic leukemia,cis-element
* Correspondence:[email protected];[email protected]
1
Institute of Health Sciences, Shanghai Institutes for Biological Sciences, Chinese Academy of Sciences (CAS) & Shanghai Jiao Tong University School of Medicine (SJTU-SM), Shanghai 200025, China
2State Key Laboratory of Medical Genomics and Shanghai Institute of
Hematology, SJTU-SM, Shanghai 200025, China
Full list of author information is available at the end of the article
Background
Biological processes are orchestrated by precise temporal and spatial regulation of gene expression, requiring proper interactions between cis-regulatory elements and trans -acting factors (TFs). Disruption of such interactions often causes disease. Over the past decades, much has been learned about actions of TFs under various physiological or pathological conditions, whereas relatively little is known about the cis-elements that control TF-specific gene ex-pression [1]. Recent advances in genomic technologies, in-cluding chromatin immunoprecipitation coupled with deep sequencing (ChIP-seq), have allowed the genome-wide recognition of in vivo cis-trans interacting sites, thus facilitating the survey of structural and functional features of thousands ofcis-elements simultaneously, and providing the opportunity to understand the mechanism of gene regulation in a more comprehensive manner.
In hematopoiesis, a number of master TFs which play major instructive roles for hematopoietic development or malignant transformation have been identified and inten-sively studied. PU.1, one of these master TFs, is excluinten-sively expressed in hematopoietic cells and has been identified as a crucial transcription factor in normal hematopoiesis and in generation of myeloid leukemia through disruption of its function [2]. In acute promyelocytic leukemia (APL), a subtype of AML with the typical promyelocytic leukemia-retinoic acid receptor α (PML/RARα) fusion protein in the disease cells, PU.1 is expressed at reduced levels and increased expression mediated by gene transfer of PU.1 is sufficient to induce neutrophil differentiation, similar to the effect of all-trans retinoid acid (ATRA) [3,4]. With transgenic mouse models, the penetrance rate of APL development is significantly increased in offspring when PML/RARαmice are crossed with PU.1+/-mice [5]. These observations collectively suggested the presence of cross-talk between PU.1 and PML/RARα in APL. Using ChIP combined with whole-genome promoter arrays, we previ-ously investigated the early molecular effects of PML/ RARαin hematopoietic progenitor cells and demonstrated that PML/RARα disrupts the PU.1 regulated genes and thus results in a blockage of the downstream PU.1 signa-ling [6]. However, a question regarding whethercis-elements that interact with PU.1 contribute to the selective binding of PML/RARαin APL remains unknown.
It is interesting to note that myeloid specific genes such as granulocyte colony-stimulating factor (G-CSF) receptor [7], granulocyte-macrophage (GM)-CSF receptor α [8] and macrophage (M)-CSF receptor [9] have PU.1 binding sites in their promoter regions. However, as these genes are investigated at the single-gene level, it is challenging to gain a comprehensive understanding of the cis-elements that are essential for the regulation of myeloid-specific genes. For instance, PU.1 was first reported to bind to purine-rich 50-GGAA/T-30 sequences, similar to other
members of the Ets family [10,11]. However, later studies showed that the DNA binding specificity of PU.1 was quite different from that of the other members, in that some sites required a string of adenosine residues at the 50 of the GA core [8,9,12,13]. Additional data indicated that some of the PU.1 binding sites were biologically significant but lack of the adenosine string at the 50of GA core [14]. Also, nucleotides (i.e., G and T) flanking the 30end of the GAGGAA sequence appear to be important for PU.1 binding and its transactivation activity [15]. Given the reported variability of PU.1 binding sites, and our interest in this transcription factor in disease, we performed ChIP-seq experiments in the APL-derived NB4 cells using PU.1-specific antibody to identify thein vivoPU.1 binding sites at the whole-genome scale. This revealed a number of interesting features which are potentially important for regulating myeloid differentiation and leukemogenesis.
Results
Identification and validation ofin vivobinding regions of PU.1
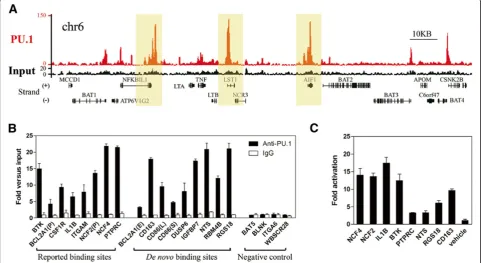
Chromatin immunoprecipitation (ChIP) with PU.1-specific antibody followed by deep sequencing was performed for the APL-derived NB4 cells. As shown in Table 1, a total of 15.6 million 35-bp sequence reads were generated, of which 11.8 million (76%) were aligned uniquely and non-redundantly to the human genome (HG18). Based on the false discovery rate (FDR) of 0.1%, a total of 26,907 signifi-cantly enriched ChIP regions with a median length of 429 bp were identified (Table 1, Additional file 1: Figure S1 and Additional file 2: Table S1) through MACS [16]. Figure 1A illustrates a representative chromatin region (6p21.33), showing enriched peaks of PU.1 binding. As shown in Figure 1A and Additional file 3: Figure S2, sharp enrich-ment peaks were found in proximal or/and distal regions of promoters for previously reported PU.1 target genes (e. g.,BTK[17],CSF1R[9],CSF2RB[18],ITGAM[12],NCF2 [19] and NCF4 [20]), and novel target genes of PU.1, such as NFKBIL1, LST1and AIF1. As a validation, ChIP-quantitative(q)-PCR was then conducted on the binding regions of 8 previously known targets, 9 randomly selected de novo targets and 4 negative controls (Figure 1B), sho-wing results consistent with those of ChIP-seq in this se-tting. Since PU.1 primarily is considered as a transactivator in myeloid differentiation [21], we then selected eight enriched regions on a random basis and applied them to luciferase assays in 293T cells (Figure 1C). Clearly, PU.1 transactivated these regions, adding further evidence that the ChIP regions identified in this setting representbona fidefunctional binding sites of PU.1 in APL cells.
Characterizing PU.1 as a promoter-enhancer dual binding TF
annotated genes based on the UCSC Genome Browser RefSeq Database [22], and found that 14.1% (3,804/ 26,907) of the binding sites mapped to the promoter regions, 41.9% (11,271/26,907) to the intragenic regions (gene body) and 44.0% (11,832/26,907) to the interge-nic regions (including 16.5% upstream enhancers, 9.9%
downstream enhancers and 17.5% distal intergenic re-gions) (Figure 2A), as classified by the recommended criteria (see Materials and methods). These results indi-cate that the binding spectrum of PU.1 is highly complex and versatile in APL cells. Next, we conducted sequence evolutionary conservation analysis across 27 vertebrate genomes on each of the mapped sections. As shown in Figure 2B, the summit of PU.1 enriched binding regions revealed higher evolutionary conservation than the flan-king regions, implicating the biological relevance of PU.1 binding. Moreover, the highest conservation scores were obtained with the promoter-proximal binding sites, sup-porting the notion thatcis-elements in promoter regions are evolutionally conserved [23]. In contrast, the PU.1 promoter-distal binding sites (including those in the intra-genic and interintra-genic regions) revealed relatively low con-servation scores, consistent with the idea thatcis-elements in enhancers or other distal regulatory elements are rela-tively dynamic among species [24].
Next, we performed a correlation analysis between the PU.1 binding sites versus total gene number and nucleo-tide number on each chromosome, respectively. As a con-trol, we conducted the same analysis with the binding sites of a classic promoter-binding factor RNA polymerase II (RNAPII), a typical enhancer-binding protein estrogen
Table 1 ChIP-seq reads and peaks threshold at FDR=0.001
Parameter NB4 PU.1
Reads Total sequenced (millions) 15.6
Total, mapped (millions) 14.8
Total, uniquely mapped and Non-redundant (millions)
11.8
In peaks (millions) 1.44 (12.1%)
Peak coverage (Mb) 13.1 (0.5%)
Median width (bp) 429
Enrichment 25.01
Peaks Number of peaks 26,907
Minimum fold enrichment 3.68
Average fold enrichment 32.92
Median fold enrichment 26.45
Notes: Peak coverage percentages assume a 2.7 Gb genome.
receptor (ER) [25] and some other factors including CTCF [26], STAT1 [27], FOXA1 [28], GATA1 [29] and GATA2 [30] (Figure 2C and Additional file 4: Table S2), whose genome-wide binding sites have been documented previ-ously. Interestingly, the PU.1 binding sites were correlated with both the chromosomal gene number (r2=0.70) and nucleotide number (r2=0.72) (Figure 2C), which appeared to be distinguishable from most of the other tested factors except for STAT1, a known promoter-enhancer dual bind-ing TF [31,32]. The factors like RNAPII, CTCF, GATA1 and GATA2, were obviously correlated with the number of genes, whereas those like ER and FOXA1, known as two specific enhancer-binding proteins, were correlated with the number of nucleotides. The above observations suggest that PU.1 may act as a versatile factor able to interact with cis-elements not only in promoter regions but also in enhancer regions.
In addition, we investigated the PU.1 binding locations and numbers on their corresponding RefSeq genes (9,556), revealing that 33.3% (3,184/9,556) of the RefSeq genes harbored the binding sites on their
be important for the adherence of neutrophils and mono-cytes during differentiation. It contains one PU.1 binding site at the promoter as previously reported [12]. In our study we have identified another site 16 kb upstream of the gene, representing a potential enhancer region (Figure 2D). Such structures may typically represent PU.1-involved trans-cisinteractions required for myeloid diffe-rentiation. In consistent with this notion, numerous other myeloid differentiation-required genes are also multi-targeted by PU.1, such as LMO2, BCL3, IL1B and IL12B (Figure 2D and Additional file 5: Figure S3).
Distinct features of the short and long motifs in the PU.1-bound regions
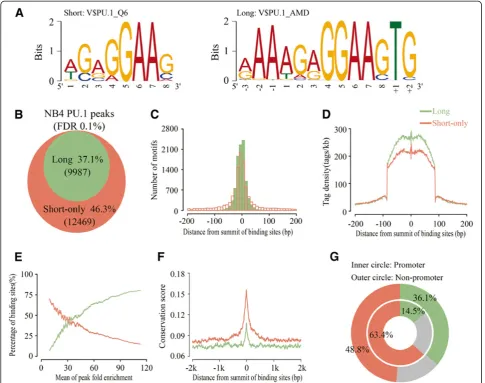
To identify cis-elements that interact with PU.1 in the enriched binding regions, we conducted motif discovery analysis using several discovery tools, including (1) the de novomotif discovery methods AMD [34] and MEME [35], and (2) the prior-compiled PSFM-based motifs detection method termed MotifScan (see Materials and methods). Based on sequences corresponding to the top 500 most-enriched binding regions, two types of motifs appeared to be repeatedly observed in a significant manner (Figure 3A). One is contained in the database of TRANFAC and known as the canonical PU.1 consensus sequence of 50-AG(A/G) GGAAG-30 (left panel) and the other is found byde novo scanning, with a motif sequence of 50-(A/G)AAAG(A/G) GGAAGTG-30 (right panel and Additional file 6: Figure S4). Thisde novomotif covers the canonical one but identi-fies additional preferences including adenine at the -3 to -1 position, and thymine and guanine at the +1 and +2 posi-tions. For convenience, we have named the motif including 50adenines as“long motif”and the canonical one as“short motif”.
Next, we scanned the total binding regions of PU.1 using the above long and short motifs by MotifScan. As shown in Figure 3B, 37.1% of the binding regions con-tained one or more long motifs, and 46.3% of the binding regions contained only the short motif. The remaining 16.6% revealed neither long nor short motifs, which were likely due to undetected PU.1-binding motifs present in these regions, or due to the possibility that for these sites PU.1 does not directly bind to chromatin, but rather forms a complex through protein-protein interactions. Positional distribution analysis revealed that both motifs, especially the long one, appeared to reside near the center of the binding regions (Figure 3C). We then evaluated the bind-ing affinities of the long and short motifs by comparbind-ing their enrichment levels. As shown in Figure 3D, the long motif exhibited a much higher mean tag density than the short one, particularly with respect to the tag density in the regions (-100 to +100) flanking the summit of peaks. Consistently, we found that the higher the enrichment levels, the more (less) the percentages of the long (short)
motifs (Figure 3E). These observations suggest that the long motif exhibits higher binding affinity to PU.1 than the short one. Interestingly, sequence evolutionary conser-vation analysis showed that the binding sites with the short motif appeared to be much more conserved than the long motif-containing sites (Figure 3F). These results together suggest that the motif preference may correlate with the motif location in the genome, implicating that functional roles played by the two types of motifs can be different in general. Then, we examined the proportional distributions of the short or long motifs in promoter re-gions vs. non-promoter rere-gions, respectively. As shown in Figure 3G, the percentage of short or long motifs (48.8% vs. 36.1%, outer circle) in non-promoter regions was equivalent to that for the total of PU.1 binding sites (46.3% vs. 37.1%, Figure 3B), whereas, that in the pro-moter regions with 63.3% short motifs and 14.5% long motifs (inner circle) was significantly different from that.
In sum,cis-elements that interact with PU.1 can be clas-sified into short and long motif classes based on their sequence patterns. In promoter regions, PU.1-ciselements are predominantly represented by those in the class of short motif, which are highly conserved across species but with lower binding affinity to PU.1. In contrast, cis-elements in the class of long motif are relatively de-pleted from promoter regions whereas primarily present in non-promoter regions, representing PU.1 binding sites of high affinity but evolutionally less conserved.
Short motif-containing binding regions of PU.1
preferentially targeted by other factors including PML/RARα
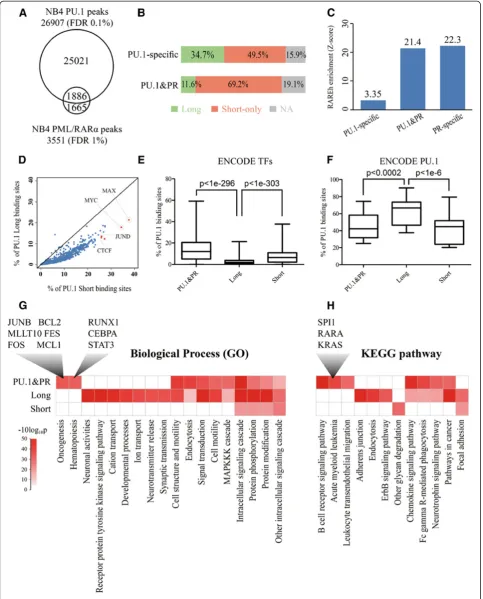
motif while less than 12% were typified by the long motif. In contrast, the proportion in the PU.1-specific set was 49.5% long and 34.7% short. These results indicated that the short motif elements are strongly correlated with the selective targeting of PU.1 binding sites by PML/RARα whereas the long motif elements are largely depleted from such a targeting. Although much remains to be elucidated, our results, at least, suggest that binding of PU.1 to short motif elements may offer this factor a selective preference to recruit PML/RARα. Previously, we have shown that PU.1 is able to direct the binding of PML/RARαto nearby
RARE half (RAREh) sites at the level of promoters [6]. We thus extended this analysis to a whole genome scale and analyzed the enrichment of RAREh sites in the three subpopulations (PU.1-specific, PU.1&PR and PR-specific). As illustrated in Figure 4C, RAREh sites were significantly enriched in the PR-specific (Z-score = 22.3) and PU.1&PR (Z-score = 21.4) sets, whereas the RAREh sites were rela-tively depleted from the PU.1-specific set (Z-score = 3.35). This result further indicates that the selective binding of PML/RARα to PU.1 binding sites requires both RAREh and short consensus elements of PU.1.
Figure 3Identification and characterization of enriched motifs within PU.1 binding regions.(A) Sequence logos were shown for significant PU.1 motifs. The logo on the left was generated with V$PU.1_Q6 PSFM from TRANSFAC database, where the logo on the right was obtained byde novomotif finding using AMD. (B) Percentages of the PU.1 binding regions with the long motif (green) or the short motif only (orange). These two colors were consistently used to indicate the two specific sub regions in the following figure parts, respectively.
Next, we wanted to know whether these PU.1-bound regions with distinct cis-elements could be co-bound or tethered differentially by other factors in addition to PML/ RARα. For this analysis we took advantage of the pub-lished Encyclopedia of DNA elements (ENCODE) project data that includes the genomic regions bound by 119 hu-man transcription factors involving 72 different cell types [36,37]. We compiled three different PU.1-bound region sets, including the PU.1-specific with the long motif (Long), the PU.1-specific with the short motif (Short) and the PU.1&PR, and carried out overlapping analysis with 1328 ChIP-seq data sets downloaded from the UCSC EN-CODE data center. As shown in Figure 4D and 4E, most of the ENCODE TFs showed significantly less preference to the Long set than the Short set and the PU.1&PR set (paired t-test p<1e-303 and p<1e-296, respectively). In particular, factors, such as MAX (21.3% vs. 37.7%) and MYC (17.8% vs. 34.4%) in NB4 cells, JUND in K562 cells (13.4% vs. 26.0%) and CTCF in HCPE (12.3% vs. 27.3%) and HBMEC (12.9% vs. 25.9%) cells showed the most dis-tinct overlapping percentage between the Long and Short sets. In contrast, the Long set was significantly more cov-ered by 9 ENCODE PU.1 data sets involving 4 cell types (GM12878, GM12891, HL60 and K562) than the Short and PU.1&PR sets (paired t-test p<1e-6 and p<0.0002, respectively; Figure 4F). The result suggested that the long-motif-containing sites kept more PU.1 binding stabil-ity among different cell types, consistent with their higher binding affinity to PU.1 revealed above, while the short-motif-containing sites could recruit more TFs to regulate the corresponding gene expression.
Furthermore, we wanted to know whether genes re-gulated by different PU.1 cis-elements or binding factors were functionally differentiated. Thus, we conducted Gene Ontology (GO) and Kyoto Encyclopedia of Genes and Genomes (KEGG) pathway analyses respectively on the three gene sets (Long, Short and PU.1&PR). As shown in Figure 4G, the most striking GO terms revealed in the gene set targeted by both PU.1 and PML/RARα
(PU.1&PR) were highlighted by genes involved in onco-genesis and hematopoiesis. The former was represented by JUNB, BCL2, MLLT10, FES, FOSand MCL1, and the latter was represented by RUNX1, CEBPA and STAT3. Similarly, the most significant KEGG pathways revealed in this gene set were represented by those involved in acute myeloid leukemia, includingSPI1,RARA,KRASand so on (Figure 4H and Additional file 8: Figure S5). These results provide additional evidence that genes targeted by both PU.1 and PML/RARα are indispensable for the normal hematopoiesis, and are crucial for leukemogenesis (Figure 4G and 4H). Besides, we also noticed that the genes belong to the Long set specifically evolved in several biological processes and functional pathways, such as developmental processes and adherens junction, respectively. The Short gene set, however, showed little particularly functional enrichment, implying PU.1 may involve more extensive biological functions rather than some specific ones through the different dynamic combinations with other factors.
Discussion
PU.1 is a master TF in myeloid differentiation, regulating numerous myeloid genes involved in hematopoiesis. Under-standingcis-regulatory elements that interact with PU.1 may provide insights into regulatory networks underlying mye-loid differentiation and related diseases. In this study, we identified 26,907in vivoPU.1 binding sites in APL-derived NB4 cells by ChIP-seq. Through various analyses, we found the PU.1 binding sites were primarily represented by two types of cis-elements. One, with high sequence specificity and binding affinity, resides primarily in the promoter-distal regions, and a second, with strong evolutionary constraint, represents the primary PU.1cis-elements in the promoter-proximal regions; the latter tend to be bound by PU.1 in asso-ciation with other factors such as PML/RARα, MYC and MAX. Our findings suggest that sequence diversity of TF bindingcis-elements is a critical mechanism by which cells interpret the genome, and contribute to distinct physio-logical and/or pathophysio-logical function.
(See figure on previous page.)
Figure 4PU.1 binding sites with short motif selectively targeted by other factors including PML/RARα.(A) Venn diagram displaying the overlap of PU.1 binding regions and PML/RARαbinding regions in NB4 cells. (B) Schematic illustration of the PU.1 motif comparison between PU.1 binding regions and PML/RARαbinding regions. PU.1-specific is the subpopulation of PU.1 binding regions that do not overlap with PML/ RARαbinding regions. PU.1&PR is the subpopulation of PU.1 binding regions that overlap with PML/RARαbinding regions. The color bars indicate the percentages of the regions with the long, only short PU.1 motif and neither, with green, orange and gray, respectively. (C) Bar plot of Motif RARE half (RAREh) enrichment in three subpopulations. PU.1-specific and PU.1&PR mean the same as above. PR-specific is the
Physical interaction between distinct chromosome regions separated by hundreds of kilobases is thought to be important in the regulation of gene expression [38]. By analyzing the distribution of PU.1 binding sites in APL, we found that over 85% of the sites resided in chromatin regions away from promoters. Interestingly, after mapping the PU.1 binding sites to the known RefSeq genes, more than half of the promoter-targeted RefSeq genes (1,598/3,184) contained additional PU.1 binding site at non-promoter regions, suggesting the presence of complex networks of interconnected chro-matin. Also, it is tempting to assume that there is a mode of action through the long-range regulation in addition to conventional models of the promoter regula-tion in PU.1-regulated gene expression. Such an assump-tion appears to be supported by recent findings in many cell types, in which long-range interactions are common for transcriptional regulation [39], and by the findings that interacting loci between transcription start sites (TSSs) and enhancers are strongly correlated with gene expression level [36]. Another example of long-range regulation is provided by estrogen receptor alpha (ERα) induced looping [40], in which the vast majority of ERα binding sites reside in non-promoter regions [41]. It has been reported that PU.1 mediated looping between pro-moter pIII and the distal element termed hypersensitive site 1 (HSS1) of transcriptional co-activator CIITA in B cell of mouse model [42], but whether looping is com-mon or infrequent in the regulatory networks of PU.1 remains to be elucidated. Consistent with previous in-vestigations at the single gene level, our study added additional 1,598 PU.1 target genes potentially regulated across long distances.
The availability of genome-wide TF binding sites bene-fits our investigation regarding the regulatory mechanisms underlying protein-DNA interaction and improves the ac-curacy for analyzingcis-regulatory elements. In this study, we found potential cis-elements of PU.1 target genes can be classified into the canonical short consensus (AG(A/G) GGAAG) and the extended long consensus ((A/G)AAAG (A/G)GGAAGTG). The shorter sequence appears to be highly conserved across species but shows less binding af-finity to PU.1, whereas the extended one demonstrates high binding affinity but low evolutionary conservation. This observation is also supported by a microarray-based binding affinity study, in which the vast majority of the 104 DNA-binding proteins tested showed different bind-ing affinities to different DNA consensuses [43]. Interest-ingly, potential cis-elements in the promoter-proximal regions of PU.1 regulated genes are predominantly repre-sented by the short motif elements (63.4%) whereas these regions are relatively depleted of the long motif elements (14.5%). In contrast, the long motif elements primarily res-ide in the promoter-distal regions (including enhancers).
Although it remains to be elucidated why these long and evolutionally diverse elements are predominantly located in non-promoter regions, it might be of interests to speculate that these elements may play species-specific roles in pre-cise regulation of gene expression required for myeloid.
Of note, PML/RARα targeted PU.1 binding regions are highly enriched with the canonical short consensus (69.2%) but depleted of the extended long consensus se-quence (11.6%). An intensive overlapping analysis revealed that most of the over 100 tested transcription factors showed more preference to the short-motif-containing binding regions of PU.1. Although much remains to be elucidated, it is tempting to assume that binding of PU.1 to the low affinity canonical consensus may represent an important mechanism that controls physiological or pathological process through the differential dynamic combinations with other factors, such as MYC and MAX. The extended long consensus elements are mostly distrib-uted in non-promoter regions, and represent high affinity binding sites of PU.1. We speculate that these sites co-operate with the binding sites in promoter regions and regulate hematopoietic specific genes through long-range regulation. In the presence of the pathological protein PML/RARα, these sites are devoid of targeting by PML/ RARαto a large extent, probably needed to keep certain ex-pression levels of the genes. Indeed, 80% down-regulation of PU.1 in hematopoietic cells causes the blockage of cell differentiation [44] and restoration of PU.1 expression in-duces neutrophil maturation [3]. Obviously, much remains to be investigated about regulatory networks of PU.1 in myeloid differentiation or leukemogenesis. However, find-ings and a resource of thousands of potentialcis-elements of PU.1 from this setting may facilitate such investigation in a more effective and efficient manner.
Conclusions
We here describe a genome-wide characterization of in vivo binding sites of PU.1 in APL-derived NB4 cells. Our results demonstrate that PU.1 can regulate target genes by binding to both the promoter-proximal and distal cis-elements. Moreover, we reveal that structurally differentiatedcis-elements that interact with PU.1 are func-tionally distinguishable in acute promyelocytic leukemia, suggesting that sequence diversity of cis-elements that interact withtrans-acting factors might be a critical mech-anism by which cells interpret the genome, and contribute to distinct physiological and/or pathological function.
Materials and methods Cell culture
medium (DMEM) supplemented with 10% FBS, in a hu-midified atmosphere with 5% CO2at 37°C.
Plasmid construction, cell transfection and luciferase reporter assays
Promoter and enhancer regions harboring PU.1 motifs were cloned into the pGL3-basic and pGL3-promoter vec-tor (Promega, Madison, WI), respectively. The primers used for the plasmids constructs are listed in Additional file 9: Table S4. Therenillaluciferase plasmid pRL-SV40 (Promega, Madison, WI) was used as control for trans-fection efficiency. The expression plasmid was pCMV4-PU.1. HEK 293T cells were transiently transfected using Lipofectamine 2000 (Invitrogen, Carlsbad, CA). Transfected cells were cultured for 48 hours and then assayed for luci-ferase activity using Dual-Luciluci-ferase Reporter Assay System reagents (Promega, Madison, WI).
ChIP-qPCR
ChIP-qPCR was performed using Power SYBRW Green PCR Master Mix (Applied Biosystems, Foster City, CA) and ABI Prism 7900HT detection system (Applied Bio-systems, Foster City, CA). The fold enrichment of the tested binding regions over the input DNA was estimated as previously described [45]. The primers used for ChIP-qPCR are listed in Additional file 10: Table S5.
ChIP-seq and data analysis
ChIP was performed using specific antibodies according to the Affymetrix protocol as described previously [40]. ChIPed and Input DNA were sequenced with Illumina Genome Analyzer II. The 35 bp reads (or tags) were aligned (mapped) to the unmasked human reference gen-ome (NCBI v36, hg18) using the Eland application (Illumina) allowing two mismatches. Only uniquely mapped reads were retained to further analyses. Next, MACS [16] algorithm was used to identify PU.1 binding regions. For the visualization of the enrichment level of transcription factor’s binding sites, we calculated the tag density of each ChIP-seq sample with 500 bp window, aligned it to the same coordinate and visualized them in a bar plot using the IGB (Affymetrix) program.
Peak mapping and annotation
We used the RefSeq Genes’database from UCSC to map and annotate the peak regions. For each peak region, we first searched the nearest RefSeq gene in both directions unless no gene was found within 50 kb. For a peak region lying within a gene, we classified it to the prox-imal promoter (-2 kb upstream to 1kb downstream to TSS), gene body (1 kb downstream of the TSS to the transcription end site (TES)), upstream enhancer (be-tween at most -50 kb and -2 kb upstream to the TSS), or downstream enhancer (from TES to at most 50 kb
downstream). Otherwise, we marked these peaks as dis-tal intergenic region (>50 kb from a RefSeq gene). To avoid multiple genomic region type annotation of one peak, we uniquely mapped the peaks to genomic region type following the priority rule: proximal promoter > gene body > upstream enhancer > downstream enhancer > distal intergenic region.
Sequence evolutionary conservation analysis
The enriched peaks were first uniquely mapped to cer-tain genomic regions according to the above peak map-ping and annotation criteria. Then, the regions were aligned at their summits from 50to 30in accordance with the orientation of the corresponding genes (if a peak be-longs to the distal intergenic region, we arbitrarily as-sume that the peak is on the positive strand) and uniformly expanded to 3,000bp in each direction, and phastCons scores were retrieved from UCSC genome browser (http://genome.ucsc.edu) and averaged at each position.
Statistical analysis of the known motifs with MotifScan
A position-specific frequency matrix (PSFM) similarity based motif analysis algorithm, named MotifScan, was used to analyze the enrichment of the known motifs statis-tically on the ChIP-seq data. Fold enrichment and Z-score were used to assess the significance of motif enrichment. MotifScan was performed as follow:
1) The acquisition of motif PSFM
The motif PSFM can be from the result ofde novo motif analysis on a set of DNA sequence data. In this study, the long motif PSFM of PU.1 was from the result of AMD [34], an automated motif discovery tool using stepwise refinement of gapped consensuses, analysis on the highly enriched PU.1 occupancy sites of ChIP-seq data set. It also could be from some motif information database directly and the TRANSFAC database was used in this study. 2) The calculation of similarity between a motif and a
DNA sequence
Given a motif with lengthlbp, the similarity (S) for a DNA sequence with equal length was calculated as follow:
S¼ Xl
j¼1
Ij 2
ffiffiffiffiffi Pij p
1
Xl
j¼1
Ij 2
ffiffiffiffiffiffiffiffiffiffi Pmax
j
q
1
WhereIjindicates the information content of the
motifj-th column,Pijis the frequency of a particular
letteriin thej-th column andPmax
of a specific letter with the maximum value in thej-th column. Details described as follow:
Ij¼
X
i∈fA;T;G;Cg
PijlogPij Qi 0 @ 1 A Where:
Pij–The frequency of a particular letteriin the j-th column (i. e. if G occurred 3 out of 6 times in an alignment column, this would be 0.5). We definePijlogPij= 0, whenPij= 0.
Qi–The expected frequency of a letteri. This is
an optional argument, usage of which is left at the user’s discretion. By default, it is automatically assigned to 0.25 = 1/4 for a nucleic acid alphabet. This is for getting the information content without any assumption of prior distributions. 3) The computation of fold enrichment (F) and
Z-score (Z)
For a specific motif, the sequence with a similarity higher than the threshold was marked as a matched sequence. Suppose that the total number of matched sequences was X in a data set with total effective sequence length L bp (repeat masked). Then the random variableXfollowed the binomial distribution with parameters n and p, written as X∼B(n,p), wheren≈L, andpwas the possibility that each bp contained a matched sequence. In this case, n was very large generally. Meanwhile, n*p and n*(1-p) were large enough. Thus, to simplify the calculation, we used the nor-mal distributionX∼N(np,np(1−p)) to excellently approxi-mate the binomial distribution. Subsequently, we further simplified the 1–p as 1, since the p was small generally. Therefore, the expected value (E) and the variance (σ2) of Xwould be the same.
Next, the total number of matched sequences was counted in a background data set and a sample data set, respectively. Suppose that the total number of matched sequences isNs in a sample data set with total effective
sequence lengthLs(bp), andNcin a background data set
with total effective sequence Lc (bp). We calculated the
expected number of matched sequences in the sample data set as E¼NcLs
Lc Followed the above simplified
for-mula, the fold enrichment and Z-score were calculated asF¼Ns=
E andZ¼Ns Effiffiffi
E
p , respectively.
Percentage calculation of the motif-containing peaks
For a specific motif, if a peak region contained at least one matched sequence, then we marked this peak as a containing one. The percentage of certain containing peaks was calculated as the number of motif-containing ones divided by all the number of peaks. The similarity was calculated as the same as in MotifScan
algorithm. In this study, to enhance the accuracy and specificity, the similarity threshold for the “long” PU.1 motif was set at 0.8 and that for the “short” PU.1 motif and RARE half was set at 0.9. We first excluded all the long PU.1 motif-containing peaks when calculating the only short PU.1 motif-containing ones, as the short PU.1 motif was nearly covered by the long one.
Additional files
Additional file 1: Figure S1.Identification of PU.1 binding sites based on different FDR levels.
Additional file 2: Table S1.Significantly enriched PU.1 ChIP regions in NB4 cells.
Additional file 3: Figure S2.Representative PU.1 target genes identified through ChIP-seq analysis.
Additional file 4: Table S2.Chromosomal distribution of PU.1 binding sites.
Additional file 5: Figure S3.Representative myeloid differentiation-required genes targeted by PU.1.
Additional file 6: Figure S4.PU.1 motif identified byde novomotif discovery method MEME.
Additional file 7: Table S3.Significantly enriched PML/RARαChIP regions in NB4 cells.
Additional file 8: Figure S5.KEGG pathway acute myeloid leukemia. Additional file 9: Table S4.The primers used for the plasmids constructs.
Additional file 10: Table S5.The primers used for ChIP-qPCR.
Abbreviations
AML:Acute myeloid leukemia; APL: Acute promyelocytic leukemia; ChIP: Chromatin immunoprecipitation; ChIP-seq: Chromatin immunoprecipitation coupled with deep sequencing; TFs:trans-acting factors; PML/RARα: Promyelocytic leukemia-retinoic acid receptor alpha; ATRA: alltransretinoid acid; FDR: False discovery rate; RefSeq: Reference sequences; RNAPII: RNA polymerase II; ER: Estrogen receptor; RARE: Retinoic acid response element; RAREh: RARE half; UCSC: University of California Santa Cruz; ENCODE: Encyclopedia of DNA Elements; GO: Gene ontology; KEGG: Kyoto encyclopedia of genes and genomes; HSS1: Hypersensitive site 1; PSFM: Position-specific frequency matrix; TSS: Transcription start site; TES: Transcription end site.
Competing interests
The authors declare that they have no competing interests.
Authors’contributions
MXQ designed the study, performed experiments, conducted the analyses and wrote the manuscript; WJ, XHZ, XHJ, and XWY performed experiments; YZD participated in the design of the study and reviewed the manuscript; KKW and JZ designed the study, interpreted the results and wrote the manuscript. All authors read and approved the final manuscript.
Acknowledgements
Author details
1
Institute of Health Sciences, Shanghai Institutes for Biological Sciences, Chinese Academy of Sciences (CAS) & Shanghai Jiao Tong University School of Medicine (SJTU-SM), Shanghai 200025, China.2State Key Laboratory of Medical Genomics and Shanghai Institute of Hematology, SJTU-SM, Shanghai 200025, China.3Graduate School of the Chinese Academy of Sciences, Shanghai 200031, China.
Received: 3 February 2013 Accepted: 18 March 2013 Published: 2 April 2013
References
1. Wittkopp PJ, Kalay G:Cis-regulatory elements: molecular mechanisms and evolutionary processes underlying divergence.Nat Rev Genet2012,
13(1):59–69.
2. Tenen DG:Disruption of differentiation in human cancer: AML shows the way.Nat Rev Cancer2003,3(2):89–101.
3. Mueller BU, Pabst T, Fos J, Petkovic V, Fey MF, Asou N, Buergi U, Tenen DG:
ATRA resolves the differentiation block in t(15;17) acute myeloid leukemia by restoring PU.1 expression.Blood2006,107(4):3330–3338. 4. Zhu X, Zhang H, Qian M, Zhao X, Yang W, Wang P, Zhang J, Wang K:The
significance of low PU.1 expression in patients with acute promyelocytic leukemia.J Hematol Oncol2012,5:22.
5. Walter MJ, Park JS, Ries RE, Lau SK, McLellan M, Jaeger S, Wilson RK, Mardis ER, Ley TJ:Reduced PU.1 expression causes myeloid progenitor expansion and increased leukemia penetrance in mice expressing PML-RARalpha.Proc Natl Acad Sci USA2005,102:12513–12518. 6. Wang K, Wang P, Shi J, Zhu X, He M, Jia X, Yang X, Qiu F, Jin W, Qian M,
et al:PML/RARalpha targets promoter regions containing PU.1 consensus and RARE half sites in acute promyelocytic leukemia.Cancer Cell2010,
17:186–197.
7. Smith LT, Hohaus S, Gonzalez DA, Dziennis SE, Tenen DG:PU.1 (Spi-1) and C/EBP alpha regulate the granulocyte colony-stimulating factor receptor promoter in myeloid cells.Blood1996,88:1234–1247.
8. Hohaus S, Petrovick MS, Voso MT, Sun Z, Zhang DE, Tenen DG:PU.1 (Spi-1) and C/EBP alpha regulate expression of the granulocyte-macrophage colony-stimulating factor receptor alpha gene.Mol Cell Biol1995,
15:5830–5845.
9. Zhang DE, Hetherington CJ, Chen HM, Tenen DG:The macrophage transcription factor PU.1 directs tissue-specific expression of the macrophage colony-stimulating factor receptor.Mol Cell Biol1994,
14:373–381.
10. Klemsz MJ, McKercher SR, Celada A, Van Beveren C, Maki RA:The macrophage and B cell-specific transcription factor PU.1 is related to the ets oncogene.Cell1990,61:113–124.
11. Nguyen VC, Ray D, Gross MS, de Tand MF, Frezal J, Moreau-Gachelin F:
Localization of the human oncogene SPI1 on chromosome 11, region p11.22.Hum Genet1990,84:542–546.
12. Pahl HL, Scheibe RJ, Zhang DE, Chen HM, Galson DL, Maki RA, Tenen DG:
The proto-oncogene PU.1 regulates expression of the myeloid-specific CD11b promoter.J Biol Chem1993,268:5014–5020.
13. Galson DL, Hensold JO, Bishop TR, Schalling M, D’Andrea AD, Jones C, Auron PE, Housman DE:Mouse beta-globin DNA-binding protein B1 is identical to a proto-oncogene, the transcription factor Spi-1/PU.1, and is restricted in expression to hematopoietic cells and the testis.Mol Cell Biol 1993,13:2929–2941.
14. Gangenahalli GU, Gupta P, Saluja D, Verma YK, Kishore V, Chandra R, Sharma RK, Ravindranath T:Stem Cell Fate Specification: Role of Master Regulatory Switch Transcription Factor PU.1 in Differential Hematopoiesis.Stem Cells Dev2005,14:140–152.
15. Li SL, Schlegel W, Valente AJ, Clark RA:Critical flanking sequences of PU.1 binding sites in myeloid-specific promoters.J Biol Chem1999,
274:32453–32460.
16. Zhang Y, Liu T, Meyer CA, Eeckhoute J, Johnson DS, Bernstein BE, Nusbaum C, Myers RM, Brown M, Li W, Liu XS:Model-based analysis of ChIP-Seq (MACS).Genome Biol2008,9:R137.
17. Muller S, Sideras P, Smith CI, Xanthopoulos KG:Cell specific expression of human Bruton’s agammaglobulinemia tyrosine kinase gene (Btk) is regulated by Sp1- and Spi-1/PU.1-family members.Oncogene1996,
13:1955–1964.
18. van Dijk TB, Baltus B, Caldenhoven E, Handa H, Raaijmakers JA, Lammers JW, Koenderman L, de Groot RP:Cloning and characterization of the human interleukin-3 (IL-3)/IL-5/ granulocyte-macrophage colony-stimulating factor receptor betac gene: regulation by Ets family members.Blood 1998,92:3636–3646.
19. Eklund EA, Kakar R:Recruitment of CREB-binding protein by PU.1, IFN-regulatory factor-1, and the IFN consensus sequence-binding protein is necessary for IFN-gamma-induced p67phox and gp91phox expression.J Immunol1999,163:6095–6105.
20. Li SL, Valente AJ, Qiang M, Schlegel W, Gamez M, Clark RA:Multiple PU.1 sites cooperate in the regulation of p40(phox) transcription during granulocytic differentiation of myeloid cells.Blood2002,99:4578–4587. 21. Chen H, Ray-Gallet D, Zhang P, Hetherington CJ, Gonzalez DA, Zhang DE, Moreau-Gachelin F, Tenen DG:PU.1 (Spi-1) autoregulates its expression in myeloid cells.Oncogene1995,11:1549–1560.
22. Kuhn RM, Karolchik D, Zweig AS, Wang T, Smith KE, Rosenbloom KR, Rhead B, Raney BJ, Pohl A, Pheasant M,et al:The UCSC Genome Browser Database: update 2009.Nucleic Acids Res2009,37:D755–D761. 23. Brown RP, Feder ME:Reverse transcriptional profiling:
non-correspondence of transcript level variation and proximal promoter polymorphism.BMC Genomics2005,6:110.
24. Wray GA:The evolutionary significance of cis-regulatory mutations.
Nat Rev Genet2007,8:206–216.
25. Carroll JS, Meyer CA, Song J, Li W, Geistlinger TR, Eeckhoute J, Brodsky AS, Keeton EK, Fertuck KC, Hall GF,et al:Genome-wide analysis of estrogen receptor binding sites.Nat Genet2006,38:1289–1297.
26. Kim TH, Abdullaev ZK, Smith AD, Ching KA, Loukinov DI, Green RD, Zhang MQ, Lobanenkov VV, Ren B:Analysis of the vertebrate insulator protein CTCF-binding sites in the human genome.Cell2007,128:1231–1245. 27. Robertson G, Hirst M, Bainbridge M, Bilenky M, Zhao Y, Zeng T, Euskirchen
G, Bernier B, Varhol R, Delaney A,et al:Genome-wide profiles of STAT1 DNA association using chromatin immunoprecipitation and massively parallel sequencing.Nat Methods2007,4:651–657.
28. Lupien M, Eeckhoute J, Meyer CA, Wang Q, Zhang Y, Li W, Carroll JS, Liu XS, Brown M:FoxA1 translates epigenetic signatures into enhancer-driven lineage-specific transcription.Cell2008,132:958–970.
29. Yu M, Riva L, Xie H, Schindler Y, Moran TB, Cheng Y, Yu D, Hardison R, Weiss MJ, Orkin SH,et al:Insights into GATA-1-mediated gene activation versus repression via genome-wide chromatin occupancy analysis.MolCell2009,
36:682–695.
30. Fujiwara T, O’Geen H, Keles S, Blahnik K, Linnemann AK, Kang YA, Choi K, Farnham PJ, Bresnick EH:Discovering hematopoietic mechanisms through genome-wide analysis of GATA factor chromatin occupancy.Mol Cell 2009,36:667–681.
31. Robertson AG, Bilenky M, Tam A, Zhao Y, Zeng T, Thiessen N, Cezard T, Fejes AP, Wederell ED, Cullum R,et al:Genome-wide relationship between histone H3 lysine 4 mono- and tri-methylation and transcription factor binding.Genome Res2008,18:1906–1917.
32. Wormald S, Hilton DJ, Smyth GK, Speed TP:Proximal genomic localization of STAT1 binding and regulated transcriptional activity.BMC Genomics 2006,7:254.
33. Okuno Y, Huang G, Rosenbauer F, Evans EK, Radomska HS, Iwasaki H, Akashi K, Moreau-Gachelin F, Li Y, Zhang P,et al:Potential autoregulation of transcription factor PU.1 by an upstream regulatory element.Mol Cell Biol 2005,25:2832–2845.
34. Shi J, Yang W, Chen M, Du Y, Zhang J, Wang K:AMD, an automated motif discovery tool using stepwise refinement of gapped consensuses.PLoS One2011,6:e24576.
35. Bailey TL, Boden M, Buske FA, Frith M, Grant CE, Clementi L, Ren J, Li WW, Noble WS:MEME SUITE: tools for motif discovery and searching.Nucleic Acids Res2009,37:W202–W208.
36. Consortium EP, Bernstein BE, Birney E, Dunham I, Green ED, Gunter C, Snyder M:An integrated encyclopedia of DNA elements in the human genome.Nature2012,489:57–74.
37. Wang J, Zhuang J, Iyer S, Lin X, Whitfield TW, Greven MC, Pierce BG, Dong X, Kundaje A, Cheng Y,et al:Sequence features and chromatin structure around the genomic regions bound by 119 human transcription factors.
Genome Res2012,22:1798–1812.
38. Dekker J:Gene regulation in the third dimension.Science2008,319:1793–1794. 39. Sanyal A, Lajoie BR, Jain G, Dekker J:The long-range interaction landscape
40. Carroll JS, Liu XS, Brodsky AS, Li W, Meyer CA, Szary AJ, Eeckhoute J, Shao W, Hestermann EV, Geistlinger TR,et al:Chromosome-wide mapping of estrogen receptor binding reveals long-range regulation requiring the forkhead protein FoxA1.Cell2005,122:33–43.
41. Lin Z, Reierstad S, Huang CC, Bulun SE:Novel estrogen receptor-alpha binding sites and estradiol target genes identified by chromatin immunoprecipitation cloning in breast cancer.Cancer Res2007,
67:5017–5024.
42. Yoon H, Boss JM:PU.1 binds to a distal regulatory element that is necessary for B cell-specific expression of CIITA.J Immunol2010,
184:5018–5028.
43. Badis G, Berger MF, Philippakis AA, Talukder S, Gehrke AR, Jaeger SA, Chan ET, Metzler G, Vedenko A, Chen X,et al:Diversity and complexity in DNA recognition by transcription factors.Science2009,324:1720–1723. 44. Rosenbauer F, Wagner K, Kutok JL, Iwasaki H, Le Beau MM, Okuno Y, Akashi
K, Fiering S, Tenen DG:Acute myeloid leukemia induced by graded reduction of a lineage-specific transcription factor, PU.1.Nat Genet2004,
36:624–630.
45. Cawley S, Bekiranov S, Ng HH, Kapranov P, Sekinger EA, Kampa D, Piccolboni A, Sementchenko V, Cheng J, Williams AJ,et al:Unbiased mapping of transcription factor binding sites along human
chromosomes 21 and 22 points to widespread regulation of noncoding RNAs.Cell2004,116:499–509.
doi:10.1186/1756-8722-6-25
Cite this article as:Qianet al.:Structurally differentiatedcis-elements that interact with PU.1 are functionally distinguishable in acute
promyelocytic leukemia.Journal of Hematology & Oncology20136:25.
Submit your next manuscript to BioMed Central and take full advantage of:
• Convenient online submission • Thorough peer review
• No space constraints or color figure charges
• Immediate publication on acceptance
• Inclusion in PubMed, CAS, Scopus and Google Scholar
• Research which is freely available for redistribution