* Corresponding author: [email protected] 2017 UTHM Publisher. All right reserved.
penerbit.uthm.edu.my/ojs/index.php/ijie
44
Development of Analytical Models for RC Columns under
Blast loading Considering Strain Rate Effects
Mohammad Esmaeilnia Omran
1, Somayeh Mollaei
1,*1Department of Civil Engineering
University of Kurdistan, Sanandaj, IRAN.
Received 4 October 2016; accepted 8 May 2017 ; available online 9 May 2017
1.
Introduction
The performance of axially loaded structural components under extreme dynamic loads, such as explosion and impact, is a common practical issue in a wide range of engineering problems especially in civil engineering. In the external explosions which may be occurred in the vicinity of buildings, external columns are often the most vulnerable structural components [1]. Despite the importance of this issue, in engineering applications the slight analytical studies have been done over the dynamic behavior of the axially loaded RC columns (beam-columns) under blast loading. Most studies in the field of evaluating RC columns under blast loading, has been done by means of numerical modeling by finite element software packages [1-8]. Nevertheless, analytical methods are essential tools to create a comprehensive insight to physical behavior of structural component [9]. Due to the high speed and acceptable accuracy of the analytical methods, they are especially suitable for initial designing and evaluation of residual strength of structural components after the explosion. Also, the results of analytical methods are applicable as fast tool for validation of numerical methods. Most of the studies in the field of nonlinear dynamic systems are related to lumped systems, and continuous structural components such as beams and columns are less investigated [10]. Details related to analytical models for free and force vibration of beams has come in some research papers [11-18] and some books [19-24]. Most of
these studies are related to elastic beam-columns, and solving such problems by considering non-elastic deformations and effects of strain rates under severe dynamic loadings are investigated in very few studies. For instance, a research has been done by Carta & Stochino (2013) on the continuous analytical models of RC beams under the explosion by considering high strain rate effects [25]. In their study, the effect of axial loads is not considered. Akbari et al (2014) introduced a new method for solving differential equation of nonlinear vibration of continuous beam-columns without considering the effects of high strain rate [26]. Single degree of freedom (SDOF) method is a simple analytical approach that is the basis of blast analysis and design references [27-31]. It has been shown that equivalent SDOF system can model the behavior of steel beams and columns [17, 32-34], slabs and walls [35-37] and RC beams [18, 25, 38, 39] under the blast loading with acceptable accuracy. But, studies on how to consider compressive axial load effects (P-δ) in SDOF models for RC columns under blast loading is very rare. As an example, Nassr et al (2013) have examined the axial load effect in SDOF models of slender steel columns under blast loading [33]. Some studies have also been conducted by US Army Corps of engineers that publishing the complete results of those studies has legal and military limitations [40, 41].
In this paper, a continuous formulation and a SDOF analytical model are used in order to estimate transverse
Abstract: One of the most important examples of transverse excitation of beam-columns is structural reinforced concrete (RC) columns under blast loading. Under accidental or intentional explosions next to the buildings, external columns are the most critical and vulnerable structural elements. In this paper, tow analytical approaches are used to predict the first maximum dynamic response of rectangular RC column under simultaneously effect of axial force and transverse blast loading. The first analytical model is based on continuous formulation of Euler -Bernoulli beam theory and the second model is a single degree of freedom (SDOF) approach. Both of the approaches consider strain rate effects on nonlinear behavior of materials (concrete and steel reinforcement) and secondary effects of P-δ. Results of proposed models for predicting the first maximum lateral response of column under impulsive, dynamic and quasi-static loading regimes are compared to the results of nonlinear finite element analysis. The outcomes indicate undesirable discrepancies under high levels of axial force and quasi-static loading conditions. Nevertheless, in the impulsive and dynamic regimes and moderate and low axial load ratio, the differences in the results are acceptable. Afterward, the analytical models are used to evaluate Pressure-Impulse (P-I) diagram for RC column under blast loading and effective factors on it.
45
displacement response of RC columns under simultaneous effects of compressive axial force and lateral blast loading. Both analytical approaches are based on Euler–Bernoulli beam theory and they include the effects of secondary moments (P-δ) and the effects of high strain rates on the linear and nonlinear behavior of concrete and steel bars. In order to consider P-δ effects for RC column modeling, the concept of reduced resistance function is used [42].The response of column under blast loading with variable time-history and different levels of axial load is investigated. Then, using the introduced analytical models, P-I diagrams have been plotted for RC columns. P-I diagram is a graphical tool for assessment and initial design of structures and structural members under blast loading [43-47]. For a RC column (or beam-column) this failure level can be defined as maximum flexural deformation in mid height [27, 46, 47, 48], shear deformation at supports in the state of shear failure [49, 50], maximum rotation at supports or connections [27] or residual axial capacity of beam-column [2]. In this study, maximum deformation of the structural component is considered as failure criterion. The effects of axial load level and blast pressure time history on the column's P-I diagram are investigated, as well.
2.
Blast Loading
For engineering applications in order to simplify the blast loading, it has recommended different loading patterns on the structure faces [28-30]. In blast loading with medium to far standoff distance, pressure distribution on the structural face can be assumed to be uniform [2, 28, 30, 51]. Some of pressure time-histories, which are commonly used in analysis and design of structures under explosion, are triangular, rectangular, bi-linear, exponential and rectangular with limited rise time [30]. According to the duration time of blast pressure td, the structural maximum response is occurred in three different regimes: quasi-static, dynamic and impulsive [52]. In impulsive regime tmax (the time that maximum
response occurs) is much longer than td and in this regime
(T is natural period of vibration of the system). In
dynamic regime tmax and td are almost close to each other
( ) and in quasi-static regime tmax is much
shorter than td ( ). In this paper, different explosion
duration time is used to evaluate column's behavior in all three regimens. The space distribution of lateral load is assumed to be uniform on one side of component (front face). Details and definitions of blast load parameters and their calculations can be found in various blast loading references [28, 30, 52]. It should be noted that in this paper, negative phase of explosion is neglected.
3.
Analytical Models
3.1
Continuous Model
Consider a RC column (beam-column) with rectangular cross section under uniform distributed lateral
dynamic loading and a fixed axial force. Governing differential equation of Euler-Bernoulli is defined by Eq.1 [21-23, 53]:
Where, M is resistant bending moment of the section, axial force, μ mass of unit length, q lateral load, u lateral displacement, x initial column longitudinal axis and t is time variable. In this equation, shear deformation and rotational inertia of the section are ignored and displacements and rotations are supposed to be small. A force tending to return the structure to its position before loading is called structural resistant that the amount of this resistant is depended on the loading, structural geometry and its support condition [41]. Resistance equation is a force-displacement curve (or moment-curvature) which is depended on response history [24]. For a RC rectangular section under simultaneous effect of axial load and bending moment, a bilinear equation (Eq.2) can be considered as an approximation of real moment-curvature diagram of the section; Such that the area under the bilinear function would be equal to the area under the real curve.
In Eq.2, and is slope of resistance function in elastic and plastic range, respectively. , and
are curvature and resistant moment of the section in yield and ultimate state, respectively. By substituting the resistance function in the equation of motion of the
column (Eq.1) and given that , differential
equation of column will be as Eq.3. The negative sign in this equation is considered since positive bending moment produces negative curvature in the section.
It must be noted that in the above equation, every arbitrary spatial and time distribution for lateral load q can be considered. By solving above equation, time history of the transverse displacement and curvature of the column can be calculated.
3.2
Equivalent SDOF Model
46
equivalent coefficients for elastic and plastic states areused. Consider a two ends hinged member under uniformly distributed loading. As an estimation of elastic deformation, static deformed shape of a simple beam under uniform loading can be applied [19]. In plastic range, it is assumed that a plastic hinge is formed in the middle length of the member, so the deformed shape is linear. To ensure that response parameters which are obtained from SDOF system have sufficient accuracy, this equivalent SDOF is selected in such a way that the maximum deformation correspond the deformation of a critical point in the actual structure [19].
In most practical applications, it is important to determine the maximum response of the system. In this study, the aim of providing SDOF model is to determine the first maximum transverse response of the column under blast loading. It has been shown that under the short and intense stimulations, such as impact and explosion, the amount of dissipated energy by structural damping until the first maximum structural response is very low and ignorance of damping is a conservative assumption [30, 38, 41, 54, 55]. Therefore, in SDOF models in this article the system damping is ignored. Thus, the dynamic equation of motion for SDOF model of RC column without damping is expressed as Eq.4:
Where PE(t) is the equivalent loading, ME(t) equivalent
mass, KE(t) equivalent stiffness, uE(t) equivalent
displacement of SDOF system and refers to the acceleration of the system. We have ME(t)= KLM × Mb
that KLM is load-mass coefficient (for a simple beam with
distributed uniform load KLM =0.78 in elastic range and
0.66 in plastic range) and Mb is total mass of the column.
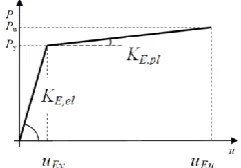
In this paper, SDOF system behavior is assumed to be elasto-plastic that can be displayed by a bilinear load-displacement (P-u) diagram according to Fig. 1 in which KE,pl is equivalent plastic stiffness (the line slope in
plastic range) and KE,el is equivalent elastic stiffness.
Fig. 1 load-displacement diagram for SDOF model.
Where uEu and Pu and uEy and Py are displacement
and load at ultimate and yield state, respectively. In a simple beam under uniformly distributed loading using equilibrium equations we have:
Where qy and qu is the uniform lateral load on the column
at the yield and ultimate state, respectively. My and Mu are
determined according to moment-curvature diagram of the section. If φu and φy are section curvature values in the
ultimate and yield state respectively, yield displacement
uEy in the middle length of the member can be
approximated as follows:
To calculate uEu, assume that a plastic hinge is
formed in the middle length then (with small displacements):
Where, θpu is plastic rotation in the ultimate state. If
plastic curvature φp ( ) is constant through the
length of the plastic hinge, then that is the
length of plastic hinge. In order to estimate the plastic hinge length, several equations have been proposed [56, 57]. In this paper, suggested equation by Pauli and Priestley (1992) is used [58]:
Where db and is diameter and yield stress of
longitudinal reinforcement bars.
3.3
Secondary moments (P-δ) effects
P-δ effects is considered explicitly in the calculations of both continuous and SDOF equation of motions. In each time step of calculations, a dynamic uniform equivalent lateral load (ELL) is applied to the column; The amount of ELL is calculated in a way that maximum bending moment resulted by that is equal to maximum bending moment caused by axial load with the eccentricity equal to calculated transverse displacement (u) at that time step. This assumption is based on the concept of reduced resistance function [42]. Equivalent lateral load η(t) corresponded to P-δ effects for a simple one-way member is calculated by Eq.9 [36, 42]:
Where N is compressive axial load and u(t) is displacement in the mid-height.
3.4
Moment-Curvature (M-φ) Analysis
47
selected [62] which is based on the model of Kent & Park (1971), neglecting the tensile strength of concrete. In this material model, stress in the confined core concrete is calculated by following equation [63]:
Where is characteristic compressive strength of concrete (MPa) and strain in concrete fiber.
Parameters in above equation are
and in which is stirrup
yield stress and and is stirrup volume relative to the volume of core concrete, h and s is width of concrete core and stirrup intervals (mm), respectively. Maximum concrete stress is which occurs at strain
and the ultimate stress is assumed to be that occurs at the ultimate strain
. For concrete cover
(non-confined) it is assumed in the above
equations.
For steel rebars, Steel01 Material model is used which is linear elastic-perfect plastic behavior. At each time step of calculations of the analytical models, M-φ subprogram is called and material properties are introduced to it as input data. Then, based on output data
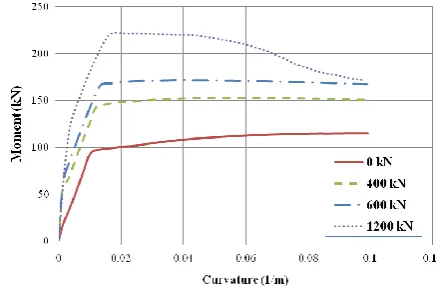
M-φ curve is drown and a bi-linear function is fitted to the curve that and are line slope in elastic and plastic range, respectively. In Fig. 2 an example of obtained M-φ diagram for assumed column section at the initial state (without strain rate effect) with different levels of axial load is shown.
Fig. 2 Estimated M-φ diagrams for different axial load levels.
4.
Solving Analytical Models
4.1
Continuous Model
In this paper, governing equation in continuous model is solved by explicit finite difference method (FDM) [72].Spatial derivatives (with subtitle i) and time derivatives (with subtitle j) are calculated by quadratic
approximations. Main body of the FD calculations is written using MATLAB R2013a (v8.01) software. Also a sub-program has been implemented in order to create a M-φ diagram for RC section using OpenSees software. At each time step, according to initial and boundary conditions at the beginning of the step, transverse displacement u is determine by solving Eq.14 that is FD form of Eq.3:
Here, K represents time increments and H is spatial increments that K =10-5 s and H=0.05 m. In the above equation, and are modified in each step due to the effects of stain rates. Curvature of the section is
, so Mφ bending moment corresponding with φ
is determined using M-φ diagram. Afterward, depth of neural axis of the section is calculated by writing rotational equilibrium for the section under Mφ (Fig. 3).
Fig. 3 RC section: 1) distribution of stress in the section; 2) distribution of strain in the section. In Fig. 3, strain distribution in the section height is supposed to be linear and tensile strength of concrete is ignored. σc and εc is stress and strain in compressive
concrete, σs ،εs and σss ،εss are stress and strain in bars
behind and front facing blast wave, respectively. Also, x is depth of neural axis, b width, h height, d effective depth of section, As and Ass are reinforcement areas in
behind and front face of the section, respectively. By writing equilibrium equation of moments around As and
substitute σc from Eq.10, considering linear strain at the
section height Eq.15 is obtained:
48
then stress in is replaced by andthe equation would be solved again. After finding , strain in concrete and rebars can be calculated using
and .
By comparing the values of strains with previous step of calculations, strain rate in concrete and steel is determined and DIF factors are calculated using corresponding formulas. Then, mechanical properties of the materials are modifies and introduced to M-φ subprogram to determine and for the next step (j=j+1). Specified criterion for ending this cycle is defined as reaching the ultimate strain in compressive concrete.
4.2. SDOF Model
SDOF equation of motion in the elastic and plastic range, for a tow end hinged beam- column, is expressed as Eq.16 which is FD form of Eq.4 :
Where is length of the member and other parameters are defined before. All the steps for solving above equation and calculating displacement response u(t) is the same with continuous model. However, Eq.16 is simpler and shorter to solve rather than Eq.14, because it doesn't have spatial derivatives and order of the equation is 2time lesser.
5. Results and Discussion
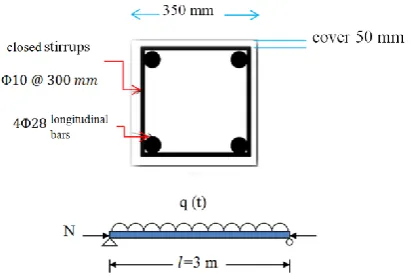
In this section, the process of analytical solutions discussed before are used to estimate dynamic response of considered RC column under different blast pressure time-histories. Results obtained by continuous and SDOF models are compared to implicit finite element analysis by OpenSees Version 2.3.1 [59] and explicit finite element analysis by ABAQUS Version 6.14-2 [73]. The considered column has square section with symmetric reinforcement and other specifications of the model and loading conditions are shown in Fig. 4 and table 1. RC column is designed as a conventional structural column in 2-3 story building in accordance with requirements of ACI 318-14 [74].
Fig. 4 Considered beam-column model
In the above table, is the nominal axial strength of the column under pure axial load which is obtained easily by Eq.17 [75]:
Where, is the whole area of longitudinal bars
and is gross area of the section. In practical applications, usually the ratio of axial load in columns to its axial capacity is about 0.1-0.4 [1, 4]. For evaluating column's response in quasi-static, impulsive and dynamic regimes the amount of time duration of explosion is changed (table 2).
Table 2 values of considered blast load duration
axial load ratio
natural vibration period T (sec)
duration of explosion td (sec)
impulsive regime
dynamic regime
quasi-static regime 0 0.0331 0.000331 0.00331 1.655 0.21Nmax 0.0263 0.000263 0.00263 1.315
0.4Nmax 0.0248 0.000248 0.00248 1.240
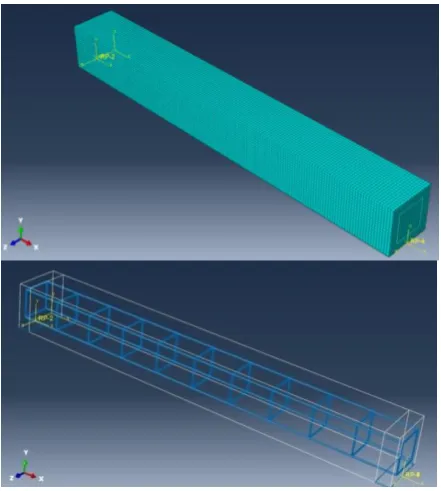
In 3-D ABAQUS modeling, concrete is meshed with 17 mm C3D8R-SOLID elements, longitudinal bars with 20 mm B31-BEAM element and stirrups with 20 mm truss elements. This type of elements is suitable for stirrups since confinement effect of stirrups is considered only once with definition of confined concrete
Table 1 specification the considered model
parameter Initial value
compressive strength of concrete fc 30 MPa
mass of unit length μ 0.309 kg/mm
steel yield stress 400 MPa
Steel ultimate stress 600 MPa
Steel modulus of elasticity
axial load ratio
49
specification. Material behavior for concrete is introduced with point data and using recommended Eq.10. Some of modeling assumptions are Poisson's ratio for Steel 0.3, steel material model is elastic-perfectly plastic, Poisson ratio for concrete 0.2 and concrete Damage Plasticity is used for crack modeling in concrete. In ABAQUS/Explicit dependency of concrete properties to high strain rates is considered by calculating the equivalent plastic strain rate [73] and strain rate dependency of steel material is also enabled for its material model. The analysis has been done in two phases; In the first phase, a quasi-static linear analysis is done in which initial axial load is applied on the rolling end of the member trough 1 sec time duration. In the second phase, non-linear dynamic analysis has been done which trough it the axial force is constant. Therefore, in this phase the results of first phase are as predefined field introduced to the model. RC member is assumed to be horizontal with free air blast loading above it. Blat load is applied with triangular time history to upper face of the member. Supports condition is ideal hinge in one end and simple roller at the other end. In Fig. 5 an image of concrete and reinforcement meshing of the column in ABAQUS is shown.
Fig. 5 Meshing of concrete and bars in ABAQUS.
The amount of pressure at the first moment is P0=1000 kPa and uniformly distributed. Since in this
paper only the first maximum response of the structure under blast loading is considered, for saving in time and volume of output data, the analysis continues until cover the first maximum response.
In Fig. 6 transverse displacement histories in the middle of the length, for different blast loading regimes and axial load ratios, are shown. In this figure, FE curves refer to the results from explicit FE analysis by ABAQUS and CM curves show the results from continuous model
(CM). Final points in the CM curves, show obtaining the failure criterion in analytical model.
Fig. 6 Results of FE and continuous model for transverse displacement in the middle of length.
According to Fig. 6, in impulsive loading regime the amount of displacement in the analytical model has an appropriate matching with FE results. In dynamic regime, estimated displacement in analytical model is appropriate but reaching to the failure criterion of calculation is a hinder to precise estimation of maximum response value. In quasi-static regime, due to the large deformations, analytical model has not given acceptable results. In the high axial load levels, results discrepancies have increased. Also it can be concluded that increasing the axial load ratio in the member has caused to reduce of the displacement response which implies increasing blast resistance capacity of the column.
For another validation of analytical process introduced here, considered RC column with axial load ratio 0.21Nmax and explosion of 40 kg TNT at 4 m
50
distributed. Presented SDOF analytical process is used tostudy dynamic behavior of RC column under the blast loading. The results are compared to a 2-D finite element analysis of dynamic response of the member using OpenSees software. Material Models are the same with described models in M-φ subprogram. 10 cm dispBeamColumn elements (with 10 points of integration) are selected in length of the member and for longitudinal reinforcement, Straight type element is used. To define column section, fiber model has been used that divides the section into 30 mm concrete fibers and steel bars. In the OpenSees commands and algorithms no prediction or recommendation exist on how consider the effects of strain rate on material properties. Therefore, in this study DIF coefficients of the last step of the calculation in SDOF model are used. Analysis of the considered column with OpenSees, consists of three distinct phases; First, the column is taken under a static analysis under axial load. During this phase, displacement of the nodes in the roller end of the member along the longitudinal axis of the column is recorded (phase I). Then, dynamic model with applying DIF coefficients to the material models is done. At the beginning of this stage, during another static analysis, determined displacements from the first phase is applied to the end nodes (phase II) and then dynamic analysis under lateral blast loading is implemented (phase III). Thus, for dynamic analysis under blast loading, column model can be updated for considering the effects of strain rate.
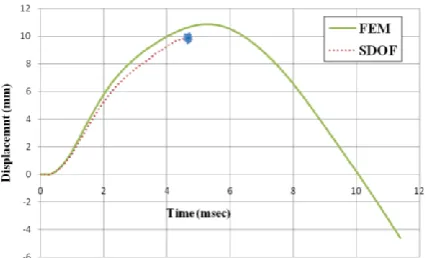
In Fig. 7, the amount of calculated first maximum lateral displacement in SDOF model is compared with the results of FE analysis by OpenSees. Note that the results of FE analysis are recorded from applying time of the blast load to the structure. It can be seen that displacement increasing with time obtained by SDOF method is very close to the results of FE analysis but reaching failure criterion of the section has caused lower maximum displacement in compare to the amount calculated by OpenSees analysis.
Fig. 7 Time history of maximum transverse displacement in RC column obtained by SDOF method.
In this step, the effects of the blast pressure time-history and axial load ratio on the P-I diagram of the RC columns is studied. Considered failure criterion is
maximum displacement in the middle of the length to be the same with deformation corresponding 2 degrees of rotation at the column support which usually causes
compressive concrete to crush [30]. For preparing P-I diagram, in the considered level of axial load and the shape of blast load time history (include rectangular, triangular and exponential forms), the sufficient number of corresponding points is calculated which resulting maximum displacement is equal to considered failure criterion. For considered column defined before, SDOF model is used to prepare P-I diagrams. P-I curves obtained in each case, for zero axial load case, is shown in Fig. 8. In this figure can be seen that changes in the form of blast loading, have more influence through the dynamic range of response.
Fig. 8: P-I diagrams of beam-column (with zero axial load) under lateral uniform blast load with different time-history shapes.
Points in the left side and bottom of the P-I curve represent the states that do not reach the target damage level and points in the right side and top of the charts represent the states that cause damage more than target damage level. In every P-I diagram we can specify three areas; in the impulsive area, the impulse of blast wave that can cause target structural damage, is constant. That is, the response of the structure is only sensitive to the amount of blast impulse (the area under the pressure-time curve). In the quasi-static area, the amount of maximum pressure which causes target damage is constant and structure response is dependent only on the blast over- pressure value. In the dynamic area, structural response under blast loading is sensitive to both pressure and impulse values.
51
column is reduced compared with the case of without axial load.
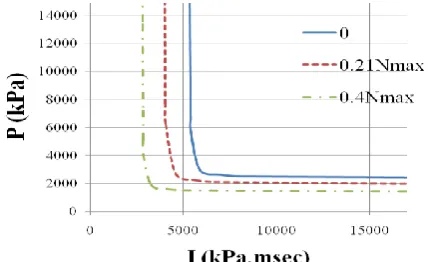
Fig. 9: P-I diagrams for column with different ratio of axial load under uniform blast load with triangular shape.
It should be noted that increasing in axial load ratio, cause to increase the bending and shear capacity and resulted lateral displacement reduces. On the other hand, according to Fig. 9 it can be concluded that increasing axial load causes reduction of column blast resistance. So, considering the appropriate level of axial load in RC column is essential to evaluate of existing columns or design of the column under blast loading.
6.
Summary
In this article transverse deformation of reinforced concrete columns under constant axial load and lateral blast loading, is calculated with tow analytical methods. In the introduced analytical models, material non-linearity, strain rate effects on considered material properties and also P-δ effects are included. One of the introduced models is based on continuous Euler-Bernoulli beam theory and the other one is based on equivalent single degree of freedom method. Obtained results from the analytical models for estimating the first maximum response of the column has compared to results obtained by nonlinear finite element analysis (ABAQUS and OpenSees software). Also, Using introduced SDOF model, the effects of blast loading form and axial load ratio on the RC column's P-I curve is investigated.
According to obtained results, in the moderate and low axial load levels, the continuous model estimates the maximum amount of deformation of the column with acceptable accuracy, in impulsive and dynamic loading regimes. When the axial load level is high or in the quasi-static regime, the accuracy of the results is lower. Also, presented SDOF method despite the simplicity and low calculation time has sufficient accuracy and reliable results. It has been shown that axial load level and the form of the blast pulse are effective on the P-I diagram. According to the results, by increasing axial load P-I diagram approaches to center of the coordination which indicates reduction in the necessary pressure and impulse values for reaching target failure level. This implies the importance of considering axial load in assessment and designing of the RC columns under blast loading. In
SDOF approach, by using equivalent coefficients or equivalent length of plastic hinge, some approximations take into account. Also, useful information such as displacement, curvature and rotation profile can't be achieved through the column length. On the other hand, uncertainties in the nature of the blast loads cause the accuracy of the idealized systems can't be guaranteed. However, in SDOF method a good understanding of the parameters affecting the structural behavior and its dynamic response can be achieved.
References
[1] Bao, X. and Li, B. Residual Strength of Blast Damaged Reinforced Concrete Columns. Int J Imp Eng, Vol. 37, (2010), pp. 295-308.
[2] Shi, Y., Hao, H. and Li, Z.X. Numerical Derivation of Pressure-Impulse Diagrams for Prediction of RC Column Damage to Blast Load. Int J Imp Eng, Vol. 35, (2008). pp. 1213-1227.
[3] Carriere, M., Heffernan, P.J., Wight, R.G. and Braimah, A. Behaviour of Steel Reinforced Polymer (SRP) Strengthened RC Members under Blast Load. Can J Civil Eng, Vol. 36, (2009), pp. 1356-1365. [4] Wu, K.C., Li, B. and Tsai, K.C. Residual Axial
Compression Capacity of Localized Blast-Damaged RC Columns. Int J Imp Eng, Vol. 38, (2011), pp. 29-40.
[5] Arlery M., Rouquand, A. and Chhim, S. Numerical Dynamic Simulations for the Prediction of Damage and Loss of Capacity of RC Column Subjected to Contact Detonations. 8th International Conference on Fracture Mechanics of Concrete and Concrete Structures (FraMCoS-8), (2013), pp. 1625-1634. [6] Astarlioglu, S., Krauthammer, T., Morency, D. and
Tran, T.P. Behavior of Reinforced Concrete Columns under Combined Effects of Axial and Blast-Induced Transverse Loads. Eng Struct, Vol. 55, (2013), pp. 26–34.
[7] Astarlioglu, S. and Krauthammer, T. Response of Normal-Strength and Ultra-High-Performance Fiber-Reinforced Concrete Columns to Idealized Blast Loads. Eng Struct, Vol. 61, (2014), pp.1–12. [8] Crawford, J.E. State of the Art for Enhancing the
Blast Resistance of Reinforced Concrete Columns with Fiber-Reinforced Plastic. Can J Civ Eng, Vol. 40, (2013), pp.1023–1033.
[9] Chernin, L., Vilnay, M. and Shufrin, I. Blast Dynamics of Beam-Columns via Analytical Approach. International Journal of Mechanical Sciences, Vol. 106, (2016), 331-3 45.
[10] Awrejcewicz, J., Saltykova, O.A., Chebotyrevskiy, Y.B. and Krysko, V.A. Nonlinear Vibrations of the Euler-Bernoulli Beam Subjected to Transversal Load and Impact Actions. NONLINEAR STUDIES, Vol. 18, (2011), pp. 329-364.
52
[12] Bokaian, A. Natural Frequencies of Beams underCompressive Axial Loads. J Sound Vib, Vol. 126, (1988), pp. 49–65.
[13] Timoshenko, S. On the Transverse Vibrations of Bars of Uniform Cross-Section. Philosophical Magazine, Vol. 253, (1992), pp. 125-131.
[14] Virgin, L.N. and Plaut, R. Effect of Axial Load on Forced Vibrations of Beams. J Sound Vib, Vol. 168, (1993), pp. 395–405.
[15] Ahmadian, M.T., Mojahedi, M. and Moeenfard, H. Free Vibration Analysis of a Nonlinear Beam Using Homotopy and Modified Lindstedt-Poincare Methods. Journal of Solid Mechanics, Vol. 1, (2009), pp. 29-36.
[16] Barari, A., Kaliji, H.D., Ghadimi, M. and Domairry, G. Non-linear Vibration of Euler-Bernoulli Beams. Latin American Journal of Solids and Structures, Vol. 8, (2011), pp. 139- 148.
[17] Cormie, D. and Arkinstall, M. SDOF Isn’t Dead – The Role of Single Degree of Freedom Analysis in the Design of Columns against Close-in Blast. Structures Congress (ASCE), Chicago, USA, (2012), pp. 114-125.
[18] Stochino, F. and Carta, G. SDOF Models for Reinforced Concrete Beams under Impulsive Loads Accounting for Strain Rate Effects. Nuc Eng Design, Vol. 276, (2014), pp. 74–86.
[19] Biggs, J.M. Introduction to Structural Dynamics. McGraw-Hill. (1964), 341 pp.
[20] Clough, R.W. and Penzien, J. Dynamics of Structures. 3rd ed. Computers & Structure, (1995), 731 pp.
[21] Virgin, L.N. Vibration of Axially-Loaded Structures. Cambridge University Press, (2007), 351 pp. [22] Rao, S. Vibrations of Continuous Systems. John
Wiley & Sons, (2007), 720 pp.
[23] Chen, W.F. and Atsuta, T. Theory of Beam-Columns, Vol1: In-Plane Behavior and Design. J Ross Pub, (2007), 513 pp.
[24] Humar, J.L. Dynamics of Structures. 3rd ed. CRC Press, (2012), 967 pp.
[25] Carta, G. and Stochino, F. Theoretical Models to Predict the Flexural Failure of Reinforced Concrete Beams under Blast Loads. Eng Struct, Vol. 49, (2013), pp. 306–315.
[26] Akbari, M.R., Ganji, D.D. and Goltabar, A.R. Dynamic Vibration Analysis for Non-linear Partial Differential Equation of the Beam – Columns with Shear Deformation and Rotary Inertia by AGM. Dev Appl Oceanic Eng (DAOE), Vol. 3, (2014),pp. 22-31.
[27] Naval Facilities Engineering Command. Blast Resistant Structures Design Manual 2.08., (1986), 341 pp.
[28] TM 5-1300. The Design of Structures to Resist the Effects of Accidental Explosions. US Dept of Army, Navy & Air Force, Technical Manual, (1990), 1796 pp.
[29] ASCE. Design of Blast Resistant Buildings in Petrochemical Facilities. Reston, (1997), 280 pp.
[30] Unified Facilities Criteria. Structures to Resist the Effects of Accidental Explosions. UFC 3-340-02, US Dept of Defense, (2008), 1867 pp.
[31] Dusenberry DO. Handbook for Blast-Resistant Design of Buildings. USA, JOHN WILEY & SONS, (2010), 484 pp.
[32] Nassr A.A., Razaqpur A.G., Tait M.J., Campidelli M. and Foo S. Single and Multi Degree of Freedom Analysis of Steel Beams under Blast Loading. Nuclear Eng Design, Vol. 242, (2012), pp. 63-77. [33] Nassr, A.A., Razaqpur, A.G., Tait, M.J., Campidelli,
M. and Foo, S. Strength and Stability of Steel Beam Columns under Blast Load. Int J Imp Eng, Vol. 55, (2013), pp. 34-48.
[34] Dragos, J. and Wu, C. Single-Degree-of-Freedom Approach to Incorporate Axial Load Effects on Pressure Impulse Curves for Steel Columns. J Eng Mech 10.1061/ (ASCE) EM.1943-7889.0000818, 04014098, (2014), pp. 1-10.
[35] Morison, C.M. Dynamic Response of Walls and Slabs by Single-Degree-Of-Freedom Analysis-A Critical Review and Revision. Int J Imp Eng, Vol. 32, (2006), pp. 1214–1247.
[36] Oswald, C.J. Comparison of Response from Combined Axial and Blast Loads Calculated with SDOF and Finite Element Methods. In: DDESB Explosive Safety Seminar Portland, Oregon, (2010). [37] Oswald, C. and Bazan, M. Comparison of SDOF
Analysis Results to Test Data for Different Types of Blast Loaded Components. In: Proceeding of Structures Congress, Boston, Massachusetts, (2014), pp. 117-130.
[38] Andersson, S. and Karlsson, H. Structural Response of Reinforced Concrete Beams Subjected to Explosions. Master Thesis, Chalmers University of Technology, Goteborg, Sweden, (2012), 236 pp. [39] Carlsson, M. and Kristensson, R. Structural
Response with Regard to Explosions - Mode Superposition, Damping and Curtailment. Master's Thesis, Lund University, Lund, Sweden, (2012), 199 pp.
[40] Nebuda, D. SBEDS (Single Degree of Freedom Blast Effects Design Spreadsheets). US Army Corps of Engineers Protective Design Center, (2005), 57 pp.
[41] PDC-TR 06-01 Rev 1. Methodology Manual for the Single-Degree-of-Freedom Blast Effects Design Spreadsheets (SBEDS). US Army Corps of Engineers, Protective Design Center (PDC) Technical Report, (2008), 227 pp.
[42] Timoshenko, S.P. and Gere, J.M. Theory of Elastic Stability. 2nd ed. New York: McGraw-Hill, (1963), 541 pp.
[43] Baker, W.E., Cox, P.A., Westine, P.S., Kulesz, J.J. and Strehlow, R.A. Explosion Hazards and Evaluation. Elsevier Scientific, (1983), 826 pp. [44] Li, Q. and Meng, H. Pressure-Impulse Diagram for
53
[45] Florek, J.R. and Benaroya, H. Pulse-Pressure Loading Effects on Aviation and General Engineering Structures-Review. Journal of Sound and Vibration, Vol. 284, (2005), pp. 421–453. [46] Krauthammer, T., Astarlioglu, S., Blasko, J., Soh,
T.B. and Ng, P.H. Pressure–Impulse Diagrams for the Behavior Assessment of Structural Components. Int J Imp Eng, Vol. 35, (2008), pp. 771–783. [47] Dragos, J. and Wu, C. A New General Approach to
Derive Normalized Pressure-Impulse Curves. Int J Imp Eng, Vol. 62, (2013), pp. 1-12.
[48] El-Dakhakhni, W., Mekky, W. and Changiz-Rezaei, S. Vulnerability Screening and Capacity Assessment of Reinforced Concrete Columns Subjected to Blast. J Perform Constr Facil, Vol. 23, (2009), pp. 353– 365.
[49] Ma, G.W., Shi, H.J. and Shu, D.W. P–I Diagram Method for Combined Failure Modes of Rigid-Plastic Beams. Int J Impact Eng, Vol. 34, (2007), 1081–1094.
[50] Shi, H.J., Salim, H. and Ma, G. Using P–I Diagram Method to Assess the Failure Modes of Rigid-Plastic Beams Subjected to Triangular Impulsive Loads. Int J Prot Struct, Vol. 3, (2012), pp. 333– 353.
[51] Brode, H.L. Numerical Solutions of Spherical Blast Waves. J Appl Phys, Vol. 26, (1955), pp. 766-775. [52] Cormie, D., Mays, G. and Smith, P.D. Blast Effects
on Buildings. 2nd ed. Thomas Telford, (2009), 338 pp.
[53] Tse, F.S., Morse, I.E. and Hinkle, R.T. Mechanical Vibrations: Theory and Applications. 2nd ed. USA: Allyn and Bacon, (1978), 449 pp.
[54] Chopra, A.K. Dynamics of Structures: Theory and Applications to Earthquake Engineering. Prentice Hall, (1995), 790 pp.
[55] Stochino, F. and Tattoni, S. Exceptional Actions: Blast Loads on Reinforced Concrete Structures. In: CIAS (Cornell International Affairs Society) Conference, Cornell University, (2013), pp. 215-239.
[56] Fujikake, K., Li, B. and Soeun, S. Impact Response of Reinforced Concrete Beam and Its Analytical Evaluation. J Struct Eng, Vol. 135, (2009), pp. 938– 950.
[57] Zhao, X., Wu, Y.F., Leung, A.Y. and Lam, H.F. Plastic Hinge Length in Reinforced Concrete Flexural Members. In: 12th East Asia-Pacific Conference on Structural Engineering and Construction (EASEC 12), Hong Kong, (2011), pp. 1266-1274.
[58] Paulay, T. and Priestley, M.J.N. Seismic Design of Reinforced Concrete and Masonry Buildings, John Wiley and Sons, New York, (1992), 744 pp.
[59] Mazzoni, S., McKenna, F. et al. OpenSees Command Language Manual. University of California, Berkeley, (2006), 465 pp.
[60] Pacific Earthquake Engineering Research Centre. Open System for Earthquake Engineering Simulation (OpenSees). University of California, Berkeley, (2015).
[61] Mazzoni, S. and McKenna, F. Example 9. Moment-Curvature Analysis of Section, (2006). http://opensees.berkeley.edu/OpenSees/manuals/Exa mplesManual/HTML/3909.html
[62] Mazzoni, S. and McKenna, F. Concrete01 Material -- Zero Tensile Strength, (2006). http://opensees.berkeley.edu/OpenSees/manuals/use rmanual/164.html.
[63] Kent, D. C. and Park, R. Inelastic be havior of reinforced concrete members with cyclic loading. Bulletin of the New Zealand Society for Earthquake Engineering. Vol. 4, (1971), pp. 108-125.
[64] Krauthammer, T., Shanaa, H.M. and Assadi, A. Response of Structural Concrete Elements to Severe Impulsive Loads. Computers Structures, Vol. 53, (1994), pp. 119-130.
[65] Malvar, L.J. and Crawford, J.E. Dynamic Increase Factors for Concrete. 28th DDESB Seminar, Orlando, (1998), pp. 1-18.
[66] Asprone, D., Frascadore, R., Di-Ludovico, M., Prota, A. and Manfredi, G. Influence of Strain Rate on the Seismic Response of RC Structures. Eng Struct, Vol. 35, (2012), pp. 29–36.
[67] Razaqpur, G., Mekky, W. and Foo, S. Fundamental Concepts in Blast Resistance Evaluation of Structures. Canadian Journal of Civil Engineering, Vol. 36, (2009), pp. 1292-1304.
[68] Malvar, L.J. and Crawford, J.E. Dynamic Increase Factors for Steel Reinforcing Bars. 28th DDESB Seminar, Orlando, (1998), pp. 1-18.
[69] Federal Institute of Technology. Model Code 2010, First Complete Draft Vol1. Fib Bulletin 55. Switzerland, (2010), 292 pp.
[70] Fib Fédération Internationale du béton (fib). Code-type models for concrete behavior: State-of-the-art Report. Fib Bulletin No 70, (2013), 196 pp.
[71] Izadifar, R.A., Nourizadeh, A. and Shamshirgar, A. A Material Model for Static and Dynamic Nonlinear Finite Element Modeling of Reinforced Concrete Elements. 4th International Conference on Seismic Retrofitting, Tabriz, (2012), pp. 1-12.
[72] Smith, G.D. Numerical Solution of Partial Differential Equations: Finite Difference Methods. 3rd ed. Oxford University Press, (1985), 350 pp. [73] Dassault Systèmes Simulia Corp. ABAQUS Analysis
User’s Manual Version 6.14-2, (2014).
[74] ACI Committee 318. Building code requirements for structural concrete (ACI 318-14) and commentary. American Concrete Institute, (2014), 519 pp.