RESEARCH
Control of Viscosity of Cementitious
Materials Using Waste Limestone Powder
Dongyeop Han
1, Jin Young Yoon
2and Jae Hong Kim
3*Abstract
Ultra high performance cementitious materials possess high solid volume fraction by a decreased water-to-binder ratio. The use of a high-range water reducing admixture allowed us to obtain the initial fluidity of ultra-high perfor-mance cementitious materials, but its poor workability and significant loss of fluidity remained. Incorporating a high volume of supplementary cementitious materials reportedly weakens workability because they reduce the plastic viscosity of a mix. Hence, in this research, waste limestone powder was tested to evaluate its effect on the rheological properties of cement paste. The results give new insight on controlling the fluidity and plastic viscosity when prepar-ing the mix for ultra-high performance concrete.
Keywords: high performance cementitious materials, waste limestone powder, rheology, viscosity, particles
© The Author(s) 2019. This article is distributed under the terms of the Creative Commons Attribution 4.0 International License (http://creat iveco mmons .org/licen ses/by/4.0/), which permits unrestricted use, distribution, and reproduction in any medium, provided you give appropriate credit to the original author(s) and the source, provide a link to the Creative Commons license, and indicate if changes were made.
1 Introduction
For construction application, concrete development has focused on improving fluidity to assure a fresh state per-formance. The conventional approach was based on the mixture’s water control (both unit water content and water-to-cement ratio); thus, introducing a high-range water-reducing admixture (HRWRA or superplasti-cizer) was an innovative contribution. After introduc-ing the concept of rheology, the fluidity of cementitious materials can be controlled further with yield stress and plastic viscosity. According to Wallevik et al. (2011), many factors influence the yield stress or plastic viscos-ity of cementitious materials. HRWRA is the most widely used method to improve fluidity of cementitious mate-rials due to its ability to decrease the yield stress (Win-nefeld et al. 2007; Mikanovic and Jolicoeur 2008). The recent trend of developing polycarboxylates, the main component of HRWRA, helps decrease viscosity as part of the overall effort to lower yield stress. Incorporating such an HRWRA may control the yield stress and vis-cosity independently, but still the use of supplementary
cementitious materials or filler is an in-hand solution in field.
In practice, it is sometimes inconvenient to handle high performance cementitious materials with a very low water-to-binder ratio (w/b): it shows extremely high plastic viscosity even though enough dosage of HRWRA is incorporated to achieve a sufficient fluidity (Yen et al. 1999; Vikan and Justnes 2007; Mazanec et al. 2009). Hence it is very important to control not only yield stress but also the plastic viscosity of cementitious materials. As a method of controlling the plastic viscosity of cementi-tious materials, there are two well-known ways: increas-ing the sand-to-aggregate ratio for mix design and usincreas-ing a viscosity modifying admixture (Leemann and Winne-feld 2007). The recent trend of manufacturing high per-formance concrete mixtures is changing the common ready mix methodology by decreasing portions of coarse aggregate as well as Portland cement, which is achieved by incorporating supplementary cementitious materials. It also contributes to the plastic viscosity of high perfor-mance concrete.
On the other hand, particles in concrete come in vari-ous sizes, shapes, and forms, e.g., cement, fine aggregate, and coarse aggregate. Therefore, because of these differ-ent size particles, freshly mixed concrete can assume a complex movement (Farzam et al. 2000; Mindess et al.
Open Access
*Correspondence: [email protected]
3 Department of Civil and Environmental Engineering, Korea Advanced Institute of Science and Technology, Daejeon, South Korea
2002; Neville 2012; Mehta and Monteiro 2013). Cement paste can be considered a base substance determining the fluidity of the other materials in the particle hierar-chy of mortar and concrete (Toutou and Roussel 2007; Erdem et al. 2010). Rheological behavior of paste is influ-enced by particle types (Kim et al. 2012) and conditions (Erdoğan et al. 2008; Nair and Ferron 2014; Han and Fer-ron 2015). For cement paste, flocculation and breakage of particles were determined by hydration of particles and colloidal forces (Yang and Jennings 1995; Roussel 2005; Yim et al. 2014; Kim et al. 2016). However, without these interparticle forces in fresh state cement paste, different particle sizes also influence the rheological properties (Pons et al. 2006; Bentz et al. 2012). For different particle sizes and particle size distributions, specific surface and packing density are the main factors dominating rheo-logical behaviors (Roy and Asaga 1979; Coussot 2005; Roussel 2005; Dils et al. 2013) . First, the specific surface of a particle is increased with decreased particle size. Without any repulsive forces such as a water reducer, an increased specific surface induces an increased wettable surface area (Nehdi et al. 1998); thus, the required water content is increased. It can be inferred that an increased specific surface with small particles causes increased yield stress and plastic viscosity. The packing density is a key element, which determines the plastic viscosity of the paste. Based on the idea of inverse fluidity for plas-tic viscosity, parplas-ticles in cement paste gives the paste a higher plastic viscosity than fluid without particles. Fur-thermore, the paste including the particles with a higher maximum packing density (capability of particle number for certain thickness of sheared fluid) has a lower plastic viscosity than the paste including particles with low max-imum packing density (Krieger and Dougherty 1959). In addition, according to the Krieger-Dougherty model (see Eq. 1), the viscosity of the medium (controlled by using a viscosity modifying admixture and the intrinsic viscos-ity (determined by the shape of cement grains) are the factors affecting the viscosity. However, in practice, it is difficult to change the particle shapes in the medium and the intrinsic viscosity. However, for the cement paste system, the most easily controllable factor is the packing density, which is achieved by changing particle size dis-tribution (Toutou and Roussel 2007).
where, η, η0, and [η] are the viscosity of the suspension, the viscosity of the medium, and the intrinsic viscosity, respectively, φ and φm are the volume concentration of
particles and the maximum packing, respectively.
(1)
η η0 =
1− φ
φm −[η]φm
In this research, to control the plastic viscosity of the cement paste, especially, decreasing plastic viscosity, the particles with different sizes were replaced. According to Bentz et al. (2012), by inducing different particle size dis-tribution using fly ash, rheological properties of cement paste was controlled. Although fly ash is a widely used supplementary cementitious material, it is difficult to use fly ash solely for viscosity control because it has its own reactivity with late early-age strength development (Berry et al. 1994; Sebök et al. 2001) and other effects, including the reduction of cement paste pH. Hence, in this research, using waste limestone powder (WLP), influence of rheological properties of the cement paste evaluated, and it is expected to contribute to providing a fundamental idea on controlling plastic viscosity of the ultra-high performance concrete.
2 Experiment
2.1 Materials and Sample Preparation
To evaluate the effect WLP on plastic viscosity of con-crete, our experiment was conducted in the paste phase. Based on the cement pastes of three different low w/b, their viscosities were measured. All mixtures contained superplasticizer. The dosage of superplasticizer was con-trolled from the minimum recommended application, which produced too thick of a mixture to be measured with a rheometer to the maximum application, which produced a mixture showing cement segregation and bleeding. Superplasticizers are used as a chemical admix-ture. For normal cement paste without any dispersing admixture or plasticizer, cement particles are flocculated and coagulated (Yang and Jennings 1995). Therefore, in this research, focusing solely on the relationship between particle conditions provided by the mix design, super-plasticizer was added at a prefixed dosage to achieve a yield stress of zero. The superplasticizer used in this research was a polycarboxylate-based superplasticizer and it is commercially available in South Korea. The WLP was replaced 10%, 20%, and 30% of cement mass as a main control factor. Table 1 summarizes the mixture con-ditions and lists the dosages of superplasticizer.
powder is inert in a concrete mix and can be considered as filler. The WLP was prepared at three different fine-ness levels: because it comes from cement manufacturing powder, the WLP was originally ground into two differ-ent fineness levels. After the grinding process, three dif-ferent WLP s with difdif-ferent fineness levels were obtained: 1880, 4120 and 7340 cm2/g, which were labeled as L2000, L4000 and L7000 powders, respectively. L2000 was the original WLB, and L4000 and L7000 were produced by ball-milling. Their specific gravity was 2.73. The physi-cal properties of cement, and WLP s are summarized in Table 2.
In this research, all tests were conducted in the paste phase. The sample mixtures were mixed with an agitator with a vane-shaped impeller. The mixed sample amount was 130 g. The mixing protocol was introducing powders in the mixing water containing chemical admixtures and mixing at 400 rpm for 5 min. This mixing intensity was chosen according to Han et al.’s research (Han and Fer-ron 2015, 2016) on unexpected flocculation of the parti-cles, foaming, and temperature change with high mixing intensity using a superplasticizer.
2.2 Test Methods
2.2.1 Powder Characteristics
Analyzing the powder properties used in this research is important to understand the relationship between chang-ing rheological properties and various powder combina-tions. Therefore, the particle size distributions of three different WLPs were measured using a light scattering method. Figure 1 shows the results compared with that
of the cement used. Based on these data, specific surface area and mean particle sizes were calculated. Assuming that each particle is a sphere made the calculation simple. Because the cubic root of the measured mass (or volume) distribution had the same density, the diameter distribu-tion and the mean particle size was given by the mean of the diameter distribution. The specific surface area was then obtained by squaring the diameter distribution and then taking its mean. Lastly, the packing density of the particles was calculated by the compressive packing model proposed by de Larrard (1999).
Table 1 Experimental plan.
a The replaced powder was prepared with three different levels of fineness.
Mixture conditions Tests
Water-to-binder ratio Available dosage of SP (%
of binder weight) Replacement ratio of WLP (% of cement weight)a
0.20 3.5, 4.0 0, 10, 20, 30 Powder conditions (Particle size distributions, specific
surface, packing density) Spread test
Plastic viscosity
0.25 0.8, 1.0, 1.2
0.30 0.5, 0.8
Table 2 Physical and chemical properties of the powders. Powder Specific gravity Blaine number
(cm2/g) Fines Smaller than 45 μm (%) Chemical composition (%)
CaO SiO2 Al2O3 Fe2O3 MgO K2O
Cement 3.13 3660 89.0 64.0 19.3 4.4 3.8 2.4 1.3
L2000 2.73 1880 19.7 80.8 10.2 3.4 2.0 1.7 1.0
L4000 4120 40.9
L7000 7340 71.7
2.2.2 Spread Test
The spread of cement paste was measured to intuitively show its fluidity. The test was similar to the slump flow test, ASTM C1611 (ASTM International 2010), but dif-ferent dimensions of slump cone were used. The cone was 62 mm and 70 mm for the top and bottom inner diameter, respectively. The height of the cone was 40 mm. Because of the small size of the cone and well-flow mix-tures, the cone was quickly filled. The flow measurement was conducted at two 90° crossed centerlines of the flown mixture and then averaged.
2.2.3 Rheology Test
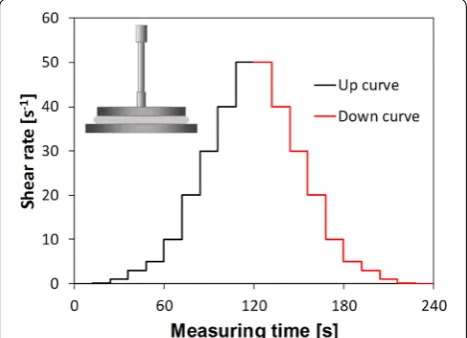
To quantitatively evaluate the rheological behavior of mixtures, each flow curve of the sample mixtures was measured with the rotational MARS III rheometer from Thermo Fisher Scientific, Inc. (Waltham, MA, USA). The measuring geometry used the parallel plates of 35 mm diameter with 1 mm gap. The rheological meas-urement was conducted with the mixture right after the mixing and the temperature was set at 23.5 °C. The relative humidity of the lab was 24%. To obtain the flow curve of each mixture, an applied shear rate was increased with the step-up method. As shown in Fig. 2,
the shear rate was applied with 10 steps up and 10 steps down from 0.01 s−1 to 50 s−1 as 0.01 s−1, 0.1 s−1, 1 s−1, 3 s−1, 5 s−1, 10 s−1, 20 s−1, 30 s−1, 40 s−1 and 50 s−1. Those ranges proved suitable for sensitively and accu-rately simulating the gravity-induced flow of cement-based materials (Kim et al. 2015). Although the flow curves of concrete are generally explained by the Bing-ham fluid model, the measured data in this study gave a zero-yield stress due to the high fluidity of the paste samples. Only plastic viscosity was considered as the rheological property of the samples.
3 Results
3.1 Physical Conditions of Mixed Powders
3.1.1 Particle Condition of Single Powders
Based on the measured particle size distribution, the physical properties of cement, L2000, L4000, and L7000 powder were calculated (see Table 3). As shown in the table, the change on the packing density was much less than the variation of mean particle size. Compared with the cement powder, the original WLP (L2000) con-sisted of larger particles. For WLP, as the grinding was increased, the mean particle size decreased and the spe-cific surface increased. On the other hand, as the grinding increased, the packing density decreased. This was con-sidered as the milling process continued; thus, the size of the WLP particles was equalized by grinding. Consider-ing cement powder, the raw WLP had the highest pack-ing density. Based on these results, for a spack-ingle powder, the raw WLP consisted of relatively well-graded particles.
3.1.2 Particle Conditions of Mixed Powders
Based on the single powder physical properties (see Table 3), mixed powder physical properties are calculated and summarized in Table 4. Since the density of WLP was lower than that of cement, as the replacing content of WLP was increased, the entire density of the powder was decreased. For packing density of the mixed pow-ders, when WLP was used to replace 20% of the standard content, the packing density was calculated at its highest
Fig. 2 Applied shear rate with the measuring geometry 35 mm-parallel plates.
Table 3 A single powder conditions calculated using PSD. Powder Packing density Mean particle size
(μm) Specific surface (μm2/kg) D10 (μm) D50 (μm) D90 (μm)
Cement 0.930 0.66 2.36 29.6 5.60 0.81
L2000 0.960 1.04 1.49 40.7 14.97 1.91
L4000 0.940 0.59 2.06 32.9 8.19 0.75
value regardless of WLP particle size. Similar to the pack-ing density result, the specific surface of the powders showed the highest value at 20% WLP replacement.
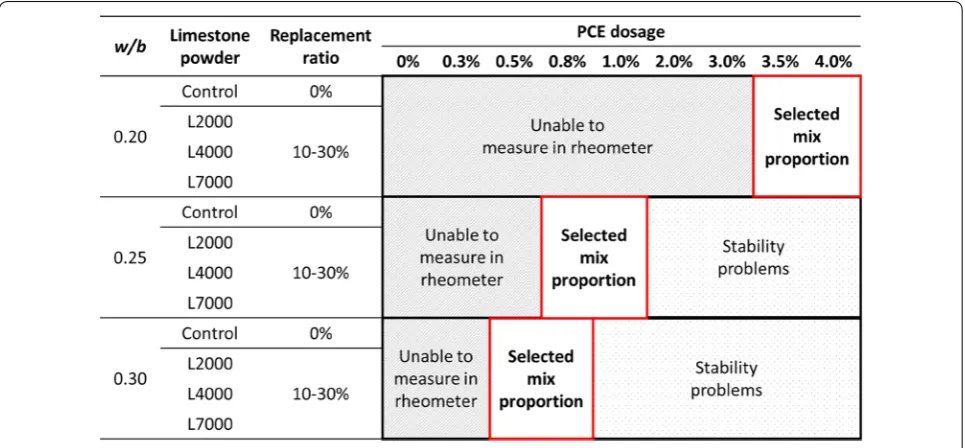
3.2 Determining Acceptable Dosage of Superplasticizer
The acceptable range of the superplasticizer dosage was determined for the paste samples to obtain the plas-tic viscosity of 0.1 to 2.0 Pa·s at which it was unable to
measure with the rheometer and the plastic viscosity at which bleeding was observed. The acceptable ranges of the pastes depending on water-to-cement ratios are shown in Fig. 3. As the w/b was decreased, a higher
dosage of superplasticizer was needed. Additionally, the yield stress of the cement paste decreased toward zero. Notably, it was impossible to operate the rheometer out of the acceptable range (e.g., if the plug flow had too high of a viscosity and yield stress) or if a migration of the mixing water was evident (i.e., too low of a viscos-ity). Hence, it can be stated that depending on the w/b or volume fraction, superplasticizers have a certain threshold or optimum dosage. Although this threshold can vary depending on the mixture’s chemical proper-ties, cement powder fineness, shape or properties of the polymer chain, and volume fraction of superplasticizer, Table 4 The mixed powder conditions calculated.
a C and L mean cement and WLP, respectively, so C90L10 means the binder consisted with 90% cement and 10% WLP.
Powdera Packing density Mean particle size
(μm) Specific surface (μm2/kg) D10 (μm) D50 (μm) D90 (μm)
Control 0.930 0.66 2.36 29.6 5.6 0.81
C90L10
L2000 0.930 0.65 1.74 32.4 7.6 0.87
L4000 0.931 0.64 1.85 32.4 6.3 0.81
L7000 0.927 0.66 1.89 29.5 6.0 0.81
C80L20
L2000 0.935 0.67 1.52 36.1 7.2 0.89
L4000 0.937 0.64 1.74 30.4 8.2 0.81
L7000 0.939 0.63 1.72 29.0 5.7 0.81
C70L30
L2000 0.933 0.63 1.53 39.2 9.2 0.98
L4000 0.933 0.64 1.88 32.2 8.2 0.81
L7000 0.927 0.66 1.94 29.5 6.0 0.81
this threshold is not discussed because it is out of the work scope. Also, based on this result, it is considered that there is a limitation to superplasticizer dosage when decreasing the viscosity of cement paste depending on a certain w/b or volume fraction. Therefore, it can be stated that to overcome this limitation, other factors should be controlled such as changing the volume fraction or applying an improved superplasticizer.
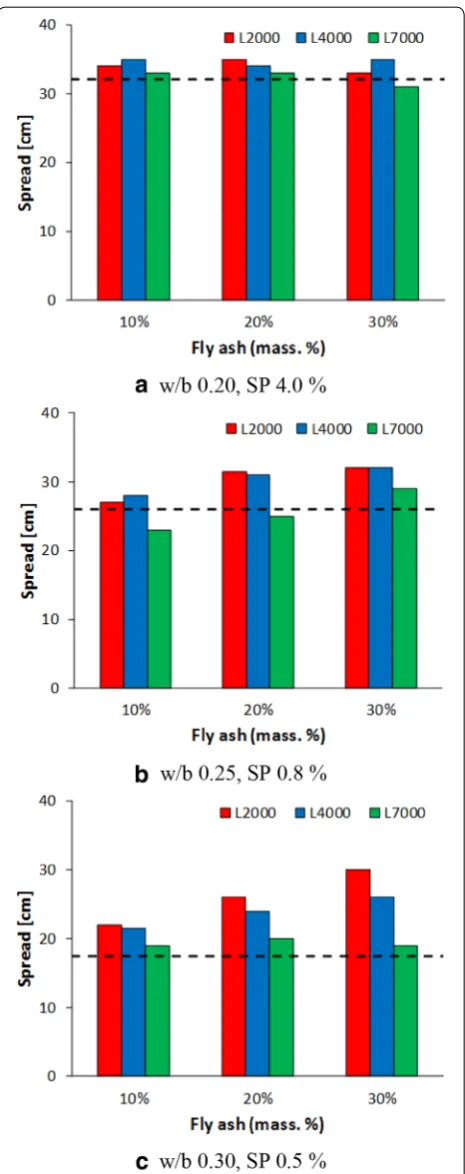
3.3 Fluidity Analysis with Spread Test
During the test, two values were measured: (1) a final spread diameter and (2) time to spread of 200 mm. According to former research (Saak et al. 2004; Flatt 2004; Roussel and Coussot 2005; Wallevik 2006; Tregger et al. 2008; Rößler et al. 2008; Laskar 2009), it is known that the slump and the slump flow of cementitious materials relate to yield stress. Additionally, when the time to reach a certain distance for cementitious materials is measured, it can be considered as a flowing speed; hence, it can be connected with plastic viscosity (Tregger et al. 2012).
Within the acceptable ranges for each mixture, spread diameters are summarized in Fig. 4. Unlike many other research efforts, in this case, it was impossible to com-pare or contrast with the mixtures of different w/ bs because the dosage of a superplasticizer will vary depending on whether mixtures achieve “zero” yield stress. Hence, the analysis of the w/b effect on the pastes’ behavior are invalid in this research. As shown in the fig-ure, most cases incorporating WLP showed an improved fluidity with an increased spread distance. Depending on different fineness grades of WLP, generally, L2000 pow-der consisted of relatively large size particles and was the most efficient on improving fluidity with a longer spread distance. Additionally, as the particle size was decreased from L2000 to L7000, the fluidity of cement pastes decreased with a shorter spread distance. This can be deduced as an increased yield stress based on former research, although all mixtures used in this research are controlled to zero yield stress by the superplasticizer or other factors including the fact that factors can influ-ence plastic viscosity, which could have a major effect on spread distance. In addition, the time it takes to imple-ment a 200 mm-spread was measured for the pastes, and the results were also listed in Table 5. However, we could not capture the 200 mm-spread, which is the trend for all mixtures. Only the mixtures with w/b 0.30 showed a trend of decreased time as the particle size of the powder was becoming small. Therefore, it can be stated that a vis-cosity measurement using a spread test is not appropriate
3.4 Viscosity Analysis
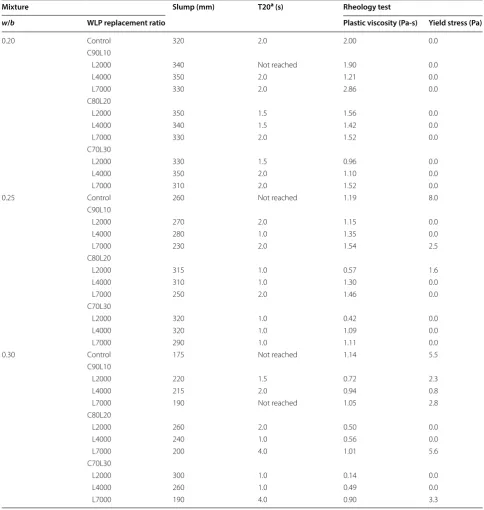
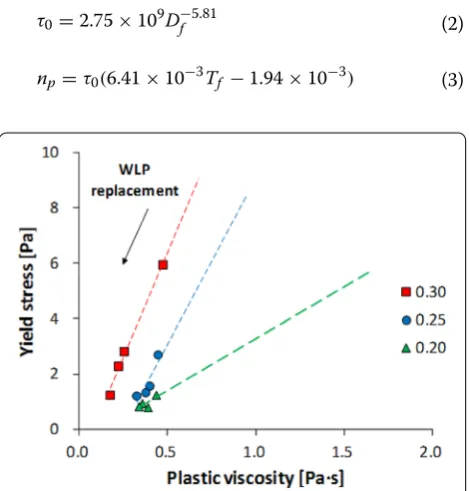
According to the powder properties, plastic viscosity was obtained and compared in Fig. 5. Compared with a con-trol mixture without any WLP replacement, most mixtures incorporating WLP show a lower plastic viscosity. Depend-ing on the w/b of the mixtures, as the w/b decreases, the plastic viscosity increases. The trend is not immediately
evident because the superplasticizer dosage is the main factor affecting fluidity enhancement. A certain thresh-old is set to control the plastic viscosity of a very low w/b concrete mixture by powder replacement or particle con-ditions depending on the w/b as it relates to the WLP. For the mixture of 0.30 w/b with 0.5% superplasticizer, as the replacement ratio of WLP increased, the plastic viscosity Table 5 Summary of the fluidity test results.
a T20 means the time to reach 20 mm spread distance.
Mixture Slump (mm) T20a (s) Rheology test
w/b WLP replacement ratio Plastic viscosity (Pa-s) Yield stress (Pa)
0.20 Control 320 2.0 2.00 0.0
C90L10
L2000 340 Not reached 1.90 0.0
L4000 350 2.0 1.21 0.0
L7000 330 2.0 2.86 0.0
C80L20
L2000 350 1.5 1.56 0.0
L4000 340 1.5 1.42 0.0
L7000 330 2.0 1.52 0.0
C70L30
L2000 330 1.5 0.96 0.0
L4000 350 2.0 1.10 0.0
L7000 310 2.0 1.52 0.0
0.25 Control 260 Not reached 1.19 8.0
C90L10
L2000 270 2.0 1.15 0.0
L4000 280 1.0 1.35 0.0
L7000 230 2.0 1.54 2.5
C80L20
L2000 315 1.0 0.57 1.6
L4000 310 1.0 1.30 0.0
L7000 250 2.0 1.46 0.0
C70L30
L2000 320 1.0 0.42 0.0
L4000 320 1.0 1.09 0.0
L7000 290 1.0 1.11 0.0
0.30 Control 175 Not reached 1.14 5.5
C90L10
L2000 220 1.5 0.72 2.3
L4000 215 2.0 0.94 0.8
L7000 190 Not reached 1.05 2.8
C80L20
L2000 260 2.0 0.50 0.0
L4000 240 1.0 0.56 0.0
L7000 200 4.0 1.01 5.6
C70L30
L2000 300 1.0 0.14 0.0
L4000 260 1.0 0.49 0.0
decreased. The other mixtures with a lower w/b and vari-ous dosages of superplasticizer gives a reduced plastic viscosity except for L7000. For example, in the case of the mixture 0.25 w/b with 0.8% superplasticizer, at 10% to 20% of replacement ratio of WLP, the results follow at simi-lar trend while at 30% of the WLP replacement ratio, the plastic viscosity decreased considerably compared to other mixtures. This can be caused by an excessively high superplasticizer dosage of 3.5% to 4.0%. For the mixtures of 0.30 and 0.25 w/b with 0.5% and 0.8% superplasticizer, as the replacement ratio of WLP increased, the plastic vis-cosity decreased, and this trend was more evident than the mixture with 0.20 w/b. Among the same replacement ratio of the WLP, as particle size or fineness was decreased from L2000 to L7000, plastic viscosity of the mixture was increased. This increased plastic viscosity with smaller par-ticles was caued by the parpar-ticles’ increased specific surface.
4 Discussion
There is a certain range to control (precisely decrease) the plastic viscosity by replacing powder with WLP. The range was additionally investigated based on yield stress and plas-tic viscosity. Previous researches proposed the relationships of the mini-slump flow-yield stress and the time to reach final spread-plastic viscosity of pastes mixtures (Rous-sel and Coussot 2005; Wallevik 2006; Tregger et al. 2008). Thus, the additional mini-slump flow test was conducted with L2000-cement paste mixtures having the same mix proportion. The yield stress (τ0 in Pa) and apparent plastic viscosity (np in Pa.s) of mixture can be calculated as
(2)
τ0=2.75×10⁹D−f 5.81
(3)
np=τ0(6.41×10⁻³Tf −1.94×10⁻³)
Fig. 5 Influence of WLP replacement ratio on plastic viscosity of the pastes depending on different WLP fineness.
where Df and Tf are the final mini-slump flow
meas-urement in meters and the time measured in seconds, respectively. Figure 6 shows a Rheolograph image of the example mixtures. All results show that the higher WLP replacement induces the lower rheological prop-erties regardless of w/b, which is more clearly shown in the samples of 0.30 water-to-cement ratio. This corre-sponds with the previous results of the plastic viscosity
measurement. Another understanding concerning the Rheolograph reading is that a lower w/b sample has a higher plastic viscosity at the same level of yield stress (or fluidity). However, the argument on the plastic viscos-ity of the pastes produced with 0.25 or 0.20 w/b is hardly obtained here and so the plastic viscosity measurement in the previous section is still effective for a quantitative evaluation.
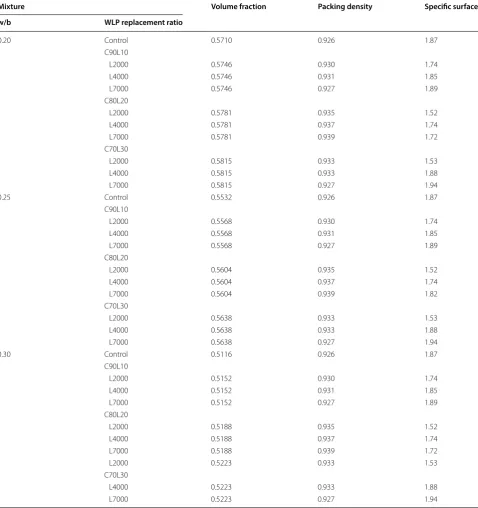
Table 6 Summary of the powder properties.
Mixture Volume fraction Packing density Specific surface
w/b WLP replacement ratio
0.20 Control 0.5710 0.926 1.87
C90L10
L2000 0.5746 0.930 1.74
L4000 0.5746 0.931 1.85
L7000 0.5746 0.927 1.89
C80L20
L2000 0.5781 0.935 1.52
L4000 0.5781 0.937 1.74
L7000 0.5781 0.939 1.72
C70L30
L2000 0.5815 0.933 1.53
L4000 0.5815 0.933 1.88
L7000 0.5815 0.927 1.94
0.25 Control 0.5532 0.926 1.87
C90L10
L2000 0.5568 0.930 1.74
L4000 0.5568 0.931 1.85
L7000 0.5568 0.927 1.89
C80L20
L2000 0.5604 0.935 1.52
L4000 0.5604 0.937 1.74
L7000 0.5604 0.939 1.82
C70L30
L2000 0.5638 0.933 1.53
L4000 0.5638 0.933 1.88
L7000 0.5638 0.927 1.94
0.30 Control 0.5116 0.926 1.87
C90L10
L2000 0.5152 0.930 1.74
L4000 0.5152 0.931 1.85
L7000 0.5152 0.927 1.89
C80L20
L2000 0.5188 0.935 1.52
L4000 0.5188 0.937 1.74
L7000 0.5188 0.939 1.72
L2000 0.5223 0.933 1.53
C70L30
L4000 0.5223 0.933 1.88
In summary, for mixtures incorporating WLP, the vis-cosity of the paste depends on the mixture conditions with three effect factors: (1) w/b (2) WLP replacement ratio, and (3) fineness of the WLP. The different powder properties such as volume fraction, packing density, and specific surface are summarized in Table 6. Depending on the w/b of the mixtures, as the w/b of the mixture was decreased, the plastic viscosity increased. The w/b can be converted into the volume fraction of the mix-tures depending on the mix proportion. Thus, increas-ing volume fraction increases the plastic viscosity of the suspension. In aspect of volume fraction depending on w/b, the plastic viscosity was increased with increased volume fraction. However, within the same w/b, although the volume fraction increased with the increased replace-ment ratio of WLP, the plastic viscosity decreased (see Fig. 7). Namely, the replacement ratio of the WLP increases the volume fraction and changes other fac-tors, which decrease plastic viscosity. The other factors dominate the plastic viscosity rather than the volume fraction with WLP replacement in this research scope. Regarding the factors related to replacement of the WLP, the volume fraction increased, and the packing density also changed. We found that hydrating activity can be decreased with a decreased amount of cement. For pack-ing density with WLP, the packpack-ing density was calculated based on the particle size by analyzing data from pow-ders, but the actual paste had dispersed particles in the suspension (or cement paste) with superplasticizer and hydration product. Therefore, in this research scope, it is difficult to show the influence of packing density related to the replacement ratio of WLP on plastic viscosity. In addition, the hydration activity of suspension decreases when replaced with WLP without reactivity and ioniza-tion. Hence, it may decrease the ionic concentration for
aggregation of cement particles and hydration rate (Fer-ron 2008; Han 2014; Han and Ferron 2015, 2016). In this research, although these ionic conditions and hydration kinetics were not evaluated, based on former research, their effect can be considerable. Therefore, by using WLP, the possibility of controlling plastic viscosity of ultra-high performance concrete mixture was provided. Although there are some limitations, based on this research scope, the fineness of WLP with specific surface is considered an important factor rather than packing density.
5 Conclusions
To provide a fundamental idea on a way to reduce plastic viscosity of ultra-high performance concrete with a high volume fraction of powder, in this research, the fluidity change depending on replacing WLP was evaluated. For the WLP, as a byproduct of the cement manufacturing industry, three different fineness grades of powders were prepared. Therefore, the influence of the w/b, the WLP replacement ratio, and the fineness of WLP on fluid-ity and plastic viscosfluid-ity of the cement paste was evalu-ated. Depending on the different factors related to the mixture, fluidity and plastic viscosity varied. First of all, depending on the powder properties of fineness or the replacement ratio, the powder properties were changed, such as packing density, specific surface and volume fraction with w/b. From the spread test, replacing WLP caused increased spreading distance with improved flu-idity. Hence, all these changed powder properties were expected to influence fluidity or plastic viscosity of the mixtures, but it was difficult to match with a linear cor-relation. It is considered that the complex dispersing con-ditions in suspension with superplasticizer induce the complex relationship with powder properties. However, it was not a linear relationship, and the volume fraction, packing density, and specific surface were related to the plastic viscosity of the paste.
Abbreviations
WLP: waste limestone powder; HRWRA : high-range water-reducing admixture.
Authors’ contributions
DH contributes to data analysis and draft writing; JYY accomplished neces-sary experiments; and JHK led the study and discussion. All authors read and approved the final manuscript.
Author details
1 Department of Architectural Engineering, and Engineering Research Institute, Gyeongsang National University, Jinju, South Korea. 2 School of Urban and Environmental Engineering, Ulsan National Institute of Science and Technology, Ulsan, South Korea. 3 Department of Civil and Environmental Engineering, Korea Advanced Institute of Science and Technology, Daejeon, South Korea.
Acknowledgements
This research was supported by Basic Science Research Program through the National Research Foundation of Korea (NRF) funded by the Ministry of Sci-ence, ICT & Future Planning (NRF-2015R1C1A1A02036892).
Competing interests
The authors declare that they have no competing interests.
Availability of data and materials Not applicable.
Funding
Basic Science Research Program through the National Research Founda-tion of Korea (NRF) funded by the Ministry of Science, ICT & Future Planning (NRF-2015R1C1A1A02036892).
Publisher’s Note
Springer Nature remains neutral with regard to jurisdictional claims in pub-lished maps and institutional affiliations.
Received: 2 May 2018 Accepted: 28 November 2018
References
ASTM International. (2010). ASTM C1611, Standard test method for slump flow of self-consolidating Concrete. West Conshohocken: ASTM international. ASTM International. (2012). ASTM C150, Standard Specification for Portland
Cement. West Conshohocken: ASTM International.
Bentz, D. P., Ferraris, C. F., Galler, M. A., & Hansen, A. S. (2012). Influence of particle size distributions on yield stress and viscosity of cement–fly ash pastes. Cement and Concrete Research,42, 404–409.
Berry, E. E., Hemmings, R. T., & Zhang, M. H. (1994). Hydration in high-volume fly ash concrete binders. ACI Materials Journal,91, 382–389.
Coussot, P. (2005). Rheometry of pastes, suspensions, and granular materials: Applications in industry and environment. New Jersey: John Wiley & Sons Inc.
de Larrard, F. (1999). Concrete mixture proportioning. London: E & FN SPON. Dils, J., Boel, V., & Schutter, G. (2013). Influence of cement type and mixing pressure on air content, rheology and mechanical properties of UHPC. Construction and Building Materials,41, 455–463.
Erdem, K., Khayat, K. H., & Yahia, A. (2010). Correlating Rheology of Self-Con-solidating Concrete to Corresponding Concrete-Equivalent Mortar. ACI Materials Journal,106, 154–160.
Erdoğan, S., Martys, N., Ferraris, C., & Fowler, D. (2008). Influence of the shape and roughness of inclusions on the rheological properties of a cementi-tious suspension. Cement and Concrete Composites,30, 393–402. Farzam H., Hogan M. B., Holub E. P., et al (2000) ACI 116R-00 cement and
con-crete terminology reported by ACI Committee 116.
Ferron, R. P. (2008). Formwork pressure of self-consolidating concrete: Influence of flocculation mechanisms, structural rebuilding, Thixotropy and Rheology. Evanston: Northwestern University.
Flatt, R. J. (2004). Towards a prediction of superplasticized concrete rheology. Materials and Structures,37, 289–300.
Han, D. (2014). Flow behavior and microstructure of cement-based materials. Austin: The University of Texas at Austin.
Han, D., & Ferron, R. (2015). Effect of mixing method on microstructure and rheology of cement paste. Construction and Building Materials,93, 278–288.
Han, D., & Ferron, R. D. (2016). Influence of high mixing intensity on rheology, hydration, and microstructure of fresh state cement paste. Cement and Concrete Research,84, 95–106. https ://doi.org/10.1016/j.cemco nres.2016.03.004.
Kim, J., Jang, H., & Yim, H. (2015). Sensitivity and accuracy for rheological simu-lation of cement-based materials. Computers and Concrete,15, 903–919. Kim, J. H., Noemi, N., & Shah, S. P. (2012). Effect of powder materials on the
rheology and formwork pressure of self-consolidating concrete. Cement and Concrete Composites,34, 746–753. https ://doi.org/10.1016/j.cemco ncomp .2012.02.016.
Kim, J. H., Yim, H. J., & Ferron, R. D. (2016). In situ measurement of the rheologi-cal properties and agglomeration on cementitious pastes. Journal of Rheology,60, 695–704.
Krieger, I., & Dougherty, T. (1959). A mechanism for non-Newtonian flow in suspensions of rigid spheres. Transactions of the Society of Rheology,3, 137–152.
Laskar, A. I. (2009). Correlating slump, slump flow, vebe and flow tests to rheological parameters of high-performance concrete 2. Materials and mix proportions. Materials Research,12, 75–81.
Leemann, A., & Winnefeld, F. (2007). The effect of viscosity modifying agents on mortar and concrete. Cement and Concrete Composites,29, 341–349. Mazanec, O., Lowke, D., & Schießl, P. (2009). Mixing of high performance
concrete: Effect of concrete composition and mixing intensity on mixing time. Materials and Structures,43, 357–365. https ://doi.org/10.1617/s1152 7-009-9494-y.
Mehta, P., & Monteiro, J. (2013). Concrete: Microstructure, properties, and materi-als. New York: McGraw-Hill.
Mikanovic, N., & Jolicoeur, C. (2008). Influence of superplasticizers on the rheol-ogy and stability of limestone and cement pastes. Cement and Concrete Research,38, 907–919.
Mindess, S., Young, J., & Darwin, D. (2002). Concrete. New Jersey: Prentice Hall. Nair, S. D., & Ferron, R. D. (2014). Set-on-demand concrete. Cement and Concrete
Research,57, 13–27. https ://doi.org/10.1016/j.cemco nres.2013.12.001. Nehdi, M., Mindess, S., & Aı̈tcin, P. (1998). Rheology of high-performance
concrete: Effect of ultrafine particles. Cement and Concrete Research,28, 687–697.
Neville, A. (2012). Properties of concrete. Harlow: Pearson Education Limited. Pons, M.-N., Milferstedt, K., & Morgenroth, E. (2006). Modeling of chord length
distributions. Chemical Engineering Science,61, 3962–3973.
Rößler, C., Eberhardt, A., Kučerová, H., & Möser, B. (2008). Influence of hydration on the fluidity of normal Portland cement pastes. Cement and Concrete Research,38, 897–906. https ://doi.org/10.1016/j.cemco nres.2008.03.003. Roussel, N. (2005). Steady and transient flow behaviour of fresh cement pastes.
Cement and Concrete Research,35, 1656–1664.
Roussel, N., & Coussot, P. (2005). “Fifty-cent rheometer” for yield stress measure-ments: From slump to spreading flow. Journal of Rheology,49, 705–718. https ://doi.org/10.1122/1.18790 41.
Roy, D., & Asaga, K. (1979). Rheological properties of cement mixes: III. The effects of mixing procedures on viscometric properties of mixes contain-ing superplasticizers. Cement and Concrete Research,9, 731–739. Saak, A. W., Jennings, H. M., & Shah, S. P. (2004). A generalized approach for
the determination of yield stress by slump and slump flow. Cement and Concrete Research,34, 363–371.
Sebök, T., Šimonı́k, J., & Kulı́sek, K. (2001). The compressive strength of samples containing fly ash with high content of calcium sulfate and calcium oxide. Cement and Concrete Research,31, 1101–1107. https ://doi. org/10.1016/S0008 -8846(01)00506 -3.
Toutou, Z., & Roussel, N. (2007). Multi scale experimental study of concrete rheology: From water scale to gravel scale. Materials and Structures,39, 189–199. https ://doi.org/10.1617/s1152 7-005-9047-y.
Tregger, N., Ferrara, L., & Shah, S. P. (2008). Identifying viscosity of cement paste from mini-slump-flow test. ACI Materials Journal,105, 558–566.
Tregger, N., Gregori, A., Ferrara, L., & Shah, S. (2012). Correlating dynamic segre-gation of self-consolidating concrete to the slump-flow test. Construction and Building Materials,28, 499–505.
Vikan, H., & Justnes, H. (2007). Rheology of cementitious paste with silica fume or limestone. Cement and Concrete Research,37, 1512–1517. https ://doi. org/10.1016/j.cemco nres.2007.08.012.
Wallevik, J. E. (2006). Relationship between the Bingham parameters and slump. Cement and Concrete Research,36, 1214–1221. https ://doi. org/10.1016/j.cemco nres.2006.03.001.
Wallevik, O. H., & Wallevik, J. E. (2011). Rheology as a tool in concrete sci-ence: The use of rheographs and workability boxes. Cement and Concrete Research,41, 1279–1288. https ://doi.org/10.1016/j.cemco nres.2011.01.009.
Yang, M., & Jennings, H. M. (1995). Influences of mixing methods on the micro-structure and rheological behavior of cement paste. Advanced Cement Based Materials,2, 70–78.
Yen, T., Tang, C., Chang, C., & Chen, K. (1999). Flow behaviour of high strength high-performance concrete. Cement and Concrete Composites,21, 413–424.