ORIGINAL ARTICLE
Chuanshuang Hu · Min Xiao · Haibin Zhou Wei Wen · Hong Yun
Damage detection of wood beams using the differences in local
modal fl exibility
Abstract Local damage such as knots, decay, and cracks can result in a reduction of service life due to mechanical and environmental loadings. In wood construction, it is very important to evaluate the weakest location and to detect damage at the earliest possible stage to avoid future cata-strophic failure. In this study, modal testing was carried out on wood beams to generate the fi rst two mode shapes. A novel statistical algorithm was proposed to extract the damage indicator by computing the local modal fl exibility before and after damage in timbers. Different damage severities, damage locations, and damage counts were simu-lated by removing mass from intact beams to verify the algorithm. The results indicated that the proposed statistical algorithm is effective and suitable for the damage scenarios considered. The algorithm was reliable for detecting and locating local damage under different damage scenarios. The peak values of the damage indicators computed from the fi rst two mode shapes were sensitive to different damage severities and locations. This approach was also reliable for detecting multiple defects.
Key words Damage detection · Wood products · Modal fl exibilities
Introduction
Local damage, which may be caused by an initial local dis-turbance due to natural defects/fungal decay, and crack development caused by mechanical and environmental loading during service result in the reduction of system performance, structural safety, and integrity. It is critical to monitor the weakest location in a wooden structure and detect damage at the earliest possible stage to avoid future catastrophic fracture. It has been reported that vibration-based methods are a potential tool to measure changes in dynamic characteristics such as resonant frequencies, modal damping, and mode shapes for damage detection in timber engineering.1–3
We reported in previous studies that the statistical parameters directly computed from mode shapes could be used to describe local disturbances due to local defects.4,5
However, it is diffi cult to detect defects that are close to the bearing points or the midspan point because the ment mode shape is a cumulative function of the displace-ments. Pandey et al. reported that modal fl exibility was better for detecting damage than the modal parameters of the mode shape and frequencies.6
In this study, a novel statistical algorithm was proposed to detect damage in wood beams based on the modal fl exibility curvatures.
Materials and methods
Four groups of uniform clear beams without any defects after being visually graded were cut from a log of dragon spruce (Picea asperata) and their moisture contents were condi-tioned to around 12%. The beam dimensions were 2000 mm
× 25 mm × 50 mm (length × width × thickness). Different damage scenarios were simulated by removing mass from the intact beams to study the effects of different damage severi-ties and locations, including multiple defects, on the proposed method; the different damage scenarios are listed in Table 1. A rectangular gap was cut on the bottom of the sample beams. The positions were 3/25, 6/25, 12/25, and 18/25 of the
Received: January 22, 2011 / Accepted: April 21, 2011 / Published online: August 2, 2011 DOI 10.1007/s10086-011-1200-3
C. Hu (*) · W. Wen · H. Yun
Department of Wood Science and Engineering, Faculty of Forestry, South China Agricultural University, Wushan Road, Tianhe, Guangzhou 510642, P.R. of China
Tel. +86-20-85280256; Fax +86-20-85280256 e-mail: [email protected] M. Xiao
School of Architecture, South China University of Technology, Wushan Road, Tianhe, Guangzhou 510642, P.R. of China H. Zhou
span, which means that the gaps were 0.24, 0.48, 0.96, and 1.44 m from one end. The gap length l was 5 mm along the beam length. The losses of the second axial moment of area were 27.1%, 48.8%, and 65.7% when the gap heights h were 5, 10, and 15 mm, respectively. The value of the loss of the second axial moment of area was obtained as follows:
1
12 12 100
3 3
− ⎛
⎝⎜ Ebh EbH ⎞⎠⎟∗ % (1)
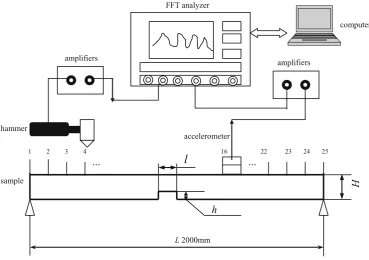
where H and h are the beam height and the gap height (see Fig. 1), and E and b are elasticity of modulus and the width of the beam.
The system schematic is shown in Fig. 1. The measuring system consisted of an impact hammer, an accelerometer, two preamplifi ers, and a dual-channel fast Fourier transform (FFT) analyzer. Each beam was tested before and after defects were added. Beams were simple supported on two specifi c steel plates with rollers that had much greater mass than the beam. The part between the supporting points was subdivided into 25 small equal block elements by 24 center-symmetric impacting points along the algebraic center point
of the beam length. The beam was impacted by the hammer point by point and the resonant signal was picked up by an accelerometer, which was fi xed at the 16th point. The output signals from the hammer and the accelerometer were ampli-fi ed by two preampliampli-fi ers and recorded simultaneously using a dual-channel FFT analyzer. Then the data were dumped from the FFT analyzer to a PC for postprocessing. The postprocessing software was developed in the MatLab program language for damage identifi cation.
Damage-detecting algorithms
Modal fl exibility is more sensitive to describe local distur-bance of the structure because it combines information of frequencies and mode shapes. It can be expressed as:
F T
[ ]
=[ ][ ] [ ]
Φ Ω−1 Φ(2)
where [Φ] represents the normalized mode shapes and [Ω] represents the natural frequencies.
Table 1. Simulated damage scenarios
No. #1 #2 #3 #4 # 5 #6 #7
Scenario 6L 6M 6S 3L 12L 12L18L 12S18S
Gap length l (mm) 5 5 5 5 5 5 5
Position 6 6 6 3 12 12 and 18 12 and 18
Gap height h (mm) 5 10 15 5 5 5 15
Loss of the second axial moment of area (%) 27.1 48.8 65.7 27.1 27.1 27.1 and 27.1 65.7 and 65.7 L, M, and S indicate that the damage severity was light, middle, and serious, respectively
The modulus used to compute the loss of stiffness was kept constant
computer
16
...
...
1
FFT analyzer
L2000mm amplifiers
amplifiers
hammer
sample
accelerometer
H
l
h
2 3 4 22 23 24 25
Fig. 1. Schematic of the
0.00 2.00 4.00 6.00 8.00 10.00 12.00
1 3 5 7 9 11 13 15 17 19 21 23 25 Impact points
Damage indicators
6L
6M 6S Fig. 2. Effects of damage
severity on damage indicators. L, light damage, M, middle-level damage, S, severe damage
Let ji
(j)
be the ith row and jth column element of [Φ], then Eq. 2 can be rewritten as:
[ ] ( ) ( ) ( ) ( ) ( ) ( ) ( ) ( ) ( ) F n n
n n n
n = ⎡ ⎣ ⎢ϕϕ ϕϕ ϕϕ ϕ ϕ ϕ 1 1 1 2 1 2 1 2 2 2 1 1 … ⎢⎢ ⎢ ⎢ ⎤ ⎦ ⎥ ⎥ ⎥ ⎥ ⎡ ⎣ ⎢ ⎢ ⎢ ⎢ ⎤ ⎦ ⎥ ⎥ ⎥ ⎥ − − − ω ω ω ϕ ϕ ϕ ϕ ϕ 1 2 2 2 2 1 1 2 1 1 1 2 2 … n n ( ) ( ) ( ) ( ) (( ) ( ) ( ) ( ) ( ) 2 2 1 2 ϕ ϕ ϕ ϕ n n n n n ⎡ ⎣ ⎢ ⎢ ⎢ ⎢ ⎤ ⎦ ⎥ ⎥ ⎥ ⎥ (3)
High-level mode shapes have tiny impacts on the modal fl exibilities because the modal fl exibilities have an inverse proportion to the powers of the natural frequencies. It is reasonable to build the modal fl exibilities using the previ-ous order mode shapes. Only the fi rst and second mode shapes were used in this study to build the modal fl exibili-ties, with the ultimate purpose of computing damage indica-tors. The local modal fl exibilities can be expressed by as:
[ ] ( ) ( ) ( ) ( ) ( ) ( ) F j j j j j j j j j j j j = = = =
∑
∑
∑
ϕ ϕ ω ϕ ϕ ω ϕ ϕ ω 1 1 2 1 2 1 2 2 1 2 2 1 2 12 ϕϕ ϕ
ω 2 2 2 1 2 2 2 ( )j ( )j
j j= ×
∑
⎡ ⎣ ⎢ ⎢ ⎢ ⎢ ⎤ ⎦ ⎥ ⎥ ⎥ ⎥ (4)The difference of the modal fl exibilities of the intact beam before and after damage [ΔF] can be expressed as:
ΔF F F
[ ]
=[ ]
D −[ ]
H(5)
where [FH
] and [FD
] are the modal fl exibilities of the beam before and after damage.
The damage indicators DDIj can be extracted from the column element of the matrix [ΔF], which is expressed as:
DDI j
j
j
i j
F M
=max[Δ ], −
σ (6)
where Mj and σj are the mean and standard deviation of the jth column of the matrix [ΔF]; max|•| represents the maximum value of the absolute value; i = 1, 2 and j = 1, 2 . . . , 25.
Then the normalized damage indicators DDIj were used to rebuilid the new matrix [DDI]j in a sequence considering
the impacting points.The modal fl exibilities will vary where the damage is located. The elements of matrix [DDI]j match in correspondence with the impact points and their values are used as judgments to detect damage.
Results and discussion
It has been reported that information on natural frequen-cies and mode shapes comprises a potential nondestructive indicator to evaluate and grade timbers7
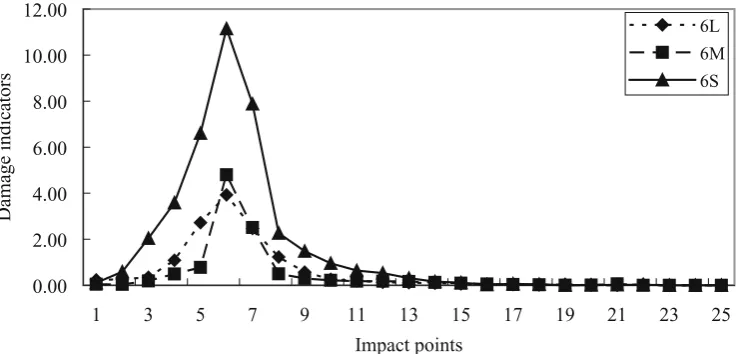
. However, it is not possible to use natural frequencies for locating damage because so far there is no method to achieve an effective local damage indicator from natural frequencies. Statistical damage indicators calculated from modal fl exibility curva-tures were proposed to detect damage in this study. Differ-ent damage severities [light (L), middle (M), and serious (S)] were simulated by removing mass near impact point 6 to study the effects of damage severity on the sensitivity of the proposed damage indicator. Damage indicators com-puted from the modal fl exibilities versus impact points under different damage severities are shown in Fig. 2. It can be observed that the damage can be located by the posed damage indicators. It can be concluded that the pro-posed algorithm is sensitive to different damage severities. The damage indicator increases when the damage severity increases. The peak values of the damage indicators increase from 3.93, 4.80, to 11.15 when the losses of the second axial moment of area increase from 27.1%, 48.8%, to 65.7%. Although the above-mentioned information should not be interpreted as meaning that the damage severity can be evaluated quantitatively and exactly, it can be used to iden-tify the existence of damage and its location. Further studies should be conducted to improve the algorithm so that the damage severity and the remaining useful life can be esti-mated for structures.
0 1.5 3 4.5
1 3 5 7 9 11 13 15 17 19 21 23 25
Impact points
Damage indicators
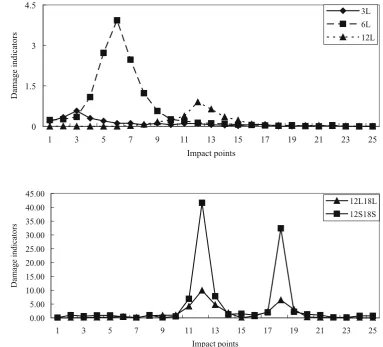
3L 6L 12L Fig. 3. Effects of damage
location on damage indicators
0.00 5.00 10.00 15.00 20.00 25.00 30.00 35.00 40.00 45.00
1 3 5 7 9 11 13 15 17 19 21 23 25
Impact points
Damage indicators
12L18L 12S18S Fig. 4. Effects of two defects on
damage indicators
points for different damage locations are shown in Fig. 3. The conclusion can be drawn from Fig. 3 that simulated damage at different locations along the beam was correctly detected and located by the proposed damage indicator. The peaks of the damage indicators coincided with the designed damage locations well and the existence of damage and its location can be readily distinguished by the damage indicator. The peak values of the damage indicators were 0.57, 3.93, and 0.90 for defects with the same losses of second axial moment of area (27.1%) located at 3/25, 6/25, and 12/25 of the beam span, respectively. The damage indicators varied when defects with the same severity were located at different positions. The reason for this phenomenon is thought to be that the mode shapes are a cumulative function of the displacement. The displacement is different when the damage location changes. The maximum deforma-tion of the fi rst mode shape occurs at the midspan point. The deformation tends to be zero near the two supporting ends. The maximum deformation of the second mode shape occurs at one-quarter and three-quarters of the span and its deformation is zero at 50% and the two supporting ends in a sinusoidal pattern. The damage indicator extracted from the mode shape is meaningful only when the deformation, defl ection, or both are not zero. So at least the fi rst two mode shapes are suggested to be used together for damage detection to avoid the effect of the mode shape. Further
studies will explore whether the strain mode shape may overcome the shortfalls of the displacement mode shape.
Structures may have multiple defects in a working envi-ronment. Double defects were simulated to verify the effec-tiveness of the proposed damage indicator. Damage indicators computed from the fi rst two mode shapes versus impacting points for double defects are shown in Fig. 4. It can be observed that only the damage indicators of several impact points close to the defects are relevant to the distur-bance. It is readily understood that there is no interaction between multiple defects at certain distances because the mode shape-based damage indicator is a local indicator not a global indicator. The damage indicators were 9.94 and 6.46 when the losses of the second axial moment of area were 27.1% and 27.1%; meanwhile, the damage indicators were 41.62 and 32.41 when the losses of the second axial moment of area were 65.7% and 65.7% for double defects located at 12/25 and 18/25 of the beam span. The peak values of the damage indicators under the double-defect scenario were greater than those under the single-defect scenario. The reason is that the modal fl exibilities have an inverse propor-tion to the powers of the natural frequencies. It is obvious that the natural frequencies under double-defect scenarios decrease more.
for the damage-free beam. We think there may be two ways to solve this limitation. One is to develop a precise fi nite element model to simulate the damage-free beam. Another way may be to record the healthy condition of an object at different times when this proposed method is being used for monitoring the health of a structure.
Conclusions
A novel damage indicator was proposed for damage detec-tion of wood beams by means of the modal fl exibility cur-vatures using the combined information of the frequencies and mode shapes. To verify the algorithm, different damage severities and damage locations were simulated, as were double defects, by removing mass from intact beams. The major fi ndings were as follows:
1. The proposed algorithm could qualitatively identify the presence of damage and its location, although there was no linear correlation between damage indicators and damage severity. The peak values of the damage indica-tors increased when the losses of the second axial moment of area increased.
2. The results showed that the proposed damage indicator was effective and robust under double-defect scenarios.
Acknowledgment The authors would like to express their thanks to
the Department of Finance of Guangdong Province (Project No. 2008A020100013) and the State Key Laboratory of Subtropical Build-ing Science, South China University of Technology.
References
1. Yang XY, Ishimaru Y, Iida I, Urakami H (2002) Application of modal analysis by transfer function to nondestructive testing of wood I: determination of localized defects in wood by the shape of the fl exural vibration wave. J Wood Sci 48:283–288
2. Yang XY, Amano T, Ishimaru Y, Iida I (2003) Application of modal analysis by transfer function to nondestructive testing of wood II: modulus of elasticity evaluation of sections of differing quality in a wooden beam by the curvature of the fl exural vibration wave. J Wood Sci 49:145–151
3. Yang XY, Ishimaru Y, Iida I (2002) Application of modal analysis by the transfer function to nondestructive testing of wood III: detection of knots and estimation of elastic modulus distribution in wood by the curvature ratio of the fl exural vibration wave shape. Mokuzai Gakkaishi 48:16–22
4. Hu CS, Afzal MT (2006) A statistical algorithm for comparing mode shapes of vibration testing before and after damage in timbers. J Wood Sci 52:348–352
5. Hu CS, Afzal MT (2006) A wavelet analysis-based approach for damage localization in wood beams. J Wood Sci 52:456–460 6. Pandey AK, Biswas M, Samman M (1991) Damage detection from
changes in curvature mode shapes. J Sound Vib 145:321–322 7. Kim JT, Ryu YS, Cho HM (2003) Damage identifi cation in