ORIGINAL ARTICLE
Fook Choon Choi · Jianchun Li · Bijan Samali Keith Crews
Application of modal-based damage-detection method to locate and evaluate
damage in timber beams
Abstract Modal-based damage-detection algorithms were used to identify the location of defects commonly found in timber and to estimate their severities. In this study, the authors propose modifi cations to an existing damage-detection algorithm for locating and evaluating damage by comparing the modal strain energy before and after damage using the fi rst two fl exural modes of vibration. Experimen-tal verifi cation was performed on pin–pin supported timber beams by employing the algorithms with extracted modal parameters using experimental modal analysis. Single and multiple cases of damage used to simulate pocket(s) of rot with various severities were infl icted by removing sections of timber beam specimens. The proposed damage indicator, computed from the fi rst two fl exural modes, was capable of detecting all damage locations. It was also able to estimate, with reasonable accuracy, the severity of damage in term of loss of sectional moment of inertia. The modifi ed damage index method is generally reliable in detecting the location and estimating the severity of simulated defects in timber beams.
Key words Damage localization · Severity estimation · Timber · Experimental modal analysis · Modifi ed damage index
Introduction
Wood is a versatile building material, because it is abun-dant, easy to obtain, and renewable. It has gained increased interest from engineers over the past decade as a viable material to replace concrete and steel construction.1
Basi-F.C. Choi · J. Li · B. Samali (*) · K. Crews
Center for Built Infrastructure Research, Faculty of Engineering, University of Technology Sydney, PO Box 123 Broadway, NSW 2007, Australia
Tel. +61-2-9514-2023; Fax +61-2-9514-2868
e-mail: [email protected]
cally, wood is a material that is “produced” biologically in the growing tree, making it a nonhomogeneous material that contains growth defects in the form of knots, zones with compression wood, and oblique fi ber orientation.2
This ma-terial is also subjected to damage such as termite attacks and pockets of rot as well as mechanical degradation such as overload and fatigue that inevitably weakens its struc-tural capacity and shortens its service life span. Therefore, developing reliable and effi cient nondestructive testing (NDT) techniques for evaluation of wood in structures has become a signifi cant task for engineers.
Various local nondestructive testing (NDT) techniques for wood products have been actively developed to provide accurate information on the properties, performance, and condition of wood.3 However, these techniques are devel-oped mostly to detect faults within a damaged area known a priori, which reduces effi ciency and reliability. Thus, global NDT techniques are essential to make the condition assessment of wood more reliable, and time and cost effec-tive. Modal-based damage-detection methods are global NDT techniques that have recently found application in timber structures. However, little research has been report-ed on timber structures using modal-basreport-ed methods to de-tect or to evaluate damage.4–10
Most of the work to date has been successful in detecting single damage locations and some for two damage locations computed using either the fi rst or second fl exural modes.
On the other hand, progress in modal-based damage-detection methods in the laboratory and in the fi eld in recent years has created opportunities for global NDT of timber structures.4–6 Among various methods, a method de-veloped by Kim and Stubbs11
based on changes in modal strain energy as a damage indicator for a structure has been particularly promising. In the literature, this method is often referred to as the damage index method. The method was intended for a wide range of applications to structural sys-tems. Recently, published studies have demonstrated the use of the damage index method to localize and estimate the severity of damage within a structure using a limited number of modal parameters for steel plate girder and other highway bridges.
This article reports on experimental investigations on timber beams using experimental modal analysis (EMA) to extract the required modal parameters, which are then used to compute the damage index, and hence to detect the dam-age. A modifi ed damage-detection algorithm was used to locate and evaluate various damage scenarios in the experi-mental work. A laboratory investigation was conducted on timber beams with damage infl icted under various damage scenarios using modal tests. The modal parameters obtained from the undamaged and damaged state of the test beam were used in the computation of modal strain energy. A statistical approach was also utilized to detect the location of damage. A mode shape reconstruction technique, name-ly cubic spline interpolation, was used to enhance the capa-bility of the damage-detection algorithm with a limited number of sensors.
Materials and methods
Materials
Two timber beams of grade MGP12 were used in the ex-perimental work as undamaged beams with their moisture content estimated to be about 7%–8%. The beams were treated radiata pine sawn timber with nominal dimensions of 45 × 90 mm (width × height) in cross section with a span length of 4500 mm. A specially designed support system was
used to provide a well-defi ned boundary condition that is very close to a pin–pin support.
Infl icted damage
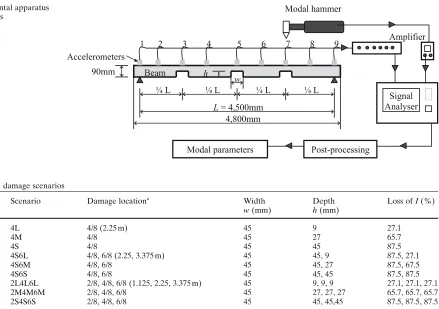
The goal of this study was to detect artifi cial defects in tim-bers. Both the location of the damage (single and multiple damage) and its severity in timber beams were sought. The cases with various types of damage infl icted in the timber beams are described in Table 1. All damage scenarios con-sisted of a rectangular opening from the soffi t of the beam, located at 1/4, midspan (1/2), and 3/4 of the span length to simulate pockets of rot, which usually starts from the top surface. In this article and the discussions that follow, L, M, and S are used to denote “light,” “medium,” and “severe” damage, respectively. All infl icted damage (w) occupied 1% of the total span length (45 mm) and consisted of 10%, 30%, or 50% of the beam depth (h), designated as damage cases L, M, and S, respectively, as shown in Table 1 and Fig. 1. The 10%, 30%, and 50% of the beam depth cut in cross section corresponded to losses of sectional “I” (moment of inertia) of 27.1%, 65.7%, and 87.5%, respectively.
Frequency response function
The basic concepts of signal analysis starts with the Fourier transform of a continuous signal, which according to J.B.
Table 1. Infl icted damage scenarios
Damage Scenario Damage locationa Width Depth Loss of I (%)
case w (mm) h (mm)
1 4L 4/8 (2.25 m) 45 9 27.1
2 4M 4/8 45 27 65.7
3 4S 4/8 45 45 87.5
4 4S6L 4/8, 6/8 (2.25, 3.375 m) 45 45, 9 87.5, 27.1
5 4S6M 4/8, 6/8 45 45, 27 87.5, 67.5
6 4S6S 4/8, 6/8 45 45, 45 87.5, 87.5
7 2L4L6L 2/8, 4/8, 6/8 (1.125, 2.25, 3.375 m) 45 9, 9, 9 27.1, 27.1, 27.1
8 2M4M6M 2/8, 4/8, 6/8 45 27, 27, 27 65.7, 65.7, 65.7
9 2S4S6S 2/8, 4/8, 6/8 45 45, 45,45 87.5, 87.5, 87.5
Beam 1 was used for cases 1–6; beam 2 was used for cases 7–9
I, Sectional moment of inertia; L, light damage; M, medium damage; S, severe damage
a Given as fraction of span length. Distance from end of beam given in parentheses
4,800mm
L = 4,500mm
9
1 2 3 4 5 6 7 8
Post-processing Modal parameters
¼ L
w h
90mm
Modal hammer
Amplifier
Signal Analyser Beam
Accelerometers
¼ L ¼ L
¼ L Fig. 1. Experimental apparatus
Fourier (1822): “any real time signal x(t) is a superposition of sine waves with their frequency f, their amplitude A and phase angle f”. The fast Fourier transform (FFT) has made it possible to convert time series data to frequency data without losing any information theoretically. In the fre-quency domain, the input function f(w) with respect to
fre-quency w is obtained from the force applied to the beam with a modal hammer, and the output function g(w) is
ob-tained from the response of the structure measured by the accelerometers attached to the system. By dividing the fre-quency function of the input by that of the output as shown in Eq. 1, the frequency response function, FRF or H(w) is
obtained for each point on the system.
H g
f
( ) ( )
( )
ω ω
ω
= (1)
Experimental modal analysis
The experimental modal analysis (EMA) procedure and instrumentation layout used for the investigation are shown in Fig. 1. The EMA provides natural frequencies, dampings (not discussed in this article), and corresponding mode shapes. The modal testing, as part of the EMA used in this study, employs an impact hammer to excite the test sample at a strategic location and then the acceleration response is measured. Nine accelerometers were used to measure the acceleration time history of the beam, which was deemed a suffi cient number of points along the span so that the mode shapes could be accurately reconstructed using interpola-tion techniques. One of the accelerometers was used as the driving point measurement, so that the experimental mode shapes could be mass normalized. Each accelerometer was attached using a magnetic base onto a small steel plate that was bolted onto the top of the beams in order to obtain monolithic movement between accelerometer, steel plate, and test beam. The accelerometers were located at 1/8 in-tervals of the span length starting from one end support of the beam to the other end as shown in Fig. 1. The impact location, at 3/4 of the span length, was selected because it falls on the near-to-peak and peak amplitudes for modes 1 and 2, respectively. Thus, these modes can be excited simultaneously.
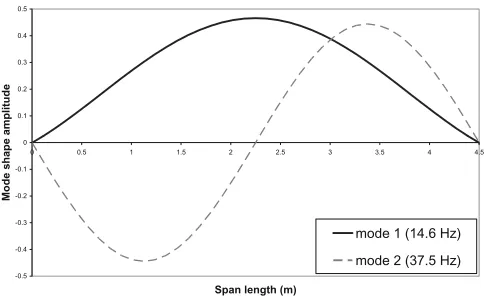
A general signal acquisition monitor (HP VXI) was used to record the dynamic response at 10 000 Hz sampling rate for 8192 data points. A frequency domain direct mea-surement curve-fi tting technique of a postprocessing pro-gram (LMS) was used to obtain the modal frequencies and mode shapes from the measured FRFs. Using the EMA, fi ve vibration modes, with a frequency bandwidth ranging from 10 to 200 Hz, were captured. However in this article, only the fi rst two fl exural modes (see Fig. 2) were needed. From the nine-point experimental mode shape, a new mode shape vector with 41 points could be re-constructed using cubic spline interpolation. The recon-structed mode shape increases reliability and accuracy of damage detection when it is used in damage-detection algorithms.
Damage-detection algorithms
In this investigation, the damage index method developed by Kim and Stubbs11
was adopted and modifi ed [named as modifi ed damage index (MDI)] to detect the infl icted dam-age. The MDI pertaining to damage localization is based on the relative differences in modal strain energy between an undamaged structure and that of a damaged structure. The modal strain energy utilizes derivatives of mode shape, that is, mode shape curvature, and the algorithm used to calcu-late the damage index for the jth element and the ith mode,
bij, is given below.
β
φ φ
φ φ
ij i j
i L
i j
i
x dx x dx
x dx x
= ′′
{
}
{ ′′ }′′
{ }
{
′′}
∫
∫
∫
*
*
( ) ( )
( ) ( )
2 2
0
2 22
0
dx L
∫
(2)
In Eq. 2, the terms fi″(x) or fi″*(x) are normalized mode shape curvature coordinates. The curvature is normalized with respect to the maximum value of the corresponding mode for each mode of a beam structure. This is the major contribution of this article whereby the normalized curva-ture used in the MDI method is shown to perform better in damage localization than the original formulae (curvature was not normalized).12
The asterisk denotes the damage cases. For the original damage index method, although mode shape vectors have been mass normalized, the mode shape curvatures used for the damage index calculation are not normalized. Values of mode shape curvature are depen-dant on the shapes of each individual mode shape. Instead of refl ecting the changes in the curvature due to damage, the summation of nonnormalized mode shape curvatures will distort the damage index in favor of higher modes, which results in false damage identifi cations. The modifi ed damage index method introduced above overcomes the problem by normalizing mode shape curvatures with re-spect to the maximum norm of each mode shape curvature. To account for all available modes, NM, the damage indica-tor value for a single element j is given as:
-0.5 -0.4 -0.3 -0.2 -0.1 0 0.1 0.2 0.3 0.4 0.5
0 0.5 1 1.5 2 2.5 3 3.
Span length (m)
Mode shape amplitude
mode 1 (14.6 Hz) mode 2 (37.5 Hz)
βj i ij ij i
= =
=
∑
∑
Num
Denom
NM
NM 1
1
(3)
where Numij is the numerator of bij and Denomij is the de-nominator of bij in Eq. 2. Transforming the damage indica-tor values into the standard normal space, the normalized damage index Zj is obtained:
Zj
j j
j
=β µ−
σ β
β (4)
where mbj and sbj are the mean and standard deviation of bj values for all j elements, respectively. A judgment based threshold value is selected and used to determine which of the j elements are possibly damaged, which in real applica-tions is left to the user to defi ne based on the level of confi dence required for localization of damage within the structure.
The severity of damage in the jth member is estimated using the expression as follows:
α
β j
j
= −
×
1 1 100(%) (5)
where aj is the severity estimator.
The effectiveness of the modifi ed damage index (MDI) method, introduced above, is closely related to the number of elements of the structure or components. The number of elements to be used by damage detection is dictated by the number of sensors used for the measurement. In order to produce reliable and accurate results, a relatively large number of sensors are required to produce the fi ne coordi-nates of the mode shapes. In the numerical simulation, the coordinates can be controlled by mesh density. However, in fi eld applications or experimental testing, the evaluation of the coordinates of the mode shape vectors is limited by the number of sensors used in the test, which is often far less than what the damage detection requires. To overcome this limitation, a few techniques for reconstructing mode shapes to increase the number of coordinates are pro-posed.13
In this article, cubic spline interpolation was used for reconstruction of the mode shapes from experimental testing. The measured mode shape coordinates can be interpolated to generate mode shape vectors of greater length.
Results and discussion
In the following results, all damage localization indices for each of the damage cases are plotted against the beam span length. In principle, any location with the index value Zj larger than zero (the probability-based criterion for damage detection) is considered as damage existing at that location. For the estimation of damage severity, the graphs are presented in terms of percentage of loss in “I” (sectional
moment of inertia). In this case, a weighting coeffi cient was applied to adjust the severity of damage based on the assumption that the experimental data was polluted with 20%–30% noise (included in the predicted error). The ac-tual damage locations are indicated with dashed lines in all fi gures.
Localization of damage
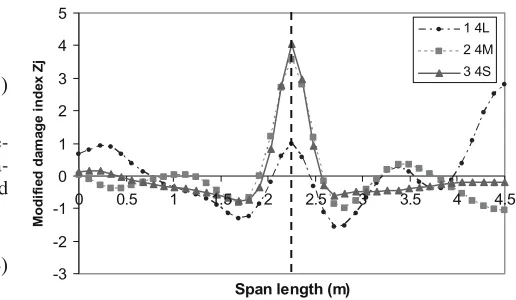
The results of applying the MDI method to compute single damage cases using the fi rst two fl exural modes are illus-trated in Fig. 3. For single damage cases 1 to 3, the MDI is able to accurately indicate the location of damage at 2.25 m with few false positives (false indication of damage loca-tions) at 3.375 m and near the supports. It is quite clear that as the severity of damage ascends the damage index in-creases accordingly, having values of 1.00, 3.55, and 4.05 for light, medium, and severe damage, respectively. The noted trend is consistent with the results presented by Hu and Afzal.9
The damage index is able to qualitatively estimate the location of damage judging from the probability of ex-istence of damage. However, the damage-localization algo-rithm was not capable of estimating the extent of damage.
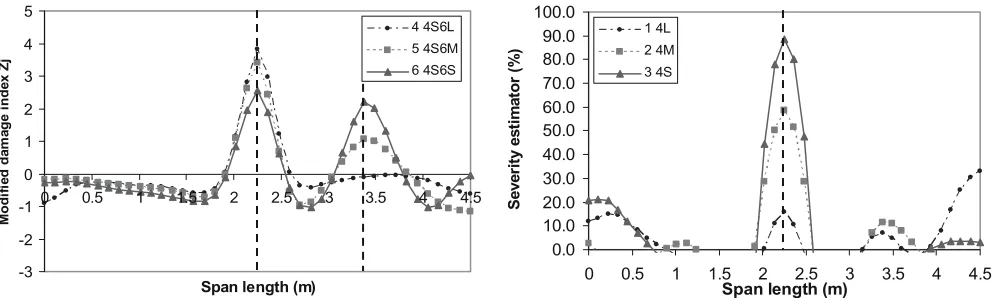
Figure 4 depicts the damage scenarios of two damage locations positioned at 2.25 m and 3.375 m detected with MDI. The severe damage for damage cases 4, 5, and 6 was precisely identifi ed by the damage indicator. This also applies to the damage at position 3.375 m except for light damage of damage case 4. It is clear that the method is capable of detecting damage in dual damage scenarios, but may miss light damage that appears together with severe damage. This is due to the light damage slightly altering the mode shape and its derivatives, which may have been over-shadowed by other more severe scenarios.
For three damage location scenarios in damage cases 7, 8, and 9, the damage localization results are illustrated in Fig. 5. Again, the MDI method located all damage with a false positive at one of the supports. This has again proven that the method is viable in accurately detecting localized damage for up to three damage locations. However, the damage indicator did not refl ect the severity of damage. It
-3 -2 -1 0 1 2 3 4 5
0 0.5 1 1.5 2 2.5 3 3.5 4 4.5
Span length (m)
Mo
d
if
ie
d
d
a
m
a
ge
i
nde
x
Zj
1 4L 2 4M 3 4S
is, therefore, reasonable to conclude that the damage indi-cator utilizing the statistical approach works well in locating damage but not in evaluating the severity of damage. In light of this, it is important as part of this study to propose a method to evaluate the severity of damage in wood.
Estimation of severity of damage
Damage cases discussed above were used in the estimation of severity of damage using Eq. 5. The predicted damage is expressed by loss of “I” and it can be directly compared with the simulated damage. The severity of damage below 0% is meaningless; thus, such results are not shown. The results for single damage scenarios at 2.25 m are shown in Fig. 6 and the extent of damage is tabulated in Table 2. The damage evaluation algorithm captures the location of dam-age at position 2.25 m very accurately, although there are some false positives. It estimated the severity of damage for severe damage with only 1% error. The prediction of me-dium-level damage was reasonably good with 11% error. Nevertheless, the error for light damage increased to 40%. The method has shown great potential in estimating sever-ity of damage. It performs well in predicting the extent of
damage from medium to severe for single damage but has reduced accuracy for light damage cases, in addition to its ability to pinpoint the exact location of damage. Any short-comings of this method can be compensated by other NDT techniques that work well if the damage location is gener-ally known. It is also worth pointing out that in practice, detection of medium or severe damage when it occurs is all that matters in order to avoid catastrophic failure.
The dual-damage cases 4, 5, and 6 are presented in Fig. 7. The method identifi ed damage at 2.25 m and 3.375 m. Even the light damage at position 3.375 m, which could not be identifi ed using the damage-localization algorithm earlier, was located. From Table 2, the predicted severe damage at 2.25 m as well as at 3.375 m is fairly accurate with errors of less than 5%; hence, there is high confi dence in using the method to evaluate severe damage. For the case of medium damage, the method produced a 15% error in prediction, which still is considered quite acceptable in es-timating severity of damage for wood considering the inher-ent natural variability in wood. However, for light damage, the prediction was relatively poor, although it still showed the location of the damage.
With the success in detecting cases of single and dual damage, it was of interest in this study to explore further
-3 -2 -1 0 1 2 3 4 5
0 0.5 1 1.5 2 2.5 3 3.5 4 4.5
Span length (m)
Mo
d
if
ie
d
d
a
m
a
ge
i
nde
x
Zj
4 4S6L 5 4S6M 6 4S6S
Fig. 4. Damage localization for dual damage cases 4 to 6
-3 -2 -1 0 1 2 3 4 5
0 0.5 1 1.5 2 2.5 3 3.5 4 4.5
Span length (m)
Modi
fi
e
d
da
m
a
ge
i
nde
x
Zj
7 2L4L6L 8 2M4M6M 9 2S4S6S
Fig. 5. Damage localization for tri-damage cases 7 to 9
0.0 10.0 20.0 30.0 40.0 50.0 60.0 70.0 80.0 90.0 100.0
0 0.5 1 1.5 2 2.5 3 3.5 4 4.5
Span length (m)
S
ever
it
y est
im
at
o
r (
%
)
1 4L 2 4M 3 4S
Fig. 6. Severity of damage for single damage cases 1 to 3
0.0 10.0 20.0 30.0 40.0 50.0 60.0 70.0 80.0 90.0 100.0
0 0.5 1 1.5 2 2.5 3 3.5 4 4.5
Span length (m)
Se
v
e
ri
ty
es
ti
m
ato
r (%
)
4 4S6L 5 4S6M 6 4S6S
the capabilities and limitations of the severity estimation using the proposed algorithm on tri-damage scenarios. These damage cases (7–9) are illustrated in Fig. 8. It is obvi-ous that all damage was detected using the proposed meth-od with a false positive at one of the supports. The error ranges(including the noise level) for light, medium, and se-vere cases were 30%–90%, 15%–40%, and 20%–35%, re-spectively. The method could predict the severity of damage reasonably well when three damage locations existed in the structure. It is worth noting that as the number of damage locations increases, the predicted severity becomes smaller than simulated in magnitude. This may be due to the mode shape curvature becoming fl at as more damage appears in the test sample. With the insight gained from this study, it is possible to overcome this shortcoming in the future by introducing a sensitivity function of counts and geometric location of damage into the severity estimation algorithm. This initial effort to estimate severity of damage in wood is believed to have advanced the knowledge of NDT for tim-ber structures signifi cantly.
Conclusions
A modifi ed damage index method was proposed for de-tecting damage in timber beams using modal parameters obtained from experimental modal analysis. The new
method enhances the existing algorithm in detecting dam-age location, especially for multiple damdam-age scenarios. It also provides an evaluation of damage severity on timber structures to fi ll a clear gap in knowledge in this area. The results showed that the proposed algorithm is effective and reliable in locating damage even though it comes with some false positives. The algorithm is also capable of pre-dicting the extent and severity of damage in terms of loss of moment of inertia for single and multiple damage scenarios.
Acknowledgments The authors thank the Centre for Built Infras-tructure Research (CBIR), Faculty of Engineering, The University of Technology Sydney, for supporting this work. Within the Faculty of Engineering, the authors also thank the staff of the UTS Structures Laboratory for their assistance in conducting the experi-mental work.
References
1. Moody R (1994) Timber bridges – a rebirth. Woodland Manage-ment 15(4):18–20
2. Thelandersson S, Larsen HJ (2003) Timber engineering. Wiley, pp 15–22
3. Ross RJ, Pellerin RF (1994) Nondestructive testing for assessing wood members in structures – a review. General Technical Report FPL-GTR-70 (Rev.), Forest Products Laboratory, Department of Agriculture Forest Service, Madison, WI, pp 1–40
4. Peterson ST, McLean DI, Symans MD, Pollock DG, Cofer WF, Emerson RN, Fridley KJ (2001) Application of dynamic system identifi cation to timber beam: I. J Struct Eng 127:418– 425
5. Peterson ST, McLean DI, Symans MD, Pollock DG, Cofer WF, Emerson RN, Fridley KJ (2001) Application of dynamic system identifi cation to timber beam: II. J Struct Eng 127:426–432 6. Peterson ST, McLean DI, Pollock DG (2003) Application of
dynamic system identifi cation to timber bridges. J Struct Eng 129:116–124
7. Yang XY, Ishimaru Y, Iida I, Urakami H (2002) Application of modal analysis by transfer function to non-destructive testing of wood I: determination of localized defects in wood by the shape of the fl exural vibration wave. J Wood Sci 48:283–288
8. Yang XY, Ishimaru Y, Iida I, Urakami H (2002) Application of modal analysis by transfer function to non-destructive testing of wood II: modulus of elasticity evaluation of sections of differing quality in a wooden beam by the curvature of the fl exural vibration wave. J Wood Sci 49:140–144
9. Hu C, Afzal MT (2006) A statistical algorithm for comparing mode shapes of vibration testing before and after damage in timbers. J Wood Sci 52:348–352
Table 2. Estimation of severity of damage for single and multiple damage scenarios
Damage Damage location(s)a Simulated Predicted Error (%)
case damage (%) damage (%)
4L 4/8 (2.25 m) 27.1 15.6 42.3
4M 4/8 65.7 58.7 10.7
4S 4/8 87.5 88.6 1.2
4S6L 4/8 87.5, 27.1 87.0, 3.1 0.5, 88.7
4S6M 4/8, 6/8 (2.25, 3.375 m) 87.5, 65.7 91.3, 55.9 4.3, 14.9
4S6S 4/8, 6/8 87.5, 87.5 88.8, 84.5 1.5, 3.4
2L4L6L 2/8, 4/8, 6/8 (1.125, 2.25, 3.375 m) 27.1, 27.1, 27.1 19.7, 8.1, 17.3 27.4, 70.0, 36.2
2M4M6M 2/8, 4/8, 6/8 65.7, 65.7, 65.7 56.0, 37.5, 46.9 14.8, 43.0, 28.6
2S4S6S 2/8, 4/8, 6/8 87.5, 87.5, 87.5 68.1, 72.2, 58.2 22.2, 17.5, 33.4
a Given as fraction of span length. Distance from end of beam given in parentheses
0.0 10.0 20.0 30.0 40.0 50.0 60.0 70.0 80.0 90.0 100.0
0 0.5 1 1.5 2 2.5 3 3.5 4 4.5
Span length (m)
Se
v
e
ri
ty e
sti
m
a
to
r (%
)
7 2L4L6L 8 2M4M6M 9 2S4S6S
10. Hu C, Afzal MT (2006) A wavelet analysis-based approach for damage localization in wood beams. J Wood Sci 52:456–460 11 Kim J-T, Stubbs N (1995) Model-uncertainty impact and
damage-detection accuracy in plate girder. J Struct Eng 121:1409–1417 12. Choi FC, Li J, Samali B, Crews K (2006) Damage detection in a
timber beam. Structural Faults and Repair, 13–15 June, Edinburgh, Scotland, CD-Rom
13. Choi FC, Li J, Samali B, Crews K (2006) Impact of different nu-merical techniques on damage identifi cation in structures. Tenth
East Asia-Pacifi c Conference on Structural Engineering and Con struction, 3–5 August, Bangkok, Thailand, pp 111–116