http://www.sciencepublishinggroup.com/j/ajmie doi: 10.11648/j.ajmie.20190405.12
ISSN: 2575-6079 (Print); ISSN: 2575-6060 (Online)
The Spatial and Temporal Distribution of Rock Breaking
Effect of Explosion Stress Wave of Slotted Cartridge
Yanbing Wang
1, 2, *, Bingbing Yu
1, Ji Kong
1, Maike Wang
11School of Mechanics and Architecture Engineering, China Universityof Mining and Technology (Beijing), Beijing, China 2
State Key Laboratory for Geomechanics and Deep Underground Engineering, Beijing, China
Email address:
*
Corresponding author
To cite this article:
Yanbing Wang, Bingbing Yu, Ji Kong, Maike Wang. The Spatial and Temporal Distribution of Rock Breaking Effect of Explosion Stress Wave of Slotted Cartridge. American Journal of Mechanical and Industrial Engineering. Vol. 4, No. 5, 2019, pp. 76-85.
doi: 10.11648/j.ajmie.20190405.12
Received: September 19, 2019; Accepted: September 29, 2019; Published: November 6, 2019
Abstract:
The propagation characteristics and rock breaking mechanism of explosive stress wave have aroused the interests of many researchers.This work proposed a method that separates the explosion stress wave from detonation gas and designed the testing unit accordingly. It combined the resistance ultra-dynamic strain test to conduct the strain measurement on local key points and obtained the strain waveforms of representative measuring points under the explosion stress wave. The characteristics of these strain waveforms were analyzed and the energy-based spectral analysis of these waveforms was done using Matlab. Findings show that both strain peak and stress rate peak are the biggest along the slot direction, followed by that along the non-slot direction, 135° direction and 45° direction in a descending order; the similar low-frequency band was detected at the measuring point with the same distance to the explosion source, while the high-frequency band was unevenly distributed. In the rock breaking experiment under the stress wave of slotted cartridge, with regards to the measuring points at the same distance to borehole, the similar low-frequency bands appeared and concentrated in 292.8-448Hz. The included angle between each measuring point and the slot was different, which impacted the propagation of stress wave to some extent and resulted in uneven distribution of the high-frequency bands.Keywords:
Slotted Cartridge, Explosion, Stress Wave, Spectral Analysis1. Introduction
The propagation characteristics and rock breaking mechanism of explosive stress wave have aroused the interests of many researchers [1-5]. From the mid-20th century, many scholars have carried out the theoretical and experimental researches on the propagation of stress wave in solid media under the explosion loading [6-10]. With respect to foreign studies, YI-SHYONG ING and CHIEN-CHING MA [2] studied the related solution to crack propagation under the stress wave using caustics method. D. Bonamy and K. Ravi-Chandar[3] examined the disturbance at the crack tip caused by shear wave. K. RAVI-CHANDAR and W. G. KNAUSS [4] examined the interaction between stress wave and moving crack along different directions using high-speed camera. Dally [5] examined the propagation
method of dynamic crack propagation process under the stress wave, and measured the material characteristics of dynamic crack propagation. However, it is difficult to separate out the explosion stress wave and study it alone due to the instantaneity, strong destructiveness and non-repeatability of explosion loading and the mixing of stress wave and detonation gas after the explosion, which led to no substantial progress on the concerned studies. In addition, the majority of the obtained strain waveforms only contains a transient compression phase or accompanies with a rapid attenuation of stretching phase, subject to the limitation of frequency response of testing device and experimental approach, but these cannot fully reflect the whole process of instantaneous deformation of the detonated medium. Over these years, with the rapid development of high-frequency dynamic response testing apparatus[11, 12], the testing levels of high-strain explosion stress wave have been improved to some extent.
This work firstly designed the separating unit of explosion stress wave and detonation gas, analyzed the cement mortar specimen exploded and blasted by slotted cartridge and the characteristics of strain waveform at representative measuring points in cement mortar under the stress wave alone based on resistive ultra-dynamic strain test, used Matlab to make a spectral analysis of the obtained waveforms accordingly, and examined the spectral characteristics of strain waveforms in each zone and the energy distribution.
2. Design of Separating Device for
Explosion Stress Wave and Detonation
Gas
Figure 1. New separating unit.
In consideration of the respective propagation characteristics of stress wave and detonation gas, the wave theory[13] argues that stress wave must propagate in the medium but does not propagate in vacuum, while detonation gas propagates in space, and smaller resistance will facilitate the propagation. Based on the above considerations, the new “separating unit of stress wave and detonation gas” as shown in Figure 1 was proposed, the signal curve of the measuring points under explosion stress wave and detonation gas can be obtained by drilling boreholes through the cubic specimen, embedding sensors at different locations in the specimen and
connecting these sensors to the data acquisition apparatus and detonating the explosives after blocking the boreholes; it was considered that detonation gas will run out of the boreholes when the explosives were detonated in open boreholes, so that the signal curve about the single effect of stress wave to the medium at such location was obtained.
3. Experiment
3.1. Experimental Model and Arrangement of Measuring Points
This experiment used the cement mortar model in 200 mm×200 mm×200mm (L×W×H), 42.5# common portland cement and the screened medium sand, then added water to stir and cast to form cement: sand: water (1:2:0.5), the 6mm (diameter) boreholes were reserved on the specimen while casting, the depth of boreholes was 200mm as they drilled through the specimen, and cured for 28 days.
3.2. Testing Apparatus, Equipment and Arrangement of Measuring Points
Figure 2. Arrangement of measuring points, section view.
In blasting test, strain gauge was at the high-frequency state of stress. In order to avoid the strain grid breakage, slipping of adhesive layer and unsoldering of cap caused by fatigue, the welding head of strain gauge must undergo the special treatment, with better resistance to impact and longer fatigue life. The foil strain gauge used here was a very thin metal foil grid through etching, lithography and other special processes, with a thickness of only 0.003-0.01mm, and attached onto the substrate which was covered with a thin film.
The locations of measuring points were firstly determined on the cement mortar specimen, as shown in Figure 2, two measuring points were arranged along the horizontal direction, 45° counterclockwise direction, vertical direction and 135° clockwise direction respectively, with a spacing of 12.5mm. The strain gauge was attached to the 10mm×10mm×10mm cubic strain brick with the same composition ratio of the
A
V
2
A
V
1
AF1
AF2
AX1 AX2
cement mortar specimen, during the casting of cement mortar, the strain brick was embedded in the predetermined location. This experiment used BX120-3AA foil strain gauge with the
grid dimension of 1mm×1.5mm, the main performance indexes are given in Table 1.
Table 1. Performance indexes of BX120-3AA strain gauge.
Resistance Ω
Sensitivity coefficient
Mechanical hysteresis Με
Creep µε
Change of sensitivity coefficient with temperature
Transverse sensitivity ratio
Insulation resistance MΩ
120.3±0.1% 2.08±1% 2 3 2%, 100°C 0.5% 50000
The ultra dynamic strain gauge from Shanghai Rongjida Experiment Instrument Co., Ltd was selected and its specific technical parameters are given in Table 2.
Table 2. Strain gauge technical indexes of SDY2107A ultra-dynamic resistance.
Channel
number Bridge resistance Bridge voltage Strain coefficient Incremental range Gain
8 60Ω~5kΩ 2V, 4V, 8V 2.00 ±100µε 10, 30, 100, 300, 1,000
Input impedance Sensitivity Output voltage Strain calibration value SNR Power supply
>100ΜΩ 0.2V/100µε (Bridge voltage 4V) ±5V 10-9990µε >40dB AC 220V
TST3406C high speed and precision ultra-dynamic test analyzer from Chengdu Test Electronic Information Co., Ltd was selected and its specific technical parameters are given in Table 3.
Table 3. Main performance indexes of TST3406C DAQ Card.
Sampling rate Storage depth AD Input impedance Range Bandwidth (-3dB)
40M sps 4M sampling points/CH 12bit >1MΩ ±20V -±100mV 0-8MHz
3.3. Construction of Testing System and Equipment Commissioning
After the specimen was fixed on the loading frame, the amplifier was turned on for preheating, the dynamic tester, amplifier, bridge box were sequentially connected as a testing circuit in accordance with the design requirement, and then the strain gauge of measuring points was connected to the bridge box. The appropriate sampling rate, sampling length, sampling delay, range and trigger level were selected as per the requirement of sampling time, strain wave frequency and low-pass filter.
Figure 3. Ultra-dynamic strain testing system.
The voltage signal of bridge output during the ultra-dynamic strain testing process is very small, which willl inevitably be subject to some internal or external non-controllable factors in conversion, transmission,
amplification and recording, so that some unnecessary interference signals and the measured strain signals may be superimposed to give rise to unnecessary error and cause some impact on the tested results. The frequency, amplitude, duration and other parameters of real signals may be distorted as subject to the adverse external signal interference. The source of interference which may arise from this testing process was estimated and the appropriate anti-interference measures were taken accordingly.
Figure 4. Slotted catridge and its blasting cement mortar specimen.
4. Ultra-dynamic Strain Test of Slotted
Cartridge Blasting Stress Wave
Breaking Rock
principle of superposition tells us that the effect of stress wave in the space on medium is the synthesized interaction of all waves at this position, the dynamic response of any measuring point in the specimen at any time equals to the concentrated vectors of different stress waves generated at the measuring point, and any dynamic response of this medium is a result of stress wave and all secondary waves. The slotted cartridge was placed in the specimen as shown in Figure 2 and borehole was opened for blasting. The slotted cartridge and cement mortar specimen after blasting are shown in Figure 4.
4.1. Ultra-dynamic Strain Setting
The sampling rate at the experiment was set to 1MHz, and
100kHz and 10kHz low-pass filter was utilized. Findings show that waveforms had no high frequency through the 100kHz low-pass filter, but the signal was strongly interfered causing the portion of small deformations easily hidden, with respect to such phenomenon, 10kHz filter was mainly collected in the experiment. To ensure the correct signal triggering, all strains were deducted before starting the data collection. In the experiment, the explosives in borehole were detonated after the ultra-dynamic strain testing system was set ready. The experiment was repeated for 3 times, in consideration of the instability and randomness of explosive signal, the portion of representative waveforms with good repeatability was selected for an analysis.
4.2. Analysis of Tested Results
(a) Along the slot direction
(c) Along the 45° counterclockwise slot direction
(d) Along the 135° clockwise slot direction
Figure 5. Strain waveforms of different locations around the boreholes.
4 representative measuring points in equal radial distance around the borehole were selected: AH1, AV1, AX1, AF1, denoting the strain waveforms in equal distance to the borehole along the slot direction around the borehole, along the vertical slot direction, along 45° slot counterclockwise direction and along 135° slot clockwise direction respectively, as shown in Figure 5. Refer to Figure 2 for the specific position of measuring points. Positive, negative value denotes the tensile strain and compressive strain in all the following figures. Strain rate curve is obtained by directly solving the first-order derivative to the strain curve.
The strain wave at the measuring point AH1 lasted for about 50µs and tended to be stable after a buffer period of about
110µs. A sudden drop of strain waveform appeared at 326µs, which was caused by the crack generated along the slot direction passed through the strain gauge and pulled it off. The strain waveform at the measuring point AV1 lasted for about 75µs and tended to be stable after a buffer period of about 100µs, approximately 80×10-6. According to the conversion relationship between material signal and stress:
ε
σ
=
E
d×
(1)stress. In near explosion region, the cement mortar specimen was subject to the strong impact, which results in plastic deformation. The strain rate curve had another slight change after 280µs, which might be attributed to the acceleration of deformation since the plastic deformation was subject to the interference of reflected stress wave in the recovery phase. The strain wave at the measuring point AX1 and AF1 had a longer duration of about 100µs, and the residual strain was 1.2 MPa and 0.98 MPa respectively.
The stress wave generated by the explosion may cause a strong disturbance in the medium, stress state, density, vibration velocity of mass point and other parameters in the medium may change dramatically within the limited range of
explosion stress wave, the vibration velocity of mass point and the relationship between the vibration velocity of mass point u and the strain rate
ε
&
at the measuring point characterized by the strain gauge-based average vibration velocity is [14]:u=
ε
&
L
L
dt
d
ε
=
(2)The maximum vibration velocity can be approximately solved using Equation (2), and Bauer-Caldera [15] safety criterion can be used to judge if this point has been damaged or not.
Table 4. Bauer-Caldera safety criterion [15].
Max. vibration velocity of the mass point (cm/s) Degree of rock damage
<25.0 Rock is complete with no damage
25.0~63.5 With a slight tensile layer crack
63.5~254.0 With a large number of tensile cracks and some radial cracks
>254.0 Rock is completely crushed
Table 5 illustrates the statistical data of strain peak, max. strain rate at each measuring point and the maximum vibration velocity of mass point at the measuring point and residual strain. With respect to strain peak, there was εmax-slot direction>εmax-vertical
direction>εmax-135° direction>εmax-45° direction at the same scaled distance,
the energy generated from the explosive formed a jet flow along the slot direction, which was firstly released. The trend of max. strain rate was the same with strain peak, i.e.:
ε
&
max-slot direction>ε
&
max-vertical direction>
ε
&
max-135° direction>ε
&
max-45° direction, the appearanceof crack along the slot direction offered an enough space for the
release of stress, resulting the rapid attenuation of strain. According to the vibration velocity of mass point at each measuring point, with reference to Bauer-Caldera criterion, the degree of damage at AH1 along the slot direction was more serious than the criterion, but no damage was found even though the vibration velocity of mass point at AV1 along the vertical direction was higher than 63.5cm/s, which might be attributed to a certain effect of “wall protection” since the slotted pipe hindered the application of explosion stress wave on the vertical borehole wall to some extent.
Table 5. Strain peak, max. strain rate and residual strain at each measuring point.
AH1 AV1 AX1 AF1 AH2 AV2 AX2 AF2
Scaled distance l/r 2.08 2.08 2.08 2.08 4.16 4.16 4.16 4.16
Strain peak εmax (µ) 178460 141850 50920 82227 106620 81990 16840 29550
ε
&
max strain rate (s-1) 45826 40566 16510 17776 33610 24980 9920 12470umax of mass point (cm/s) 68.739 64.849 24.765 26.664 50.415 37.47 14.88 18.705
Residual strain σ (MPa) — 4.8 1.2 0.98 5.9 4.6 0.22 0.27
*—No value obtained due to the fracture of strain gauge
5. Time-Frequency Analysis of Strain
Wave
Time-frequency analysis is a scientific and effective analytical method used for explosion, impact and some non-stationary signals, and provides a condition for the coupling and information transmission between time domain and frequency domain, the linear time-frequency function and bilinear time-frequency function are represented by the time-frequency joint function.
The ith layer wavelet packet of the test signal f(t) is decomposed, from the ith layer to j=2isub-bands, the highest frequency is denoted by ωh, and the width of each sub-band is denoted by ωh/2i. Signals within different frequency bands can be extracted according to the wavelet decomposition coefficient, so that resultant signal is reconstructed as follows:
) 1 , ( ) 1 , ( ) 0 , (
...
)
(
t
=
f
i+
f
i+
+
f
i j−f
(3)Where f(i,k) is the reconstruction of signal at the node (i,k) after the decomposition of the ith layer, k=0,1,2,……j-1.
Based on the energy-based secondary time-frequency representation method, the time-frequency spectrum at one time can be defined as[16]:
2 ) , (
(
)
)
,
(
t
f
t
W
ω
k=
ik (4)Where ωk is the frequency of the kth band, k=0,1,2,……j-1. The equivalent energy of signal for the kth band is:
∑
∫
∫
− ==
=
=
1 0 2 ) , ( 2 ) , ((
)
)
,
(
m k k j k i kk
W
t
dt
f
t
dt
x
E
ω
(5)sampling point of signal, and m denotes the number of signal discrete sampling points.
If the band decomposition is fine enough, the band can be approximately seen as a continuous distribution, and the time-frequency spectrum of signal continuous distribution with respect to the frequency domain and time domain. Energy density can be calculated and the law of its power spectrum density distribution of signal set characterization within the range of original signal frequency can be indicated using Equation (3) and (4); according to the percentage of the energy of each band to total energy, the main frequency of signal can be solved and some frequency bands can be also removed for filtering.
5.1. Energy-Based Spectral Analysis
When signal indicates the sampling rate as 100Hz,
according to Shannon sampling theorem, its Nyquist frequency was 50kHz. As the larger setting of sampling rate means lower resolution of the corresponding frequency, the band decomposition cannot be too fine. Since the minimum operating frequency of sampling analyzer used in the experiment was 10Hz, based on the principle of wavelet packet decomposition, signal was decomposed to the 10th layer to obtain 1024 sub-bands and the width of each sub-band was 48.4Hz. The low-pass filter of strain amplifier was set as 10kHz, because only the energy of band smaller than 12.5kHz was considered in calculating the energy, only 256 sub-bands were calculated. The signal was decomposed to the 10th layer, set the energy corresponding to the reconstructed signal as E10,j, the calculation was made using Equation (5):
Table 6. Distribution of frequency range of some measured points in test.
Sub-band /Hz AH1 AV1 AX1 AF1
0-48.8-97.6 11.83748 0.10765 5.78054 0.0875 10.71427 0.06076 13.81725 0.11493
97.6-146.4-195.2 0.40003 0.46047 0.4165 0.48375 0.20533 0.13889 0.13817 0.19486
195.2-244-292.8 0.11064 0.48639 0.20026 0.70365 0.1272 0.21307 0.09583 0.18771
292.8-341.6-390.4 1.17553 1.16478 1.3357 1.23917 1.32337 1.25405 7.72189 11.07167
390.4-439.2-488 0.87025 2.12186 1.18969 2.75052 0.86879 1.54391 2.71934 12.47834
488-536.8-585.6 0.10185 0.04322 0.40661 0.12851 0.11849 0.06583 0.52337 0.31485
585.6-634.4-683.2 0.71931 0.84599 2.0688 0.55668 0.25818 0.29001 0.50278 0.29489
683.2-732-780.8 0.26717 0.89941 2.56491 4.81765 1.06098 1.39717 1.31889 2.3443
780.8-829.6-878.4 18.2936 15.54574 4.56057 9.81504 11.01619 17.52673 6.91629 6.67179
878.4-927.2-976 6.12892 3.89987 4.94095 14.36692 4.33762 4.2114 1.27943 1.53385
976-1024.8-1073.6 1.75398 1.538 1.25011 0.96431 1.60551 1.57388 1.58954 0.76178
1073.6-1122.4-1171.2 5.0827 1.4131 1.93535 0.95952 1.13102 2.13036 1.92052 1.36345
1171.2-1220-1268.8 0.25266 0.21848 0.26895 0.10618 1.96132 0.47732 1.06104 0.32261
1268.8-1317.6-1366.4 0.05247 0.02679 0.02973 0.02017 0.06656 0.06343 0.06709 0.04691
1366.4-1415.2-1464 0.00967 0.01493 0.02112 0.04748 0.0603 0.18924 0.04847 0.08254
1464-1512.8-1561.6 0.02744 0.01717 0.01595 0.02141 0.33246 0.20976 0.41751 0.60983
1561.6-1610.4-1659.2 0.00406 0.0039 0.00159 0.00128 0.00607 0.00449 0.0071 0.00254
1659.2-1708-1756.8 0.02032 0.03381 0.03244 0.02832 0.17736 0.16002 0.23155 0.22683
1756.8-1805.6-1854.4 0.02326 0.02624 0.02376 0.02156 0.15574 0.45405 0.20846 0.48702
1854.4-1903.2-1952 0.14745 0.11437 2.23948 0.30995 2.95712 0.44362 0.26881 0.18205
1952-2000.8-2049.6 2.04163 0.53898 2.11185 3.40088 1.26235 2.16138 0.13642 0.17229
2049.6-2098.4-2147.2 0.81639 0.879 0.63005 0.79069 1.82968 1.11573 2.01292 1.61902
2147.2-2196-2244.8 0.98642 2.68592 2.18729 6.61357 1.39714 1.37662 2.09336 1.35695
2244.8-2293.6-2342.4 0.0367 0.07076 0.0554 0.13813 0.66351 1.51351 1.11872 2.78087
2342.4-2391.2-2440 0.15291 0.10187 0.15081 0.07264 0.32696 0.24858 0.24518 0.31601
2440-2488.8-2537.6 1.60677 0.49087 0.70396 0.26044 4.05759 1.47346 4.12668 1.38121
2537.6-2586.4-2635.2 0.05527 0.05882 0.01342 0.0246 0.01207 0.00987 0.01707 0.01191
2635.2-2684-2732.8 0.04233 0.02655 0.00895 0.01356 0.00418 0.01527 0.0121 0.00935
2732.8-2781.6-2830.4 0.01758 0.025 0.00418 0.00475 0.00356 0.00461 0.00922 0.00435
2830.4-2879.2-2928 0.03348 0.04938 0.01024 0.00983 0.00703 0.00776 0.01058 0.01452
Other 13.02241 16.08218 11.61727 2.40519
Set total energy of signal as E0, then:
8
2 1
0 10
0 , j j
E E
−
=
=
∑
(6)The percentage (%) of the energy of each band to total energy is:
10
0
100 , j j
E
E %
E
= × (7)
According to the minimum operating frequency and
In the experiment, the main band range of the measuring point AH1, AV1, AX1 and AF1 was 292.8-448Hz and 780.8-1172.2Hz; 292.8-448Hz and 585.6-1122.4Hz; 292.8-448Hz and 683.2-1220Hz; 292.8-448Hz and 683.2-1220Hz respectively. The distance of each measuring point to the explosion source was identical, and the similar low-frequency band appeared and concentrated in 292.8-448Hz. The angle between each measuring point and the slot was different, which impacted the propagation of stress wave to some extent and resulted in the uneven distribution of high-frequency bands. The measuring points AX1 and AF1 were symmetrically located with the same band. In conducting the experiment, each measuring point was very close to the explosion source and the band area was larger, without any dominant frequency band.
5.2. Signal Filtering
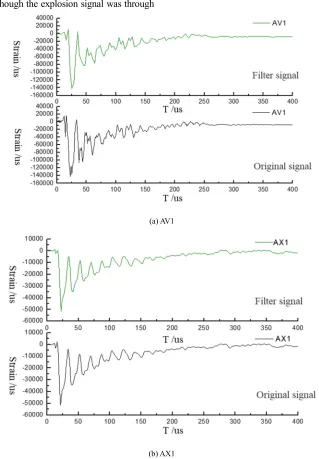
In the experiment, although the explosion signal was through
the low-pass filtering, the signal still needs to be processed through de-noising and filtering to obtain the signal approaching the true result. Considering that decomposition study needn’t be specifically treated, this work did the 9-layer decomposition of signal and each bandwidth was 97.6Hz, provided the basic filtering of instrument, based on the theory of wavelet packet decomposition. After the decomposition, according to the main band of measuring points obtained from the above analysis, the important wavelet packets were divided into the low-frequency and high-frequency portion for reconstruction respectively, the low-frequency and high-frequency portion of signals were obtained to construct the analog signals through filtering, which were compared with original signals. This work only presented, compared and analyzed the filtered signals and original signals of strain waveforms at the typical measuring point AV1, AX1, as shown in Figure 6.
(a) AV1
(b) AX1
Figure 6 (a) is the strain waveform at the measuring point AV1 at the distance of 12.5mm to the vertical slot direction, it is observed that signal composition is not so complicated and the main frequency energy can represent such signals. Figure 6 (b) is the strain waveform at the measuring point AX1 along the 45° slot direction, it is observed that signal composition is relatively complicated, the low-frequency band and high-frequency band existed proportionally and showed the superimposition and mutual interference of the stress wave portion during the application of stress wave generated from explosion on the specimen. In this manner, original signals were caused unable to pass through the transient sudden change of construction as described in the wavelet theory, since the wavelet basis is a class of local functions featuring a slow change. For such signals with relatively complicated composition, about 80% to 90% signal energy cannot correctly and accurately express the information about original signals.
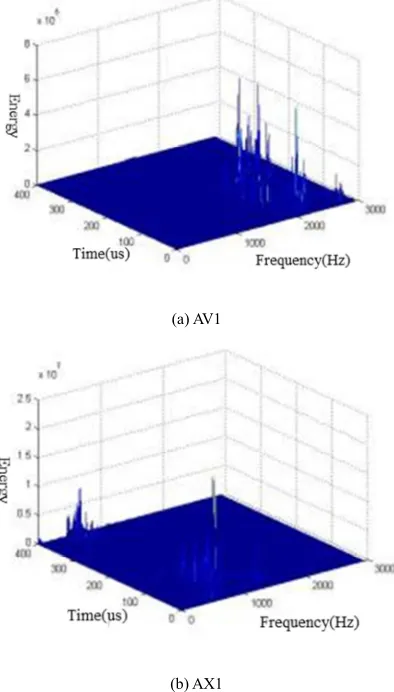
5.3. Time-Frequency Analysis of Strain Wave
The sampling rate was 100kHz, the wavelet packet analysis based on db8 wavelet basis function was done at the measuring point AV1 and AX1, the decomposition was made until the 9th layer, and the time-frequency analysis was done using Equation (3), (4) and (5), as shown in Figure 7.
(a) AV1
(b) AX1
Figure 7. Time-frequency distribution of typical measuring points.
The characteristics of every energy distribution can be better reflected in the above figure. In which, the high-frequency band was dominant at AV1, while the low-frequency band was at AX1, and time can play a greater role in the band distribution.
6. Conclusion
A “separating unit of explosion stress wave and detonation gas” was designed here. The preliminary conclusions can be drawn from the analysis of waveforms obtained in the open borehole blasting cement mortar experiment, and the energy-based time-frequency analysis:
During the process of stress wave rock breaking using slotted cartridge, with regards to the measuring points at the same distance to borehole, the strain peak along the slot direction was the largest, as followed by along the non-slot direction, along the 135° slot direction and along the 45° slot direction, and the maximum strain rate also satisfied this trend and a significant residual strain was found at the measuring point in the near explosion region.
In the rock breaking experiment under the stress wave of slotted cartridge, with regards to the measuring points at the same distance to borehole, the similar low-frequency bands appeared and concentrated in 292.8-448Hz. The included angle between each measuring point and the slot was different, which impacted the propagation of stress wave to some extent and resulted in uneven distribution of the high-frequency bands.
Acknowledgements
The author would like to thank the National Natural Science Foundation of China (No. 51704295) and Basic scientific research expenses of central universities for their support.
References
[1] Langefors U, Kihstrom B. The modem technique of rock blasting [R]. John Wildy & Sons Cc, 1963.
[2] YI-SHYONG ING, CHIEN-CHING MA. Theoretical simulations of a propagating crack subjected toin-plane stress wave loading by caustic method [J]. International Journal of Fracture, 1997, 85: 313-331.
[3] D. Bonamy, K. Ravi-Chandar. Interaction of Shear Waves and Propagating Cracks [J]. PHYSICAL REVIEW LETTERS, 2003, 91: 1-4.
[4] K. RAVI-CHANDAR, W. G. KNAUSS. An experimental investigation into dynamic fracture: IV. On the interaction of stress waves with propagating cracks [J]. International Journal of Fracture, 1984, 26: 189-200.
[5] Dally J W. An Introduction to Dynamic Photoelasticity [J]. Exp Mech, 1980, 20 (12): 409-416.
[7] Guo Zhanqi, Fei Zhizhong, Wu Mingdi. Dynamic photoelastic numerical analysis of specimens containing cracks under explosive loading [J], Journal of northern Jiaotong university, 1994, 18 (1): 81-88.
[8] Wang Mingyang, Qian Qihu. Attenuation law of explosive wave propagation in cracks [J], Chinese journal of geotechnical engineering, 1995, 17 (2): 42-46.
[9] Li Xibing. Influence of the structural weakness planes in rock mass on the propagation of stress waves [J], Explosion and shock waves, 1993, 13 (4): 334-342.
[10] Sha Guiying, Liu Diankui, Liu Ruitang, et al. Dynamic Analyses Method of Linear-elastic Fracture under Stress Wave Loading [J], Explosion and shock waves, 2002, (1): 56-60. [11] Shan Renliang, Zhou Jijun, Xia Yu, et al. Experimental
investigation on dynamic response of rockbolt under blasting load [J], Chinese Journal of Rock Mechanics and Engineering, 2011, 30 (8): 1540-1546.
[12] Pu Chanjin, Guo Xuebin, Xiao Zhengxue, et al. Dynamic strain text and analysis on pipe protecting borehole wall blasting [J], Journal of China coal society, 2008, 33 (10): 1163-1167. [13] Gaviglio P. Longitudinal waves propagation in a limestone: the
relationship between velocity and density [J]. Rock Mechanics and Rock Engineering, 1989, 22: 299-306.
[14] Liu Guoqing. Research on Rock Damage Range under Cutting Seam Cartridge Blasting [D]. Beijing: China university of mining and technology (Beijing), 2013, 6.
[15] Bauer A, Calder P N. Open pit and Blasting Seminar [D]. Canada: Queens University, 1978.