Smart Security Model by Predicting Future Crime with GIS
and LBS Technology on Mobile Device
1
Gaurav Kumar,
2P. S. Game
1,2Dept. of Computer Engineering, Pune Institute of Computer Technology,
Savitribai Phule Pune University, Pune, Maharashtra, India
Abstract
People always try to ensure that their loved ones are safe and secure. Due to increase in the crime rate since the past few decades, pupils feel unsafe in an outside environment. Traditional method like FIR is not able to predict which type of crime will occur in the future. Technology like GIS i.e. Geographic Information System is used in the analysis of data. It helps in performing future prediction based on the gathered data. A decision tree algorithm is used for
the classification of a criminal dataset. After classification, the
crime rate for each state is calculated. On the basis of the crime rate, future prediction can be made using K-means clustering. If the current location of the user is in dense crime cluster, then an alert message will be invoked on the user screen. As per the user’s need, message can be send to one or all contacts. The system is implemented using a client-server architecture where Android phone acts as a client and a MYSQL database is used on a server.
Keywords
GIS, Security, LBS, Classification, Clustering, Data Mining,
Security Alert, Android, MYSQL.
I. Introduction
Security of every citizen is a major concern of any government. In past years, the crime scale has increased very rapidly. It has challenged various security agencies to maintain law and order in the country. It has created an unsafe environment among people. People are migrating different places in order to live peaceful life. There are different laws for ensuring people safety. But the existing system is unable to enforce this law. So, criminals are taking advantage of this old system and always harm the humanity from their latest technology equipped systems.
Over decade, according to government survey [5] it is found that smart phone which provides facilities like Location Based Services (LBS) and Global Positioning System (GPS) are more used than standard calling phones. Apart from Location Based Services (LBS), new technology like Geographic Information System (GIS) is used for collecting information about different areas. But still the police investigation process follows the manual method. In our proposed system crime dataset [18] is used as an input for classifying and predicting future crime of a particular area. This dataset is freely available from Indian government on National
Crime Records Bureau (NCRB) official website [18].
Criminal dataset has been classified using a decision tree algorithm [4]. Dataset is classified on the basis of crime type, and crime
rate is calculated accordingly. After considering crime rate for Maharashtra state, k-means clustering is applied for generating cluster of High, Medium and Low crime prone zones [7] [11].
We have used the concept of Data mining and Location Based Services to ensure the safety of our citizens. Citizen’s security is
one of the major issues that need to be solved as soon as possible in our country. Proposed system includes security alert facilities for the application users. If the location of the user is found in the crime prone zones, then an alarm message will be generated. This will notify user about that crime area and suggest avoiding the crime prone area as possible.
The system has been implemented using client server architecture where Android phone is considered as a client for running the application. Web service has been created for establishing communication between client and server. JSON parser has been used for parsing data that are going and coming from client and server. This increases the data security because JSON generate Key-Value pair while transferring data between client and server.
A. Data Source
Over past year Geographical Information System (GIS) and Location Based System (LBS) have become one of the necessary components in all kinds of business, government agency, cyber crime and criminal activities. Field data is collected using Geographical Information System (GIS) technique [5]. Advantage of using this technique over Global Positioning System (GPS) is that it gives large information about the environment apart from just latitude and longitude. It was not possible earlier, with the manual data collection method and it was very time consuming. Crime related data are collected from Indian government websites National Crime Records Bureau (NCRB) that provide free crime dataset [18]. GPS is one of the primary sources of data collection method, when there is a need for location related data on a smart phone.
B. Classification and Crime Prediction
Investigation process in India still considers First Information Record (FIR) as their main source of information. It is always time consuming and prone to human error. But, still it is used everywhere for investigation purpose. There are different types of data collected during the process of investigation. This data need
to be classified into pre-defined class according to investigation
needs. But extracting important information from that variable data is really a challenging task, which will help police in their investigation process.
So, in this proposed system decision tree algorithm has been used
for classifying crime dataset [4,7]. This classification algorithm tries to find the common properties in crime dataset and classify
them into different classes. It uses data mining technique which is used for extracting information from a given dataset. This approach in our system has reduces the investigation time to a great extent. Initially, this algorithm starts classifying dataset from root node. Then it recursively select the best attribute in order to separate data and expand the leaf until it meets the desired criteria.
K-means clustering algorithm has been used for creating crime
prone clusters using classified classes [7, 10]. As soon as the cluster
is formed, crime analysis can be performed on those clusters. This analysis consists of identifying changes in the pattern of crime over year after year. On the basis of these changes, future prediction has been made and marked on Google map.
II. Literature Survey
Security is a major issue in today’s fast growing world. There
are many researchers who contributed in this field and propose
different solution to provide citizen’s security.
AL-Mazloum, Omer and Abdullah (2014) proposed an Android
application which uses GPS and SMS technology to track child location and show on parent mobile map. There are mainly two applications, one for children and another for parents in which the child does not have to perform any task. Child application runs in the background and whenever a parent wants his/her child location, then it just needs to request to child application and the child application respond which SMS and location is shown on the map in real time.
Nitin and Swati (2014) considered huge dataset of criminal records
as an input and J48 decision tree algorithm applied. After applying the algorithm, different cluster was formed which are organized into different classes. As soon as the data have been clustered,
crime pattern is identified by analyzing the data over the years.
Yousif and Naser (2013) discussed various techniques like GIS,
GPS and LBS which focused on collecting data from the user while moving in the environment and storing into the MYSQL database. After, collecting data it uses to show on user smart phone using GIS map. This paper also discusses the method how it updates data on a map according to the user’s location.
Abhijeet Tekawade and Ahemad Tutake (2013) proposed a mobile
application consists of anti theft functionality. It describes the feature of locating friends or family members on the basis of mobile location based services. The Author has developed such a method in which mobility can be tracked and if it gets lost, then it will send the Geo-coordinates to nearby friends.
Malathi and SanthoshBaboo (2011) had discussed the modification
in different exciting algorithm like MV and Apriori algorithm for the purpose of predicting future crime using data mining
techniques. This paper also identifies the frequent crime that
occurs year after year and on the basis of change it will predict the future crime that can occur.
So, in the literature survey table, different paper’s advantage
and limitation has been identified and proposed system tried to
overcomes these limitations.
A detail literature survey has been conducted and represented in
below Table 1 on GIS, LBS, classification and predicting future
crime algorithm.
After doing survey, it is found that there is a need for a system which can predict future crime prone area and alert the user of that area while travelling. So, in this proposed system we have
developed an application which uses classification and clustering
technology for extracting information from criminal dataset. It shows the crime prone area on map to users.
Table 1: Literature Survey
III. Proposed Framework
The architecture of our system is shown in fig. 1.
It explains how different users like the admin and number of clients interact with the system. It also shows how different components of mobile, server and database are communicating with each other. In this framework Indian crime dataset is used for the purpose of
classification and prediction for future crime available at National
Crime Record Bureau (NCRB), India.
Fig. 1: Architecture of Proposed Framework
predictions for the upcoming year, output will be shown on the
map of the user. This final output will check the user location and if found close to a crime area, alert notification will be invoked.
Different components of the proposed framework are as
follows:-A. Database
It consists of crime dataset which have different criminal records from 1956 present. It includes all types of a crime like murder, riots, robbery etc.
B. QGIS Server
It consists of DB manager which is used to connect to the database to QGIS server. Then it consists of Map composer where the map is created and data are plotted over the map. This map composer has two layers called Vector layer and Raster layer.
C. Mobile Device
It must consist of security application, LBS, and Google map in order to see the crime data and prediction over the map.
D. Users
There are basically two types of users identified so far in the
system. One who controls and develops the application is called as admin and the one who use this application is called as a client.
IV. Mathematical Model
Input: Indian crime Data-set since 1956 to present.
Output: After classification and clustering crime prone zone is
show on map of application installed on user Android phone.
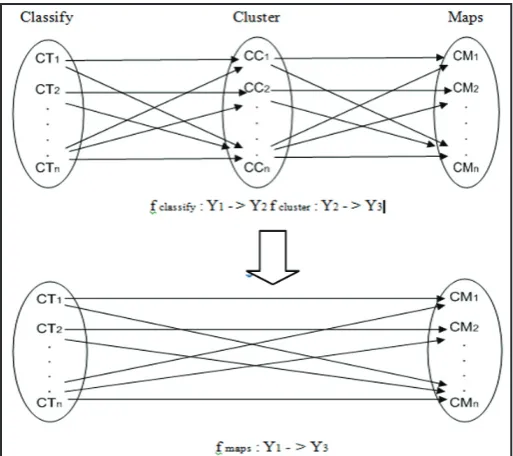
S = {s, e, X, Y, fclassify, fcluster, fmaps, CD, Success, Failue}
Where, S = A proposed System from programmers viewpoint. s = Start State
e = End State
X = Input of the System Y = Output of the System
fclassify = Classification function of the system.
fcluster = Clustering function of the system.
fmaps = Maps function create different maps as per crime type
identified in classification.
CD = Criminal Data-set of different states of INDIA. Success = Success state
Failure = Failure State
Now, lets us describe these variables for proposed system
X = Input of the system
= Indian criminal records of different states. = {CD}
Y = Output of the system = {Y1, Y2,…….Yn} Where,
Y1 = (CT1, CT2, ………, CTn)
= CT1…..CTn are the different crime type. Y2 = (CC1, CC2,………..CCn)
= CC1…..CCn are the different crime cluster.
Y3 = (CM1, CM2,………..CMn)
= CM1…..CMn are the different Crime Map after classification
and clustering as output.
Y1 = f classify(X) Where,
X -> CD {CD belongs to X}
fclassify ->
Y1 - > CT1……CTn Where,
N = name of crime type classified.
Ci = no. of crime type classes will be formed i.e murder, dacoity and riots.
Y2 = f cluster (X) Where,
X -> CD{CD belongs to X}
fcluster -> (L, M , H)
Y2 - > CC1……CCn Where,
Where,
CR=Crime rateof Maharashtra and α1 ≤ 250.
Where,
CR= crime rate of Maharashtra and α2 ≥ 250 < 1000.
Where,
CR=Crime rate of Maharashtra and α3 ≥ 1000.
Here, i =1 and n=1 because crime rate of only one state is considered here i.e Maharashtra out of all states.
Y3 = fmaps (X)
Where,
X -> CD {CD belongs to X}
f maps:f classify ->f cluster
Y3 - > CM1,CM2……CMn
The formula used for calculating the number of crimes per 100,000
populations
is:-It gives crime rate per 100,000 population of a place.
Assuming threshold for crime prone zone as
α1 ≤ 250, α2 ≥ 250 < 1000 and α3 ≥ 1000.
Threshold for crime zones are assumed on the basis of frequency of crime, which has been recorded in the Indian criminal dataset
of 207240 records. So after analysis, number of crime incident
Success State:
Classification of dataset into murder, dacoity and riots is
1.
correctly performed using decision tree algorithm.
Clustering of classified data is done into different clusters of
2.
high, medium and low crime prone zone.
Data is displayed on the map using GIS and Google Map of
3.
user android phone.
Failure State
Device location should not be manually set because system is 1.
developed for Maharashtra state only and if current location is away from Maharashtra then system will fail.
Application will crash if the response coming from server 2.
is not parsed using JSON parser exactly same (key, value) format as it is send.
Fig. 2: Mapping of Different Operations in Proposed System
V. Algorithm Solution
A. Classification Algorithm
Classification technique is used to find common properties
among different attributes of crime and criminal dataset. After
identification of common property, it organizes those data into different classes which are predefined.
In crime application, dataset provides information about all past records of type crime held during past years. In this case, we divide a dataset as a suspected area on the basis of crime rate in different states by type of crime like murder, riots, robbery etc.
Decision Tree
Algorithm:-This algorithm is a widely used classification technique due to its
simplicity. Structure of this tree is divided into three nodes.
A root node which does not have any incoming edge but 1.
more outgoing edges.
Internal nodes consist of exactly one incoming edge and two 2.
or more outgoing edges.
Leaf nodes, have exactly one incoming edge but no outgoing
3.
edges.
This algorithm works
as:-Initially, training records starts from root node. The input of
this algorithm consists of crime dataset of India since 1956 to present.
Step 1: Creating Root node c = crime as a starting point of
classification.
Step 2: Check if attribute = murder, riots and robbery. Then classify as crime prone zone class.
Step 3: Else classify as non crime zone area. Step 4: Repeat step 2, 3 till the last record.
Step 5: Terminate tree.
B. Prediction Algorithm
The next task after classification is to predict future crime. This
involves tracking crime rate changes from one year to the next year and tries to predict next year on the basis of change patterns
identified.
For this purpose, we need to apply clustering technique to obtain the crime changes as output.
So, K-means has been used for creating cluster of classified crime
types.
Input: crime type, the number of clusters, number of Iteration. Step 1: Randomly choose the cluster center.
Step 2: Assign values to clusters based on their distance to the cluster centers.
Step 3: Centers of the cluster are adjusted.
Step 4: Go to step 1 until all records over. Step 5: Output C0, C1, C2, C3 etc.
Where, C0 = higher or dense crime prone cluster.
C1 = less than C0 and so on till the last cluster having minimum crime prone cluster.
From the cluster result, the state crime trends for each type of
crime are identified each year.
VI. Experimental Setup
The experimental setup for the proposed system consists of a database and an android smart phone with installed proposed system application. Platform and technology, used for building this proposed system are as
follows:-Operating system: Windows or Linux for development and android for client.
Web server: XAMPP or LAMP and QGIS. Language: PHP, Core Java, XML.
Database: MYSQL.
Mobile: Android smart phone.
Dataset: Criminal records from NCRB, India.
VII. Result and Discussion
A. Performance Measures Used
1. Space Complexity
Proposed system required only 2.47 MB space.
•
No mobile database (SQLite) is used.
•
Light weight MYSQL DB is used.
•
Simple decision tree classification algorithm is used. •
No internal call of other algorithm is used.
•
2. Time Complexity
on phone.
Not used heavy .jar files. •
Light weight JSON parser is used for fetching data.
•
No heavy calculation or computation is performed by the
•
algorithm.
B. Calculating Complexity Using FPS
For calculating complexity of the project different parameters 1.
need to be considered, while doing calculation. Total complexity calculated is 85 fps.
2.
Table 2: Calculated Complexity Using FPS
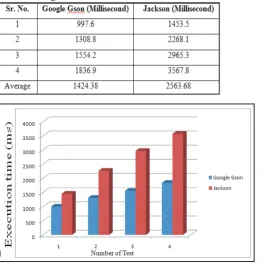
C. JSON Parsing Execution Time Analysis
This data has been obtained by using these two different libraries in JSON paring algorithm. During client server communication, response times in millisecond are recorded.
Table 3: Google Gson and Jackson execution time
Fig. 3: Google Gson vs Jackson Execution Time Analysis
Graph
Fig. 3 shows the analysis graph of 4 GSON vs. 4 Jackson libraries
execution time of JSON parsing. After making use of Google Gson for JSON parsing the execution speed become faster, which results in minimum response time as represented in graph.
D. Outcomes
Results that are achieved are listed
below:-Indian Crime dataset of 207240 records successfully classified
1.
into Murder, Riots and Robbery.
Crime rate has been calculated of Maharashtra state from 2.
crime dataset provided by National Crime Records Bureau (NCRB).
Next crime prone zones are formed by comparing crime rate
3.
with threshold value.
High, Medium and Low zones are shown on map. 4.
Alert message invoked by comparing user location and crime 5.
zone.
VIII. Conclusion
The crime rate in recent years has increased very rapidly. It includes crimes like kidnapping, murder and women rape cases.
First Information Record (FIR) is the first step, where crime
information is recorded manually. But during investigation, lots of data are collected and police try to relate those facts to identify crime patterns. This traditional method does not able to predict which type of crime is going to happen in the future.
A decision tree algorithm is used for the classification of criminal
data which is taken from National Crime Records Bureau (NCRB).
It classifies criminal dataset of 207240 record and decrease the loading time up to 10-15 seconds. As the data are classified then
frequent crime pattern is clustered and rendered on the user smart phone using Google map.
System includes crime prone zone marked on Google map. If user location found near to those marked zones, then alarm message is generated to notify user to avoid that area as soon as possible. Google Gson has been used as JSON library which helps better response time during client server communication. Send location functionality sends location information to friends and family members.
So, this work may help to create a secure environment to some extent. But in order to achieve safety to the fullest, all citizens need to be made aware that we are human and everyone has the right to live free without fear.
References
[1] Rasoul Kiani, Siamak Mahdavi, Amin Keshvarzi,“Analysis
and Prediction of Crimes by Clustering and Classification”, International Journal of Advanced Research in Artificial Intelligence(IJARAI),vol. 4, no. 8, pp. 11- 17, 2015.
[2] A. Al-Mazloum, E. Omer, M. F. A. Abdullah,“GPS and
SMS-Based Child Tracking System Using Smart Phone”,
International Journal of Electrical, Computer, Energetic, Electronic and Communication Engineering, Vol. 7, No. 2,
pp. 171- 174, 2014.
[3] Nitin Nand Kumar Sakhare, Swati Atul Joshi,“Classification of Criminal Data Using J48-Decision Tree Algorithm”,
International Forum of Researchers Students and
Academician, Vol. 4, No. 3, pp. 167- 171, August 2014.
[4] Nagi Zomrawi, Mohammed Yousif, Omer Naser, “Development
of Integrated Mobile GPS GIS System”, International Journal of Engineering and Innovative Technology (IJEIT), Vol. 3, No. 6, pp. 19- 34, December 2013.
[5] Abhijeet Tekawade, Ahemad Tutake,“Mobile Tracking
Application for Locating Friends using LBS”, International
Journal of Innovative Research in Computer and
Communication Engineering, Vol. 1, No. 2, pp. 303- 308, April 2013.
[6] Jyoti Agarwal, Renuka Nagpal, Rajni Sehgal,“Crime
[7] Katina Michael, Roger Clarke,“Location and tracking of
mobile devices: surveillance stalks the streets”, International
Journal of computer law & security Journal, No. 29, pp.
216- 228, April 2013.
[8] Sukanya.M, T.Kalaikumaran, Dr. S.Karthik,“Criminals and crime hotspot detection using data mining algorithms:
clustering and classification”, International Journal of
Advanced Research in Computer Engineering and Technology
(IJARCET), Vol. 1, No. 10, pp. 225- 227, December 2012.
[9] Malathi. A andS. Santhosh Baboo Reader,“An Enhanced
Algorithm to Predict a Future Crime using Data Mining”,
International Journal of Computer Application, Vol. 21, No.
1, pp. 1- 6, May 2011.
[10] A. Malathi, Dr. S. Santhosh Baboo,“Algorithmic Crime Model Based on the Analysis of Crime Clusters”, Global
Journal of Computer Science and Technology, Vol. 11, No.
11, pp. 46- 52, July 2011.
[11] Asmaa Ahmed Hussein, Elkhedr Hassan Eibrahim, “Mobile geographic information systems: A Case study
on MANSOURA UNIVERSITY, EGYPT”, International
Journal of Computer Science & Information Technology
(IJCSIT), Vol. 3, No. 6, pp. 173- 182, December 2011.
[12] Binod Vaidya, Joel J. P. C. Rodrigues,“mTracker: A
Mobile Tracking Application for Pervasive Environment”,
International Conference on Advanced Information Networking and Applications Workshops, Vol. 1, No. 2, pp.
962- 967, April 2010.
[13] Roger S. Pressman,"Software Engineering: A Practitioner’s Approach", New York: McGraw Hill, 2001.
[14] “Women helpline”, [Online] Available: https://play.google. com/store/, [Accessed: November 2015].
[15] “CitizenCop”, [Online] Available: https://play.google.com/ store/, [Accessed: November 2015].
[16] “Crime in India”, [Online] Available: https://data.gov.in/ catalogs/, [Accessed: January 2016].
[17] “National Crime Record Bureau”, [Online] Available: http:// ncrb.gov.in/, [Accessed: January 2016].
[18] “Crime Reporting Server”, https://members.000webhost.