E-ISSN 2308-9830 (Online) / ISSN 2410-0595 (Print)
An Enhanced Random Waypoint Mobility Model
NGUYEN NGOC VAN
School of Electronics and Telecommunications, Hanoi University of Science and Technology, No 1, Dai
Co Viet Street, Hai Ba Trung, Hanoi
ABSTRACT
The movement pattern of users is of significant when evaluating the performance of different kinds of algorithms in wireless networking environments. In this paper, we propose an enhanced random waypoint mobility model (ERWP) to achieve a good trade off between reality and complexity. ERWP model uses two stochastic processes for speed change and waiting control, which make the movement of nodes smoother and more realistic. Simulation shows that the proposed ERWP model can provide a spatial distribution and movement behavior of a user in mobile region.
Keywords:Mobility Model, Modeling and Simulation, Random Waypoint Mobility Model.
1 INTRODUCTION
Movement pattern of users is of fundamental importance when evaluating the performance of different kinds of algorithms in wireless networking environments. If the model is unrealistic, invalid conclusions may be drawn. Since real movement patterns are difficult to obtain, a common approach is to use synthetic mobility models which can still capture the essential impact of mobility on the protocol performance in wireless networks. The advantage of using synthetic models is that they can be processed more easily in analysis or implemented in simulations [1] [2].
In cellular networks, for example, a user's mobility behavior directly affects signaling traffic of handover and location management (location updates and paging) [3]. In addition, mobility has a major effect on channel holding time in circuit-switched services [4] which in turn has huge influence on call blocking and dropping probability [5]. Combining mobility metrics with traffic models, [6] shows that cell residence time with their model can be described by a generalized gamma distribution and [7] analyzes mean handover rate for voice calls. [8] describes three different mobility models for three environments:
an indoor office, an outdoor pedestrian
environment, and a vehicular environment. [9] proposes an integrated QoS-aware mobility and user behavior model for wireless data networks.
The most commonly used mobility model in the networking research community is the random waypoint (RWP) model, which was originally proposed for studying the performance of ad hoc routing protocols by Johnson and Maltz [10]. [11] and [12] describe the stationary distributions and stochastic properties of RWP model in detail.
Random waypoint on the border model (RWPB) [13]
and Markovian Waypoint Model (MWP) [14] are the
variants of RWP model. In the former, the waypoints must be uniformly distributed on the border of the domain. In the latter, the next waypoint only depends on the current waypoint.
The traditional models, either are too simple to describe realistic movement, such as RWP model, or are too complicated to apply in simulation, such as integrated QoS-aware mobility and user behavior model. This paper proposes an improved model of RWP which focuses on micro-mobility models in two dimensions. We employ a combination of principles for direction and speed control that make the movement of users (e.g., pedestrians and cars) more realistic than that in the RWP model. In fact, our model represents a trade off between simple models (i.e., RWP model), and very realistic mobility models (those from transportation research or movement traces). The latter are usually very complicated to implement and/or need a heavy processing.
The remainder part of this paper is organized as
follows. SectionⅡshows the theory of enhanced
the stochastic properties analysis. A conclusion is
made in section Ⅳ.
.
2 ENHANCED RANDOM WAYPOIT
MOBILITY MODEL
A. RWP Mobility Model
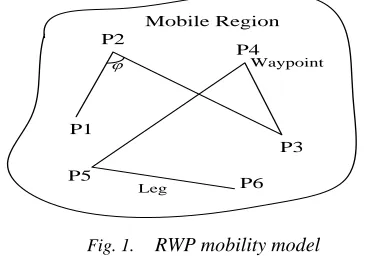
In the RWP mobility model, each mobile node in the mobile region randomly selects a destination. After staying in place for some random time, the node selects the next destination at random for the next movement, as shown in Figure 1. Usually this process is repeated till the end of the simulation.
Definition of RWP mobility model can be briefly summarized as follows:
(1) Each node moves from a destination
(waypoint) to the next destination (waypoint)
along the Z-shaped route;
(2) Waypoints obey uniform distribution in a given
region;
(3) A Node waits a random pause time or doesn’t
wait at each waypoint before starting to move
towards the next waypoint;
At the beginning of each moving interval (leg), a random velocity for each leg will be chosen;
P1 P2
P4
P3
P6 P5
Waypoint
Leg
Mobile Region
Fig. 1. RWP mobility model
B. Enhanced Random Waypoint Mobility Model
The new choice for speed
and direction
isnot correlated to previous values in the random waypoint mobility model, with the result of unrealistic movement behavior with no speed
changes ( ()0
t
t ) and sharp turnings (large
) (t t
while
is high). Our model includesautocorrelation between velocity and direction on the basis of RWP mobility model.
Figure 2 shows the flowchart of enhanced random waypoint mobility model. In initialization step, on the one hand, three waypoints instead of
two from a uniform distribution over the mobile regional must be chosen (Note: distance between the three adjacent waypoints must be larger than constant d (|P1P2| > d, |P2P3| > d; P1 is the first waypoint, P2 is the second waypoint, P3 is the third
waypoint). On the other hand, an initial speed
forthe node should also be chosen. We define four static speed parameters to describe a certain node. Each node class has
a maximum speed max,
a target speed when turning tu rn,
a set of preferred speeds {1, 2, … } ,
maximum value for acceleration/deceleration.
Maximum speed max reflects the maximum
allowed speed in a given scenario. A User tends to
move at tu rn when it changes the direction. Users
tend to move with certain "travel speeds" most of the time. For example, a car in the city frequently stops at the crossroads or due to jams, and tends to
move with the maximum allowed speedmax. This
information is included in preferred speeds. The maximum values for acceleration and deceleration reflect the capabilities of user in physical speeding up and slowing down. The next thing in
initialization is to choose an initial speed
. Thespeed is chosen from a certain speed distribution. We use a distribution in which the preferred speed values have a higher probability, and a uniform
distribution is assumed on the interval [0, p(1)),
…, (p(n),max].
Initialization
Determine whether there is a pause time at the next waypoint according
to the probability distribution
whether there is a pause time Model the frequency of speed
change events according to a Poisson process
Model the frequency of speed change events according to a
Poisson process When the distance between user and the next waypoint is equal to d*, implement guidelines of turn
After arriving at the next waypoint, select the new waypoint After arriving at the next
waypoint, select the new waypoint and choose new speed
YES NO
Fig. 2. Flowchart of enhanced random waypoint mobility model
The possibility of whether there is a pause time at the next waypoint follows Bernoulli process whose parameter is p*. A User goes with constant velocity
event, a new target velocity
*is also chosen from
(1). After choosing a target velocity
*, acceleration 0
a must be set. The absolute value of
acceleration |a| chooses from (2)
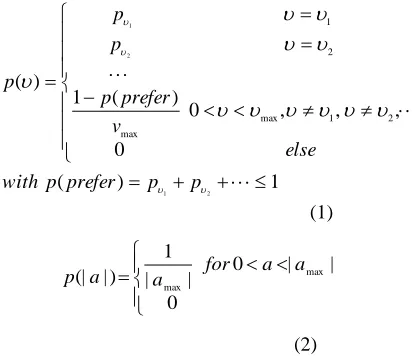
1 ) ( 0 , , , 0 ) ( 1 ) ( 2 1 2 1 2 1 max max 2 1 p p prefer p with else v prefer p p p p (1) 0 | | 0 | | 1 | ) (| max max a a for a a p (2)
The frequency of speed change events is a
Poisson process whose parameter is, which
means the velocity change event occurs with a
certain probability each timestep.
If there is no pause time at waypoint, a user will turn at a certain speed. It is very clear that user can’t make sharp turning at high speed, so our model must obey to the rationale as follows:
If moving direction is very small, for
example, it less than a threshold angle (the
angle
is 45 degrees in our model), a userdoes not need to slow down.
If moving direction is larger than threshold
angle
, a user must choose a deceleration toslow down at meters away from
destination (waypoint) so that the speed of the user at waypoint can be lower than threshold velocitytu rn.
When a user arrives at the waypoint, it will
choose a new target velocity
*from (1) and an acceleration / deceleration from (2). If the coordinates of three waypoints are
) 1 , 1 ( 1X Y
P , P2(X2,Y2) andP3(X3,Y3), the
moving direction can be calculated from (3)
180 ] ) 2 3 ( ) 2 3 [( ] ) 1 2 ( ) 1 2 [( ) 2 3 ( ) 1 2 ( ) 2 3 ( ) 1 2 ( arccos 2 2 2
2
Y Y X X Y Y X X Y Y Y Y X X X X (3)
3 SIMULATION ANALYSIS
In this section, a spatial distribution of network nodes is given as a result of our simulation, and a typical movement trace is simulated. We study the spatial distribution of nodes resulting from their ERWP movement in a square area whose side length is 50 meters. Our simulation tool takes as input the mobility parameters of the ERWP model: maximum speed, turning speed, maximum values for acceleration/deceleration, threshold of steering angle, deceleration distance, parameter of Bernoulli process, parameter of Poisson process, time step, preferred speeds and their probability. A number of n = 1000 nodes are distributed uniformly and independently at random in a square area; then, they start moving according to the ERWP mobility model. Result shows that the initial node distribution is not uniform. TABLE 1 shows example parameters in simulation.
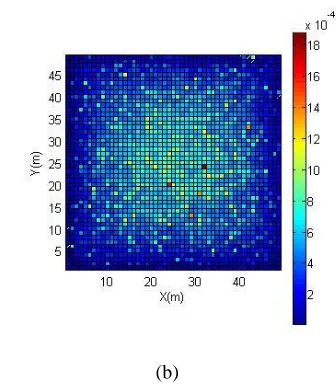
In order to record the node spatial distribution, square area is divided into a number of square cells of the same size, arranged in a grid fashion. In the experiments, we use a grid of 50×50 cells with side lengths 1/50. After 1000 time steps, the number of nodes in each cell is recorded. These numbers are accumulated over 1000 simulation runs and are reported as the result of the experiment. These values for the number of mobility steps and simulation runs are chosen because they are a good trade off between statistical accuracy and running time.
Figure 3 shows the spatial distribution of enhanced random waypoint mobility model. It shows that spatial distribution of nodes is not uniformly distributed and the probability of central mobile region is higher than that of the peripheral region. In simulation, researchers can use the spatial distribution to obtain location information of mobile users without simulating the movement of each user. So it achieves a good trade off between accuracy and convenience.
Table 1: Example parameters in simulation
Parameters Value
Maximum speed max 60 km/h
Turning speed 2 m/s
Preferred speeds {1, 2, …
}
Probability
[0 20 40] km/h
[10% 40% 40%]
acceleration/deceleration amax
Threshold of steering angle
45
0
Deceleration distance 10 m
Parameter of bernoulli process p*
0.3
Parameter of poisson process
0.1
Time step 0.1 s
Number of user n 1000
Figure 4 represents the movement and speed behavior of a user in mobile regional. It indicates that the velocity of user is continuous and will not have a sudden change. When a user is turning at a high speed, it does slow down.
4 CONCLUSION
This paper presents an enhanced random waypoint mobility model based on realistic movement behavior. We use two stochastic processes for speed change and waiting control to make the movement of nodes smoother and more realistic. Our model has specifically considered three issues: 1. Speed selection; 2. Turn decelera-tion; 3. Stop at waypoint. Spatial distribution and movement behavior of a user in mobile region through simulation are obtained, with the result that our model achieves a good trade off between reality and complexity. In the future, we are planning to use the traces generated by ERWP to accurately investigate the performance of different wireless networks protocols.
(a)
(b)
Fig. 2. Spatial distribution of enhanced random waypoint mobility model
Fig. 3. Movement and speed behavior of a user in mobile regional
5 REFERENCES
[1] C. Bettstetter, “Mobility Modeling in Wireless
Networks: Categorization, Smooth Movement, and Border Effects,” ACM Mobile Comp. and Comm. Rev., vol. 5, no. 3, 2001.
[2] M.M. Zonoozi and P. Dassanayake, “User
Mobility Modeling and Characterization of Mobility Patterns,” IEEE J. Selected Areas in Comm., vol. 15, pp. 1239-1252, Sept. 1997.
[3] J. Eberspicher, H.-J. V6gel, and C. Bettstetter.
GSM - Switching, Services and Protocols. John Wiley & Sons, 2nd edition, March 2001.
[4] R. A. Gutrin. Channel occupancy time
distribution in a cellular radio system. IEEE Trans. on Vehicular Technology, 36(3):89-99, August 1987.
[5] Y.-B. Lin. Performance modeling for mobile
[6] M. M. Zonoozi and R Dassanayake. User mobility modeling and characterization of mobility patterns. IEEE Journal on Sel. Areas
in Communications, 15(7): 1239-1252,
September 1997.
[7] S. Nanda. Teletraffic models for urban and
suburband microcells: Cell sizes and handoff rates. IEEE Trans. on Vehicular Technology, 42:673-682, November 1993.
[8] ETSI. Selection procedures for the choice of
radio transmission technologies of the UMTS (UMTS 30.03, version 3.2.0). Technical report,
European Telecommunication Standards
Institute, April 1998.
[9] Resta, G.; Santi, P, WiQoSM: An Integrated
QoS-Aware Mobility and User Behavior Model for Wireless Data Networks, IEEE Transactions on Mobile Computing, Volume 7, Issue 2, Feb. 2008 Page(s):187 - 198
[10]D.B. Johnson and D.A. Maltz, “Dynamic
Source Routing in Ad Hoc Wireless
Networks,” Mobile Computing, vol. 353, Kluwer Academic Publishers, 1996.
[11]W. Navidi and T. Camp, "Stationary
distributions for the random waypoint mobility
model", IEEE Transactions on Mobile
Computing, vol. 3,pp.99-108, Jan.-Feb. 2004.
[12]Christian Bettstetter, Hannes Hartenstein and
Xavier Pérez-Costa,"Stochastic Properties of the Random Waypoint Mobility Model",
Wireless Networks,vol.10,pp.555-567.Sept.
2004
[13]C. Bettstetter and C. Wagner, “The Spatial
Node Distribution of the Random Waypoint Mobility Model,” Proc. German Workshop Mobile Ad Hoc Networks (WMAN), Mar. 2002.
[14]Hyytia, E.; Lassila, P.; Virtamo, J, “A
Markovian Waypoint Mobility Model with Application to Hotspot Modeling”, IEEE International Conference on Communications, Volume 3, June 2006 Page(s):979 – 986
[15]Pamanik, A.; Choudhury, B.;Choudhury, T.S;