Effect of Processing Parameters and amount of
additives on the Mechanical Properties and Wear
Resistance of Copper-based Composite
Montasser Dewidar
a*, G.T. Abdel-Jaber
b, Mahmoud Bakrey
a, and Hussien Badry
aa
Department of Eng. Materials and Design, High Institute of Energy, South Valley University, Aswan ,Egypt . b
Department of Mech. Eng, Faculty of Engineering, South Valley University, Qena, Egypt . *Corresponding author's e-mail: [email protected] , Tel +20973481234
Abstract-- Copper–graphite composites with graphite contents 2.5, 5, 7.5, and 10 wt.% was formed by powder metallurgy. Effect of the processing parameters on the wear resistance and the compression strength of the composites were studied. Three compaction pressures (150, 250, and 350 MPa)
and three sintering temperatures (900, 950, and 1000 oC) were
applied. Lead or zinc with 0.5, 1, and 1.5 wt.% of was mixed with (copper/2.5 or 5 wt.% graphite composites) which give good values of hardness, compressive strength and wear resistance.
The wear testing was carried out using a pin-on-disc wear tester. Vickers hardness measurements were used to investigate the hardness of the products. For copper graphite composites, increase of compaction pressure and sintering temperature increased the relative density of both green and sintered parts which increases the mechanical properties. At low graphite contents (0 to 5 wt %) the copper particles were coherent. S o, the wear resistance increases. and with increasing amount of graphite, particles of graphite work as insulation to the particles of copper, so the mechanical properties and wear resistance were reduced. Improvement in the mechanical properties and wear resistance was observed when adding 0.5, 1, 1.5 wt% of lead or zinc to copper- graphite (cu+2.5 or 5 wt% graphite) composites.
1. INT RODUCT ION
Composites of copper-based sintered, especially copper– graphite compacts, produced by powder metallurgy processes are now widely used in tribological engin eering parts, such as bearings, and electrical contact parts, notably carbon brushes for engines, generators, and automobile kick starters. Some of the features that define the performance of an electrical contact are: electrical resistivity, wear, hardness, corrosion, etc. The advantage of the copper– graphite composites is the combination of the positive characteristics of both elements, such as electrical and thermal conductivity from the copper and a low thermal expansion coefficient and lubricating prop erties from the graphite [1].
Powder metallurgical processes have many advantages of using over other processes such as the possibility of obtaining uniform brushes and of reducing the tedious and costly machining processes. By contrast, there are some limitations of this technology related with the poor affinity between copper and graphite, which gives rise to weak interfaces with the consequent negative effect on the structural, mechanical and electrical properties of the product [2, 3].
A high wear resis tance of this material is necessary because the brushes rub on rotating metal parts. In order to optimize the wear resistance it is important to keep porosity down to
lead and tin and with high electrical conductivity and elevated operating temperature resulted in a consolidation route, which utilized simultaneous pulse heating and powder compaction [4–8]. Moustafa et al. [9] have reported that copper–graphite composites manufactured from a mixture of copper and copper-coated graphite powders possessed a higher sintered density and yield strength than those produced from a mixture of copper and uncoated graphite powders.
Tribological properties of the composites depend on the structure of the matrix as well as the distribution of the graphite in the matrix. The addition of small amounts of lead and zinc to the composite increases the hardness and wear resistance [10].
The Objective of present work is to investigate the effect of compaction load on the physical and mechanical properties of copper composites. The amount of the reinforcements (mass percentage) of graphite, lead, or zinc that mixed with the copper-graphite powder is investigated with respect to the mechanical properties of compacts.
2. EXPERIMENT AL PROCEDURE
The copper metal powder (>50 µm supplied by Al-Gomhoria Co.) was used for all specimens as a matrix. Graphite, lead and zinc powders are blended with copper powder at different mass ratio. Powder is weighted to the required weight using a balance (HR200, of accuracy 0.01 mg). Graphite powder with grain size of > 6 µm was also supplied by (Al-Gomhoria Co.) is used as reinforcement in this work. Zinc powder grain size of > 60 µm was also supplied by the same company. Lead powder supplied by the same company in big particles form. So it was grinded firstly by a grinding machine to a grain size of > 150 µm to be used in powder metallurgy technique which requires a small grain sizes powder.
Relative densities (the ratio between the actual and theoretical densities) of the investigated sintered materials were measured. Compression testing was conducted using a universal testing machine at room temperature. The hardness of the sintered materials was measured using Vickers hardness tester. The hardnes s values of the investigated materials were calculated as the average of at least five readings.
4.5 5 5.5 6 6.5 7
150 200 250 300 350
Compaction pressure MPa
G
re
e
n
d
e
n
s
it
y
g
/cm
3
pure copper 2.5 wt% graphite 5 wt% graphite 7.5 wt% graphite 10 wt% graphite
0.5 0.55 0.6 0.65 0.7 0.75 0.8 0.85 0.9
150 200 250 300 350
Compaction pressure MPa
R
e
la
ti
v
e
d
e
n
s
it
y
pure copper 2.5 w t% graphite 5 w t% graphite 7.5 w t% graphite 10 w t% graphite
4 4.5 5 5.5 6 6.5 7 7.5
0 2.5 5 7.5 10
graphite content wt%
G
re
e
n
d
e
n
s
it
y
g
/cm
3 150 MPa
250 MPa 350 MPa
roughness of 60 µm. The applied load was 6.5 N whereas sliding speed and total sliding distance were kept constant at 0.525 m/s and 157.1 m (5 minuets per test and 100 r.p.m.). The samples were weighed before and after the testing with an accuracy of 0.01 mg to determine the weight loss. MXTCX7 digital microstructure hardness tester was used for the hardness test. Vikers hardness measurements are used to investigate the hardness of the products. The surface of the specimens was ground by using an emery paper having grain size of 400 µm. Five measurements are taken on each face of the specimen and the mean value was deduced. Uniaxial compression testing was performed at a speed of 5 mm/min. the cylindrical samples were tested using a universal-test machine until fracture.
3. RESULT S AND DISCUSSION
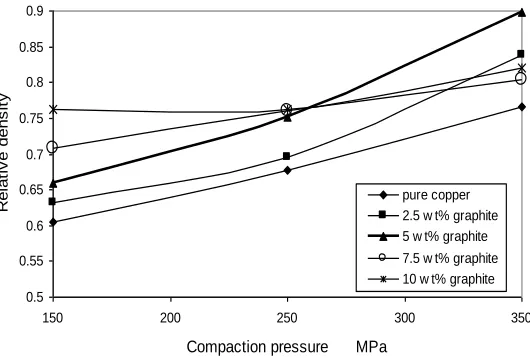
The strength of the samples depends on the compact density which depends on the compacting pressure. This is due to the presence of pores in the (PM) compacts. It was expected that increasing the compaction pressure will increase the green density and decrease the porosity which yields high relative density (compact density / theoretical density). The effect of compaction pressure on the compaction ratio (relative density) of the compacted products was studied. Figures 1 and 2 show the variation in green density and relative density with the compaction pressure. As showed in Fig 1, increasing of the compaction pressure leads to increasing the green density. This can be attributed to the fact that the powder under compaction pressure is subjected to the force that contributes in plastic flow which increases the compact density. The space between particles decreases therefore without any deformation in the particle shape. The deformation force tries only to overcome frictional force on the contact faces.
The relative density defined as the ratio between the actual and the theoretical density of the composites. From Fig. 2, the 5 wt% of graphite and with 350 MPa gives the higher relative density (90 %). Because the actual density increases with increasing of compaction pressure and the th eoretical density is constant for the same composition. This will lead to increasing relative density with increasing in the compaction pressure. This may explain later why the 5% graphite with copper is the best sample according to the wear resistance.
Fig. 1. Effect of the compaction pressure on the green density of copper graphite composites of the samples with different amount of graphite.
Fig. 2. Effect of the compaction pressure on the relative density of copper graphite composites of the samples with different amount of graphite.
The effect of the graphite mass contents in the composites on the green density is shown in Fig. 3. As it can be seen, increasing in the graphite content leads to decrease the green density. This can be attributed to the fact that mixing a low density (graphite) material with a high density one (copper) causing more decrease in the density of the high density material.
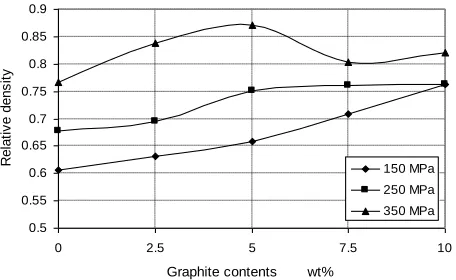
The effect of the graphite mass contents in copper-graphite composites on the relative density was shown in Fig. 4. As showed, increasing in the graphite content will lead to increase the relative density (at any compaction pressure). This can be attributed to the relationship of the relative density (compact density / theoretical density). The higher the graphite content, the lower the theoretical and measured density of the composites. But the decrease in the theoretical density which is the denominator of the relative density equation (measured density/ theoretical density) is bigger than the decrease in the theoretical density.
0.5 0.55 0.6 0.65 0.7 0.75 0.8 0.85 0.9
0 2.5 5 7.5 10
Graphite contents wt%
R
e
la
ti
v
e
d
e
n
s
it
y
150 MPa 250 MPa 350 MPa
0 0.2 0.4 0.6 0.8 1 1.2 1.4 1.6 1.8
0 2.5 5 7.5 10
Graphite content wt%
W
e
a
r
lo
s
s
g
r
900 C 950 C 1000 C
35 40 45 50 55 60 65 70 75
0 2.5 5 7.5 10
Graphite content wt%
H
a
rd
n
e
s
s
H
V
900 C 950 C 1000 C
150 250 350 450 550 650 750
0 2.5 5 7.5 10
Graphite content w t%
C
o
m
p
re
s
s
iv
e
s
tr
e
n
g
th
M
P
a 900 C
950 C
1000 C
0.2 0.3 0.4 0.5 0.6 0.7 0.8 0.9 1
0 2.5 5 7.5 10
Graphite content wt%
T
ru
e
st
ra
in
ε
900 C 950 C 1000 C
Fig. 4. Relationship between the graphite content wt% and the relative density of copper graphite composites (with constant composition)
Three sintering temperatures were used to determine the effect of the sintering temperature on wear resistance and mechanical properties. The results are plotted in Fig s. 5 and 6.
In Fig. 5, rising of the sintering temperature reduces the range of wear rate. This is because of good bonding of particles in case of high temperature. This bonding will improve the resistance of the composites to adhesive wear. And its known that increasing the sintering temperature leads to increase the density of the composites which has positive action on a lot of properties.
Figure 6 shows that the higher the sintering temperature the higher the surface hardness of the samples. This is due to the same reason of the good bonding between the particles of the composites in the high sintering temperature. Also, it was observed that with increasing the graphite content in the copper graphite composite the surface hardness decrease. This is due to the low hardness of the graphite. Increasing graphite makes the ability of the indenter of the test rig to hit the graphite particles increases, so the overall reading will be decrease with increasing graphite content. As temperature increases, the two adjacent particles begin to form a good bond by diffusion in a solid -state bonding process, so, the strength, density, ductility, and thermal and electrical conductivities of the compact increases. This good bonding between the particles of the composites in the high sintering temperature is the reason the improvement in the compressive strength and the true strain.
Fig. 5. Relationship between sintering temperature (wt%) and the wear losses (at different graphite contents)
Fig. 6. Relationship between graphite contents (wt %) and the hardness (at different sintering temperature)
Fig. 7. Relationship between graphite contents (wt %) and the compressive strength (at different sintering temperature)
0 0.2 0.4 0.6 0.8 1 1.2
150 200 250 300 350
Compaction pressure MPa
W
e
a
r
lo
s
s
g
r
2.5 % graphite 5 % graphite 7.5 % graphite 10 % graphite pure copper
0 0.2 0.4 0.6 0.8 1 1.2
0 2.5 5 7.5 10
Graphite percentage
W
e
a
r
lo
s
s
g
r
150 MPa 250 MPa 350MPa
30 40 50 60 70 80 90
150 200 250 300 350
Compaction pressure MPa
H
a
rd
n
e
s
s
H
V
pure copper 2.5% graphite 5% graphite 7.5% graphite 10% graphite Fig. 7 and 8 show that increasing of the sintering
temperature increases the range of the compressive strength and the true strain for all of copper graphite composites. Pin on disc test was carried out for the composite samples to determine the effect of the graphite contents on the wear resistance. Figures 9 and 10 show the influence of compacting pressure and the graphite contents on the wear rate.
Figure 9 shows that increasing compaction pressure improves the wear resistance for the samples with 2.5 and 5 wt% of graphite. In case of 7.5, 10 wt% of graphite, the wear loss firstly increases with increasing compaction pressure. Increase of graphite content over 5 wt% makes it working as insulation between copper particles and this leads to decrease wear resistance of the composites. After that, more increasing of compaction pressure leads to decrease of mass loss slightly.
Fig. 9. Effect of compaction pressure on the wear resistance of the copper graphite composites
Fig. 10. Effect of graphite contents on the wear resistance (in copper graphite composites).
Figure 10 shows that increasing graphite contents up to 5 wt% improves wear resistance of composite. Before 5 wt% graphite content, graphite works as solid lubricant in the composites which will increase the wear resistance and decrease the friction coefficient (in general improve the tribological properties).
Increasing graphite contents over 5 % to 10 wt% of graphite, the wear loss increases at any compaction pressure. Increase of graphite content over 5 wt% makes it working as insulation between copper particles and this will weaken the bonds between the particles and this lead to decrease wear resistance of the composites.
Because of the limitations of using of copper in many engineering applications due to its lower wear resistance and hardness many trials aim to improving thes e properties. One object of this thesis is to investigate the effect of the process parameters on the hardness of the copper graphite composites in order to obtain the optimum conditions with respect to the hardness and consequently the wear resistance improvement. The effect of the compaction load and the mass percentage of the reinforcements are the main parameters in this investigation.
Hardness measurements were taken to investigate the optimum hardness value of the products due to the change in the process parameters. The hardness is measured on the cross-sectional area of the specimens, five points were taken and the mean value was obtained.
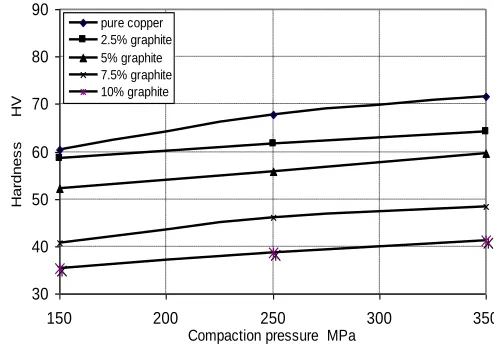
Figure 11 shows the relationship between the compaction pressure and the hardness number. Increasing compaction pressure will improve the surface hardness. The reason is that the higher the density, the higher will be the amounts of the solid metal in the same volume which causes more coherence of the particles, hence the greater its resistance to any external force.
Fig 11 Effect of compaction pressure on the hardness number (HV) with different graphite contents.
30 35 40 45 50 55 60 65 70 75
0 2.5 5 7.5 10
Graphite contents wt%
H
a
rd
n
e
s
s
H
V
150 MPa 250 MPa 350 MPa
0 100 200 300 400 500 600 700 800
0 2.5 5 7.5 10
Graphite contents wt %
C
o
m
p
re
s
s
iv
e
s
tr
e
n
g
th
M
P
a
150 MPa 250 MPa 350 MPa
0 100 200 300 400 500 600 700 800 900 1000 1100 1200
150 200 250 300 350
Compaction pressure MPa
C
o
mp
re
ssi
ve
st
re
n
g
th
MPa
pure cu 2.5% graphite 5% graphite 7.5% graphite 10% graphite
0.88 0.9 0.92 0.94 0.96 0.98 1 1.02 1.04 1.06
0 2.5 5 7.5 10
Graphite contents wt%
Vo
lu
m
e
ra
ti
o
150 MPa 250 MPa 350 MPa Fig. 12. Effect of graphite contents (in copper graphite composites) on the
hardness number (HV) with different compaction pressures.
Compression test was carried out for all composites to determine the effect of the additives (graphite, graphite with zinc, or graphite with lead) on the compressive strength of copper. The compressive strength and the true strain were calculated to determine the effect of the graph ite contents (in copper graphite composites) on the formability of the sintered composites. The results obtained were plotted in Figs. 13 and 14.
Figure 13 shows the relationship between graphite content (in copper graphite composites) and the compressive strength. Increasing graphite content leads to decrease compressive strength at any compaction pressure. This is because adding graphite to the composites increases the brittleness of the composites which causes quick failure.
Figure 14 shows the relationship between compaction pressure and the compressive strength (in copper graphite composites). Increasing compaction pressure leads slightly to increase the compressive strength at any compaction pressure. This is because the higher the compaction pressure the higher the density of the composite, and increasing the density lead to more solid particles in the same volume which leads to increase the composite resistance to the compressive stress and mechanical properties in general.
Fig. 13. Relationship between the graphite contents and the compressive strength.
Fig. 14. Relationship between the compaction pressure and the compressive strength of copper graphite composites.
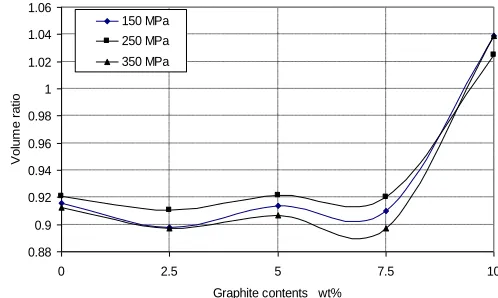
The data of the dimensional response of the compo site to sintering temperature was plotted in Fig. 15. For increasing graphite contents up to 7.5 wt%, shrinkage was observed and this was expected, but, for 10 wt% graphite in the composite and at any compaction pressure, swelling has been simply observed. That may be explained by increasing graphite content to this range and with high temperature a carbon monoxide (CO) gas will formed and expanded to increase the volume of the sintered composite.
Effect of adding amount of lead (0.5, 1, and 1.5 wt %) to copper graphite composite containing 2.5 or 5 wt% graphite on the wear resistance and the mechanical properties of the composite was determined. The results were plotted in Figs. from 15 to 18.
Fig. 15. Relationship between the graphite conten ts and the volumetric response to sintering temperature for all graphite contents.
From Fig. 16, it can be clearly observed that increasing the lead contents in the composite slowly reduces the wear rate or it can be paraphrased by increase the wear resis tance. This is due to the high density of the lead. Increasing the content of lead in the composites increase the composite density and so increasing the relative density. The relative density improvement has a good effect on the general properties of the composites. Also, lead has good tribological properties, so the wear resistance increases with increasing lead content.
0.06 0.08 0.1 0.12 0.14 0.16 0.18
0 0.25 0.5 0.75 1 1.25 1.5
Lead content wt%
W
e
a
r
lo
s
s
g
r
2.5 wt% graphite 5 wt% graphite
50 55 60 65 70 75
0 0.25 0.5 0.75 1 1.25 1.5
Lead contents wt%
H
a
rd
n
e
ss
H
V
2.5 wt% graphite 5 wt% graphite
400 450 500 550 600 650 700 750
0 0.25 0.5 0.75 1 1.25 1.5
Lead content wt%
C
o
m
p
re
s
s
iv
e
s
tr
e
n
g
th
M
P
a 2.5 wt% graphite
5 wt% graphite
0.755 0.760 0.765 0.770 0.775 0.780 0.785 0.790
0 0.25 0.5 0.75 1 1.25 1.5
Lead contents wt%
T
ru
e
s
tr
a
in
(ε
)
2.5 % graphite 5 % graphite
0.05 0.07 0.09 0.11 0.13 0.15 0.17 0.19
0 0.25 0.5 0.75 1 1.25 1.5 Zinc contents wt%
W
e
a
r
lo
ss
g
r
2.5 w t% graphite 5 w t% graphite
density of the composite and due to the good tribological properties of the lead particles. Also, the melting point of lead is 327 oC, so when the temperature of the composites reaches 1000 oC the lead particles melt to form liquid phase sintering.
In liquid phase sintering, one particle melted and, because of surface tension, surrounds the particles that have not melted. In this case, stronger and denser parts can be obtained.
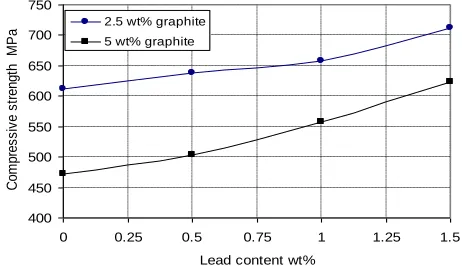
For the reason of the liquid phase sintering which formed, the bonding between the particles is strong and the density of the composite rise. So, it was observed that increasing lead contents in the composite increases the compressive strength and true strain and that is shown in Figs. 18 and 19 respectively.
Fig. 18. Relationship between lead contents (wt %) and the compressive strength (at constant compaction pressure of 350 MPa)
Fig. 19. Relationship between lead contents (wt %) and the true strain (at constant compaction pressure of 350 MPa)
Fig. 16. Relationship between lead contents (wt %) and the wear rate (at constant compaction pressure of 350 MPa)
Fig. 17. Relationship between lead contents (wt %) and the surface hardness (at constant compaction pressure of 350 MPa)
Effect of adding amount of zinc (0.5, 1, and 1.5 wt %) to copper graphite composite containing 2.5 or 5 wt% graphite on the wear resistance and the mechanical properties of the composite was determined. The results were plotted in Figs. of 20 to 22.
From Fig. 20, it can be clearly observed that increasing the zinc contents in the composite reduces the wear rate or it can be paraphrased by increase the wear resistance. This is due to the good tribological properties of the zinc particles. Also, the high density of zinc was a reason for the improvement observed in the wear resistance. Increasing the content of zinc in the composites increase the composite density and so increasing the relative density. So, a good effect on the general properties of the composites was observed.
Figure 21 shows the relationship of the zinc contents to the hardness of copper graphite with zinc composites. From this Figure, it can be clearly observed that increasing the zinc contents in the composite increases the hardness. This is due to the high density of zinc which increases the mixture density of the composite and due to the good tribological properties of the zinc particles. The melting point of zinc is 419 oC, so when the temperature of the composites reaches 1000 oC, zinc particles melted to form liquid phase sintering.
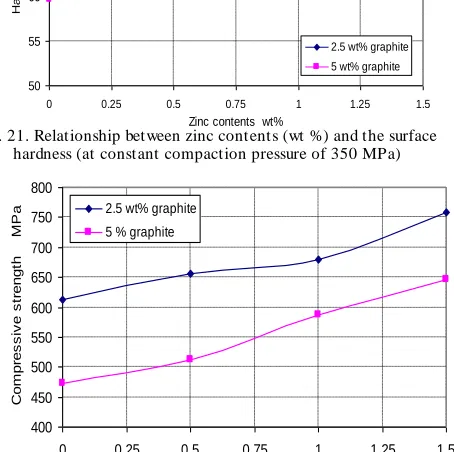
In liquid phase sintering, stronger and denser parts can be obtained. No shrinkage accrued because of the constant center distance between the particles. The melted particles surround the other particles and prevent the other particles from interference so, the center distance remains constant. For the reason of the liquid phase sintering which formed, it was observed that increasing zinc contents in the composite increases the compressive strength and that was showed in Figure 22. . The bonding between the particles is strong and the density of the composite rise zinc contents increasing.
50 55 60 65 70 75
0 0.25 0.5 0.75 1 1.25 1.5
Zinc contents wt%
H
a
rd
n
e
s
s
H
V
2.5 wt% graphite 5 wt% graphite
400 450 500 550 600 650 700 750 800
0 0.25 0.5 0.75 1 1.25 1.5
Zinc contents wt%
C
o
m
p
re
s
s
iv
e
s
tr
e
n
g
th
M
P
a 2.5 wt% graphite 5 % graphite
Fig. 21. Relationship between zinc contents (wt %) and the surface hardness (at constant compaction pressure of 350 MPa)
Fig. 22. Relationship between zinc contents (wt %) and the compressive strength (at constant compaction pressure of 350 MPa)
4. CONCLUSIONS
For copper graphite composites:
1)
increase of compaction pressure increased the relative density of both green and sintered parts and increased the mechanical properties. The higher the sintering temperature, the higher the wear resistance and the mechanical properties. For low graphite contents, the particles of copper are coherent and with adding more graphite, the graphite particles act as insulation to the copper particles. So the mechanical properties and wear resistance are reduced. Specimen shrinkage increases with increasing sintering temperature. But, for copper graphite composite with 10 wt% graphite, swelling has been clearly observed. This is due to the fact that increasing graphite content to this range and with high temperature a carbon monoxide (CO) gas will formed and expanded to increase the volume of the sintered composite.2)
With increasing the graphite contents up to 5 wt% the wear resistance increased. But with increasing the graphite content to 10 wt % the wear resistance decreased again. Compressive strength, true strain, and hardness of copper graphite composites decreased with increasing the amount of graphite.3)
For copper- graphite composites with lead or zinc, with addition of zinc and lead to the composites, the wear rate decreased, the mechanical properties increased,surface hardness, compressive strength, and true strain increases with lead or zinc addition.
REFERENCES
[1] A. Yeoh, C. Persad, and Z. Elieze, Dimensional Responses of Copper-Graphite Powder Composites to Sintering, Scripta Matcrialia, Vol. 37, No. 3, pp. 271 -277, 1997.
[2] J. M. Casstevens, H.G. Rylander, Z. Eliezer, Wear 48 121 -130, 1978.
[3] F. F. O. Orumwense, B.A.Okorie, E. O. Okeakpu, E. N. Obiora, and L. I. Onyeji, "Sintered copper-graphite powder compacts for industrial applications", Powder Metallurgy, vol. 44, 62-68 2001. [4] R. A. Elinn, P. K. T rojan, "Engineering Materials and their application", fourth edition, Houghton Mifflin, Boston, USA, 1992.
[5] M. M. Dewidar, and J. K. Lim, "Effect of graphite addition and processing parameters on the properties of copper by high frequency induction heated sintering process". Proceedings of International Conference for Mechanical and Automotive T echnologies, South Korea, pp. 261 -266, 2006.
[6] Yeoh, C. Persad, Z. Eliezer, "Dimensional responses of copper -graphite powder composites to sintering", Scripta Materialia, vol 37, No 3, pp.271-277, 1997.
[7] M. Kestursatya , J.K. Kim , P.K. Rohatgi , "Wear performance of copper-graphite composite and a leaded copper alloy", Materials Science and Engineering, A339, pp. 150 -158, 2003. [8] C.Y. T am, C.H. Shek "Abrasive wear of Cu60Zr30T i10 bulk
metallic glass" Materials Science and Engineering A 384, 138 – 142, 2004.
[9] S. F. Moustafa, S. A. El-Badry, A. M. Sanad, B. Kieback, Friction and wear of copper–graphite composites made with Cu-coated and unCu-coated graphite powders, Wear, 253, pp. 699-710, 2002.