Abstract—An experimental study has been carried out to investigate the structural behavior of beam which was strengthened by glass fiber reinforced polymer (GFRP-S). The Experimental was carried out to determine the effect of fatigue loads on flexural capacity of reinforced concrete beams. Each specimen was 6 m long with 300x500 mm rectangular cross section. Each specimen was treated with different loads. In this study using two different loads applied to the beam was static loads and fatigue loads. Static load was applied to the beam (B1) without GFRP reinforcement, a beam control. (A2) applied static load beam with GFRP reinforcement. Fatigue load applied to the beam reinforced with GFRP (B2) as well. For (A1) beam load was applied to the ultimate strength after reached 51.84 kN load, and then the concrete beams was strengthened with GFRP and fatigue loading until crushed. The result of this research showed that deflection under fatigue loads was higher than deflection of static loads. GFRP reinforcement showed an increase in the capacity of the test beam. The Increase of the power of static loading with GFRP reinforcement of 4.4%. The increase in the fatigue strength of 75 kN was 4.7%, the imposition 167.5 kN was 4.2%, and the imposition 260 kN was 2.9%.
Index Terms—Fatigue loads, GFRP-sheet, strengthening.
I. INTRODUCTION
Retrofitting of in reinforced concrete construction becomes very important, especially in structures that have experienced a decrease in strength. On Highway bridge, load the vehicle within a certain time can cause micro cracks, crack propagation and eventually failure if the circumstances of fatigue limit state is exceeded. However, in offshore structures, the existing of environmental burden is mainly due to cyclic wave loads and also because of structure itself that happened continuously. Therefore, it is necessary to analyze structural fatigue due to cyclic and continuous loads on structure.
Many other previous researchers used FRP. One of them is Sobhy et al., Their result showed that the use of CFRP sheets for strengthened RC beams that are experiencing steel reinforcement corrosion is an efficient technique that can maintain the structural integrity and enhance the structural behavior of such beams [1]. Sherif et al. describes an analytical model for simulating the static response and accelerated fatigue behavior of reinforced concrete beams
Manuscript received April 15, 2014; revised June 19, 2014. This work was supported financially by the Directorate of Higher Education of Indonesia.
The authors are with the Civil Engineering Department of Hasanuddin University, Makassar, South Sulawesi, Indonesia (e-mail: [email protected], [email protected], [email protected], [email protected]).
strengthened with CFRP laminates [2]. Toutanji and Balaguru conducted an experimental study on the performance of concrete columns wrapped with carbon and glass FRP composite sheets subjected to wet-dry and freeze-thaw conditions. In the case of freeze-thaw exposure, both CFRP and GFRP wrapped specimens’ experienced significant reductions in strength and ductility [3]. Teng and Chen reported the results of study addresses from three issues: first, classification of the bonding failure modes; second, mechanisms and processes of the bonding failures; and third theoretical models for the bonding failures [4]. Elkenel et al., conducted a research by using five beams which are tested under fatigue loading for two million cycles. All of beams survived fatigue testing. The result showed that the use of anchor spikes in fabric strengthening increase ultimate strength and mechanical fasteners can be an alternative to epoxy bonded laminate systems [5]. So, from all of references above, it is clear that there is a need to develop the study on ruptured concrete beams strengthened by using GFRP – S.
Fig. 1. Glass fiber reinforced polymer sheet (GFRP-S).
II. SPECIMEN AND SETUP TEST
A. Specimens
Fig. 2 shows the detail of the test specimen. There are four specimens reinforced concrete beam that tested. Each of specimens has a length of 6.00 m with 300 x 500 mm rectangular cross section that strengthened by GFRP – S. First type as a test control of beam object, second type is static loading with GFRP variation, and the last type is burdened with the static loading and fatigue loading. Table I presents the material properties of the concrete at the 28th day is 35.85 MPa. The rupture strength of concrete is 3.3 MPa.
TABLEI:MATERIAL PROPERTIES OF CONCRETE
Items Glass Fiber Compressive Strength (MPa) 35.85
Modulus Young (GPa) 22.14 Rupture Modulus fr (mm) 3.3
Table II shows the GFRP has a tensile strength of 575 MPa with elastic modulus of 26.1 GPa (Fig. 1). Table III shows
Ultimate Experiment of Ruptured Concrete Beams
Strengthened Using GFRP-Sheet after Fatigue Loads
material properties of steel. Table IV shows the material properties of the manufacture of epoxy resin respectively. The GFRP used in this study is composed by epoxy resin.
TABLEII:MATERIAL PROPERTIES OF GFRP
Items Glass Fiber Tensile strength (MPa) 575
Modulus Young (GPa) 26.1 Laminate Thickness (mm) 1.3
TABLEIII:MATERIAL PROPERTIES OF STEEL
Steel Diameter
fy MPa
fymax MPa
s ES MPa
Φ 10 385.40 500.35 0.00193 200000 D 22 453.80 540.80 0.00227 200000
TABLEIV:MATERIAL PROPERTIES OF EPOXY RESIN
Items Properties Tensile strength (MPa) 72.4
Modulus Young (GPa) 3.18 Bending Strength* (MPa) 2.12
* Based on the tensile test
(a). Specimen with static load and non GFRP-S (B1, speciment controls).
(b). Specimen with static load and fatigue with effective GFRP-S (A1).
(c). Speciment with static load with full GFRP-S (A2).
(d). Specimen with fatigue load and full GFRP-S (B2).
Fig. 2. Detail of specimens.
B. Setup Test 1) Static load
The test of static load is conducted as shown in Fig. 2. Two load points symmetrically have a distance 150 cm and both of them also have a distance 200 cm from the tip of concrete beam. Loading is done with hydraulic jack and load cell. To determine the deflection that occurs, the beam is installed with three LVDT (Linear Variable Displacement Transducer). One of LVDT is placed on the center span and the remained is placed under each load. The deflection and loading were measured using a load cell and LVDT.
2) Fatigue load
Theoretically, the principle of load position that used in static load is the same with fatigue load. For fatigue load the frequency is set on 1.25 Hz. This specimen failed when 1.000.000 cycles is reached. The lower and upper limits of fatigue loading were chosen to be approximately 17% and 60% of the nominal ultimate static strength of the control specimen. To measure the concrete strain, three strain gauges are installed (Fig. 2). for measuring the tensile strain, strain gauge is installed on the steel reinforcement and GFRP-S. Additional data load, deflection, and strain are recorded by the data logger. Imposition of the test will be stoped if the object has collapsed and reading from the load cell data logger stops
III. RESULT AND DISCUSSION
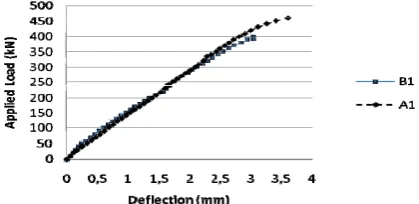
In Fig. 3 when the load is achieved 50.00 kN, the graphic at specimen B1 is linear. From the graph indicated that the large deflections that occur in B1 are greater than the deflection in A1, it happens due to the influence of GFRP-S.
Fig. 3. Curve load vs. deflection of specimen B1 and A1.
result is very small, because the load is still below capacity of concrete tensile. Reinforcement tensile in specimen test was using 2 parts as shown in Fig. 2.
Fig. 4. Curve load vs. strain of speciment B1.
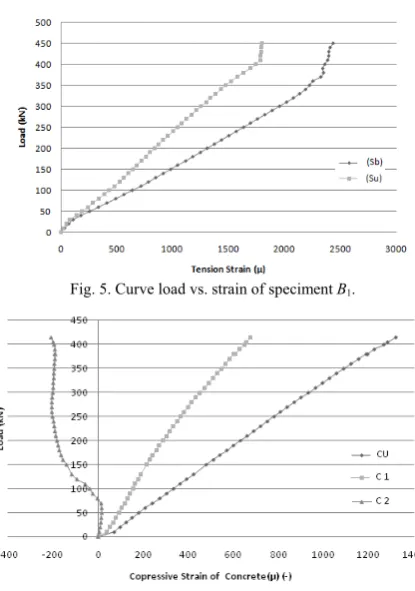
Fig. 5. Curve load vs. strain of speciment B1.
Fig. 6. Curve load vs. strain of speciment A1.
Fig. 7. Load vs. strain curve of speciment A1.
Test on specimen A1 is started without strengthening of GFRP–S, with aim to achieve the failure condition. One of characteristic that analyzed is the strain and load. Fig. 6 explains the load versus strain concrete. When the load is
achieved 415.00 kN, strain in Cu is 1321 μ, C1 is 676 μ and C2 is -207 μ. For the reinforce steel the result is – 2131 μ in Sb and -271 μ in Su which is can be seen in Fig. 7. Both in Fig. 6 and 7 yield of the reinforcement.
Fig. 8. Curve load vs. strain of speciment A1 on GFRP-S.
Fig. 9. Curve load vs. strain of speciment A1 on GFRP-S.
Fig. 10. Curve load vs. strain GFRP-S of speciment A1.
Fig. 11. Curve load vs. crack of speciment A1 on GFR-S.
For the behavior of strain gauge can be seen in Fig. 10. In this test, crack reading is conducted in point of maximum crack reading in normal specimen before test. Fig. 11 shows the pattern of crack propagation. In the observation of the test, it showed that the pattern of crack propagation without GFRP and strengthened by GFRP does not have a significant impact, it means that GFRP can reduce fracture pattern that occur on the collapse condition in beam test.
Fatigue test performed on the specimen B2 with a recurring expense testing is shown in Fig. 2 (d). In this test, the LVDT is placed in the middle of the specimen test. Readings based on repeated load cycles by using frequency of 1.25 Hz. The beam is failure when the fatigue load is located in 1.000.000 cycles.
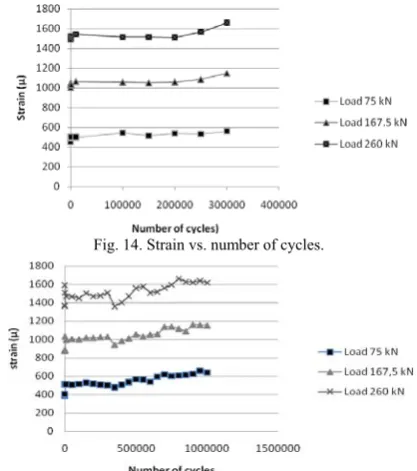
Load specifications that is taken manually minimum point = 75.00 kN, middle point = 167.50 kN, and maximum point = 260.00 kN. Fig. 12 and Fig. 13 show the relationship between deflection and number of cycles at failure condition. The result of experimental in above, shows the comparison of deflection from static load and fatigue load.
TABLEV: DEFLECTION OF STATIC LOAD AND FATIGUE WITH NON
GFRP-STEST RESULT
No Aplied load (kN)
Deflection Static Load A2
(mm)
Fatique Load B2
(mm) 1 75.00 4.50 21.69 2 167.50 11.00 32.10 3 260.00 19.25 40.61 TABLEVI:DEFLECTION OF STATIC LOAD AND FATIGUE WITH GFRP-S
TEST RESULT
No Aplied load (kN)
Deflection Static Load A2
(mm)
Fatique Load B2
(mm) 1 75.00 4.34 16.77 2 167.50 10.50 28.38 3 260.00 18.04 36.83
Fig. 12. Deflection vs. number of cycles.
Fig. 13. Deflection vs. numbr of cycles.
Tired condition that happened in specimen is inconstant. There is a huge differentiation between static load and fatigue load. The conclusion of those results can be seen in table V and VI below.
Fig. 14 and Fig. 15 show a pattern of behavior in the tensile reinforcing steel or reinforced concrete specimen. Increasing the number of load cycles with a fixed frequency is increase in strain. To stretch the steel itself does not cause damage to the beam test brittle, but at the conclusion of steel strain values will increase with increasing number of cycles and greater than the static loading.
Conditions fatigue test specimen was clearly visible on the concrete conditions on the incidence of cracking in the loading process. The addition of loading cycles looks very influential in the test beam damage on the concrete surface to the horizontal crack on the side of the press beam test [6].
Fig. 14. Strain vs. number of cycles.
Fig. 15. Strain vs. number of cycles.
IV. FAILURE MECHANISMS
The result obtained in the initial crack by theoretical analysis was 51.84 kN and these things became the standardization of how to install pie gauge. After Pie Gauge installed, then it must be loaded continuously until the condition of stress maximum is obtained. 33.08 mm is the deflection that appeared when plastic limitation achieved. Three parts of maximum crack were analyzed. The first part is 0.607 mm in P1; the second part is 0.704 mm in P2 and the last part is 0.607 mm in P3. Of the theoretical, maximum crack is located in 0.607 mm. The pattern of cracks that occur in specimen A1 can be seen in Fig.16 and Fig. 17.
Specimen A2.
Specimen B2.
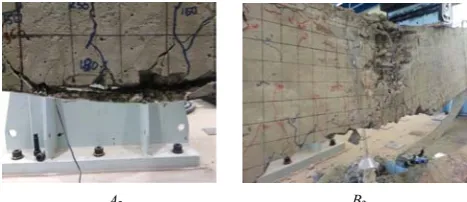
In this experiment, the beam runs into flexural crack condition. It can be seen from the pattern of cracks that move vertically to the longitudinal axis of the beam. With the increasing of initial crack load that happen will be more widening and longer towards the neutral axis means the stiffness of beam is reduce. Crack propagation is used to identify the speed of crack propagation velocity at the beam. Crack pattern in specimen A2 and B2 can be seen in Fig. 16.
Fig. 17. Photograph of the failed specimens in A2 and B2.
V. CONCLUSION
From the experiment, it can be concluded that:
1) The deflection under fatigue loads is higher than deflection of static loads. After strengthened by GFRP-S, the capacity of concrete beam increased 4.4%. The increase in the fatigue strength of 75 kN was 4.7%, the imposition 167.5 kN was 4.2%, and the imposition 260 kN was 2.9%.
2) The pattern of crack that resulted from static load that occur in middle of reinforced concrete beams that strengthened by GFRP was flexural cracks.
3) In the fractured beam, the addition of GFRP was able to slow down the collapse of beams.
ACKNOWLEDGMENT
Thanks and appreciation for the magnitude of the PT. Graha Anugerah Citra Lestari who have contributed GFRP type SEH51 on our research, to PT. Pelindo IV, Makassar Port Authority, which has helped the students in this study as well as the staff Structures and Materials Laboratory of the Department of Civil Engineering, Faculty of Engineering, Hasanuddin University.
REFERENCES
[1] S. Masoud, K. Soudki, and T. Topper. “CFRP-Strengthened and corroded RC Beams under monotonic and fatigue loads,” Journal of Composites for Construction, vol. 5, no. 4, ASCE, November 2001. [2] S. El-Tawil, C. Ogune, A. Okeil, and M. Shahawy, “Static and fatigue
analyses of RC beams strengthened with CFRP laminates,” Journal of Composites for Construction, vol. 5, no. 4, ASCE, November 2001. [3] H. Toutanji and P. Balaguru, “Durability characteristics of concrete
columns wrapped with FRP tow sheets,” Journal of Materials in Civil Engineering, vol. 10, no. 1, ASCE, February, 1998.
[4] J. G. Teng and J. F. Chen, “The bonding failures of RC beams strengthened with externally bonded FRP reinforcement: Behavior and modeling,”presented at Asia-Pasific Conference on FRP in Structures APFIS 2007.
[5] M. Ekenel, A. Rizzo, J. J. Myers, and A. Nanni, “Flexural fatigue behavior of reinforced concrete beams strengthened with FRP fabric and pressured laminate systems,” Journal of Composites for Construction, vol. 10, no. 5, ASCE, pp. 433-442, October, 2006. [6] M. B. Varma and R. S. Pujari, “Flexural strength of concrete beam
reinforced with GFRP rebar,” International Journal of Earth Sciences and Engineering, vol. 4, no. 6, pp. 994-996, October 2011.
Arbain Tata is a lecturer at the Department of Civil Engineering Khairun University, Ternate, North Maluku, and Indonesia. He was born on December 09, 1977, He received his BS from Hasanuddin University, MS from Hasanuddin University, Now, his is a doctoral student at the Hasanuddin university. He was awarded by some research grant such as: research grant from the ministry of the Indonesian Higher Education in 2009 and 2013.
B2