Abstract—The effect of solar drying on the quality of three species of vegetables is presented. These species are amaranthus (tete in local language), vernonia (ewuro) and fluted pumpkin (ugu). Proximate analysis and microbial load analysis were carried out on the vegetable samples after each day of drying for a total of 5 days. The solar irradiation for the period varied from 89 W/m2 to 203 W/m2. Both analyses show that the nutritional composition of the fresh vegetable and their microbial load decreases with each day of drying. To have maximal nutritional values from vegetables, it is best to consume them fresh. However, for storage purposes, two days of drying is sufficient to prevent spoilage and at the same time retain an average 70% of fat, 80% ash, 70% carbohydrate, and 60% protein of their initial nutritional composition.
Index Terms—Drying, Nutrition, Quality, Solar, Vegetables.
I. INTRODUCTION
Green leaf vegetables constitute an indispensable constituent of human diet [1]. Some of these green leaf vegetables are Amaranths, known as aliefo (in Hausa), tete (in Yoruba), Inise (in Ibo), Celosia (celosia argentea), locally known as sokoyokoto, Bitter leaf (Vernonia species) also locally called ewuro, Corchurus species ( ewedu, krinkrin), Sorrel (isapa), Talinum species (gure), Fluted pumprin (Ugu), Basella ( amunu-tutu ). In Africa, they are consumed as cooked complements to the major staples, like cassava, cocoyam, guinea corn, maize, millet, rice and plantains. Many of these leaf vegetables are common in all parts of Nigeria, but some are restricted in their natural distribution because of climatic factors. There are more readily available during the raining season.
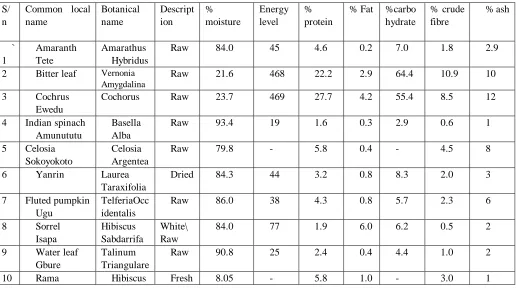
The nutritional values of some of these vegetables are shown in Table I [2]. These vegetables if not preserved within few days after harvest will begin to decay. In an attempt at preserving these vegetables from being decayed, drying as one of the oldest methods of food preservation is often used. However, drying like all methods of preservation, often result in loss of some nutrients. Nutritional changes that occur during drying according to [3] include the followings:
Caloric content: does not change, but is concentrated into a
Manuscript received April 2, 2009.
Awogbemi Omojola (Corresponding author) is with University of Ado Ekiti, Nigeria. Phone no. is +2348033550582;
Ogunleye I. Olusola is with the University of Ado Ekiti, Nigeria.
smaller mass as moisture is removed. Fibre: no change
Vitamin A: fairly well retained under controlled heat methods.
Vitamin C: mostly destroyed during blanching and drying of vegetables.
Thiamin, riboflavin, niacin: some loss during blanching but fairly good retention if the water used to dehydrate also is consumed.
Minerals: Some may be loss during dehydration if soaking water is not used. Iron is not destroyed by drying.
Many authors have worked on drying as a means of preserving agricultural products including vegetables and fruits for storage purposes [4] - [11]. There are many factors affecting the drying rate of the agricultural products. Among these factors, we have air temperature, the relative humidity and the air velocity and initial moisture content of the product. From literatures, the best range of temperature for drying fruits and vegetables is between 55 to 75oC. This falls within the range of the temperature obtained from the solar dryer used to carry out this experiment.
This research investigated the effect of drying on three species of vegetable. The vegetable species are amaranthus (tete in local language), vernonia (ewuro), and fluted pumpkin (ugu). The samples were dried for three consecutive days using both the solar dryer and the direct sunlight drying. The proximate and microbial analyses were also carried out on the samples.
II. MATERIALSANDMETHODS
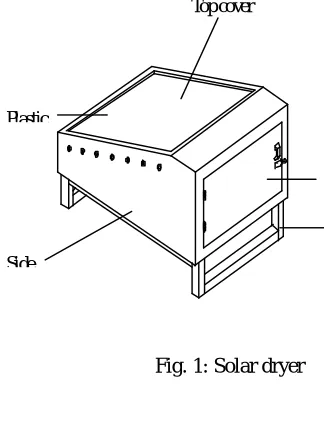
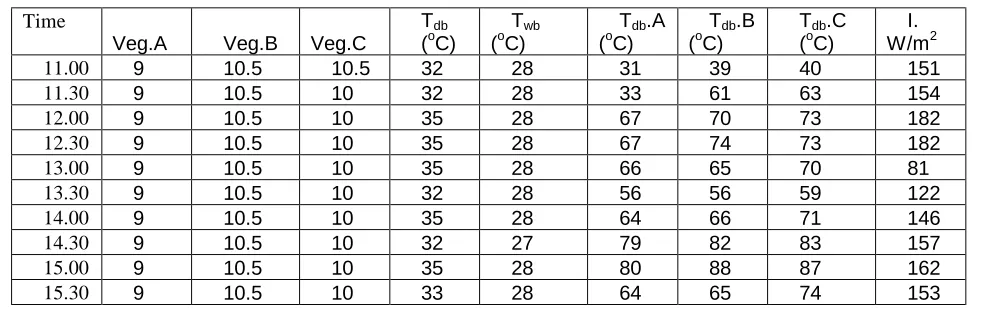
The 70 g of sliced samples of tete, ewuro and ugu vegetables were measured into individual trays and then dried using both solar dryer (shown in Fig. 1) and by direct sun radiation. A solar meter was used to monitor the solar radiation. The temperature within the solar dryer and the room temperature were monitored using thermocouple probes. At equal time interval of 30 minutes, the samples were withdrawn and measured using a digital weighing machine to monitor weight reduction due to loss of moisture in the samples. At the end of each day, the samples were taken to microbiology and chemistry laboratories for microbial load and proximate analyses respectively. These procedures were repeated for five consecutive days from 12 – 17th of September, 2006. The data obtained were recorded as shown in Tables II-VII.
The percentage moisture contents (%MC) of the samples
Effects of drying on the qualities of some
selected Vegetables.
410 at various drying time on dry basis was obtained from the expression. %MC =
100
×
−
d d iM
M
M
(1) WhereMi = mass of the sample at time i Md = mass of the dry solid
From the data obtained from (1), the moisture ratio versus drying time was plotted using a diffusion model [12] and it is shown in Fig. 2 for all the samples. From the free moisture versus time curve, the drying rate was obtained and plotted for all the samples as shown in Fig. 3.
Top cover
Side Plastic
Fig. 1: Solar dryer
III. RESULTS
IV.DISCUSSION
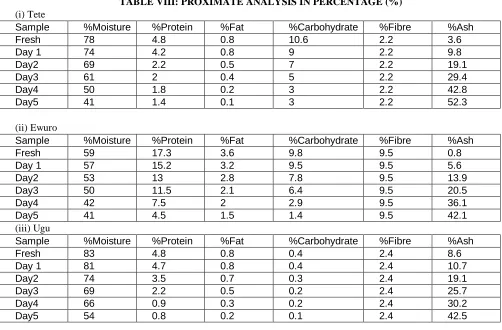
The Table VIII shows the proximate analysis carried out on each of the vegetables, which was dried for 5 days between the hours of 11 am to 3.30 pm. The following data’s were obtained, % moisture, % protein, % fat, % carbohydrate, % fibre, % ash. This data showed that, drying has effect on the nutritional composition of the various vegetables. The nutritional composition of the vegetables were been reduced due to the drying process. The Table 9 shows the result obtained when microbial load analysis were carried out on each of the vegetables. This result is used to monitor the result obtained from the proximate analysis. It shows that Ugu had the highest microbial load followed by Tete, with Ewuro having the least microbial load. It further reveals that microbial load was being reduced due to drying. The combination of these two results shows that drying as an effect on vegetables. So also from micro-biological knowledge, It tells us that the micro-organism present in the third day is not high enough to harm the body and also, shows that the vegetables can be preserved without been
spoilt. Figure 3 shows the drying rate of selected vegetable samples on the first day of drying. Vernonia spp (ewuro) has the highest drying rate, followed by Amaranthus spp (Tete) and fluted pumpkin (ugu).
0 1 2 3 4 5 6 7 8 9
0 50 100 150 200 250 300
Time in seconds
F re e m o is tu re Ewuro Tete Ugu
Fig. 2: Free moisture content versus drying time for three selected vegetable samples
0 0.01 0.02 0.03 0.04 0.05 0.06 0.07
0 1 2 3 4 5 6 7 8 9
Free moisture content
R a te o f d ry ing Ewuro Tete Ugu
Fig. 3: Drying rate of the selected vegetable samples on the first day of drying
V. CONCLUSION
The drying rate analysis of the three species of vegetable has been presented in this research. It showed that Vernonia spp (ewuro) has the highest drying rate, followed by Amaranthus spp (Tete) and fluted pumpkin (ugu) in that order. Proximate analysis and microbial load analysis were carried out on the vegetable samples after each day of drying for a total of 5 days. Both analyses showed that the nutritional composition of the fresh vegetable and their microbial load decreases with each day of drying. Percentage protein decreased with each day of drying, therefore to have maximum nutritional values from vegetables, it is best to consume them fresh. However, for storage purposes, irrespective of the species and quantity, two days of drying is sufficient to prevent spoilage and at the same time retain most of their nutritional composition.
ACKNOWLEDGMENT
course of this research. The efforts of Oke Salako John at collecting the data are appreciated.
REFERENCES
[1] Oguntona, T. and Oguntona C.R.B. Proximate Composition of three leafy vegetables Commonly in North-eastern Nigeria. M.Sc. (Biochemistry) Thesis University of Ibadan, Nigeria. 1985 (Unpublished).
[2] Anthony, U. Osagie and Eka,, Nutritional quality of plant food. MacDonald and Evans Limited, Plymouth.1988. Pp 56.
[3] Kendall, P., DiPersio, P and Sofos,J. 2006, Drying Vegetables. Available: http://www.ext.colostate.edu/PUBS/FOODNUT
[4] Food preservation. Available http://: www.ext.vt.edu/pubs/food [5] Methods of preservation, Available, http:// : www.earthlypursuits.com [6] Dryingoffruits.Available
http://hgic.clemson.edu/factsheets/HGIC3085.htm
[7] Preservingvegetables.Available :http://www.uga.edu/nchfp/how/dry/csu _dry_vegetables.pdf
[8] Bolin, T and Arnaud, U.R., Drying rate of fruits, Journal of Biological and Physical Sciences, vol. 3, 1975, Pp 2
[9] Brains, P.C and Alexander, R.C (1989), Important factors affecting drying process, Journal of Biological and Physical Science, vol. 3, 1989, Pp 6
[10] Fakeye, I. O, Nigerian leafy vegetable, African Jour. Science (1) 1999. Pp 55.
[11] Fohr, and Arnaud, Proximate analysis on Nigerian food. Journal of Biological and Physical Sciences, Vol 2. 1994.Pp 5
412
Table I: PROXIMATE COMPOSITION OF NIGERIA LEAFY VEGETABLE (Per 100g)
Table II: Solar drying data for all the three samples for day 1 on 12/09/06
Time
Veg.A Veg.B Veg.C
Tdb
(oC)
Twb
(oC)
Tdb.A
(oC)
Tdb.B
(oC)
Tdb.C
(oC)
I. W/m2
11.00 70 70 70 30 25 35 37 33 125
11.30 69.5 69 69 32 25 37 35 38 143
12.00 65 65.5 66 32 23 40 39 42 109
12.30 60 61 61.5 30 25 36 42 45 100
13.00 56.5 59 58 32 27 40 44 48 107
13.30 48.5 52.5 50 37 27 54 52 58 90
14.00 38.5 44.5 40 33 27 52 62 60 147
14.30 32 41 29 37 28 51 60 63 131
15.00 26.5 33 25 34 28 49 56 59 89
15.30 22 28 20.5 45 28 44 58 62 161
Table III: Solar drying data for all the three samples for day 2 on 12/09/06
Time
Veg.A Veg.B Veg.C
Tdb
(oC)
Twb
(oC)
Tdb.
A(oC)
Tdb.B
(oC)
Tdb.C
(oC)
I. W/m2
11.00 15.5 21.5 15 33 28 47 54 53 160
11.30 11.5 19 13 28 25 48 56 54 117
12.00 10 17 11.5 32 28 57 58 65 157
12.30 9 14 10.5 35 28 71 68 71 155
13.00 9 12.5 10.5 32 26 73 58 68 132
13.30 9 11.5 10.5 32 28 68 67 66 159
14.00 9 10.5 10.5 40 30 89 92 94 203
14.30 9 10.5 10.5 33 28 58 61 61 114
15.00 9 10.5 10.5 40 30 79 77 79 167
15.30 9 10.5 10.5 32 28 60 67 63 98
S/ n
Common local name Botanical name Descript ion % moisture Energy level % protein
% Fat %carbo hydrate
% crude fibre % ash ` 1 Amaranth Tete Amarathus Hybridus
Raw 84.0 45 4.6 0.2 7.0 1.8 2.9
2 Bitter leaf Vernonia Amygdalina
Raw 21.6 468 22.2 2.9 64.4 10.9 10
3 Cochrus Ewedu
Cochorus Raw 23.7 469 27.7 4.2 55.4 8.5 12
4 Indian spinach Amunututu
Basella Alba
Raw 93.4 19 1.6 0.3 2.9 0.6 1
5 Celosia Sokoyokoto
Celosia Argentea
Raw 79.8 - 5.8 0.4 - 4.5 8
6 Yanrin Laurea
Taraxifolia
Dried 84.3 44 3.2 0.8 8.3 2.0 3
7 Fluted pumpkin Ugu
TelferiaOcc identalis
Raw 86.0 38 4.3 0.8 5.7 2.3 6
8 Sorrel Isapa
Hibiscus Sabdarrifa
White\ Raw
84.0 77 1.9 6.0 6.2 0.5 2
9 Water leaf Gbure
Talinum Triangulare
Raw 90.8 25 2.4 0.4 4.4 1.0 2
Table IV: Solar drying data for all the three samples for day 3 on 12/09/06
Time
Veg.A Veg.B Veg.C
Tdb
(oC)
Twb
(oC)
Tdb.A
(oC)
Tdb.B
(oC)
Tdb.C
(oC)
I. W/m2
11.00 9 10.5 10.5 32 28 31 39 40 151
11.30 9 10.5 10 32 28 33 61 63 154
12.00 9 10.5 10 35 28 67 70 73 182
12.30 9 10.5 10 35 28 67 74 73 182
13.00 9 10.5 10 35 28 66 65 70 81
13.30 9 10.5 10 32 28 56 56 59 122
14.00 9 10.5 10 35 28 64 66 71 146
14.30 9 10.5 10 32 27 79 82 83 157
15.00 9 10.5 10 35 28 80 88 87 162
15.30 9 10.5 10 33 28 64 65 74 153
Note- Vegetable A =EWURO, Vegetable B = TETE, Vegetable C =UGU Tdb represents dry bulb temperature
Twb represents wet bulb temperature
Tdb represents temperature of each vegetable I w/m² represents Solar intensity
Table V: Direct sunlight drying data for all the three samples for day 1 on 12/09/06
Time Veg.A Veg.B Veg.C Tdb (oC) Twb (oC) I. W/m2
11.00 70 70 70 30 25 125
11.30 68 68 69 32 25 143
12.00 65 65.5 66 32 23 109
12.30 59 60.5 61 30 25 100
13.00 56 57 58 32 27 107
13.30 49 51 52 37 27 90
14.00 43 45.5 46.5 33 27 147
14.30 37.5 40 41 37 28 131
15.00 33.5 35.5 36.5 34 28 89
15.30 27.5 31 31 45 28 161
Table VI: Direct sunlight drying data for all the three samples for day 2 on 13/09/06 Time. Veg.A Veg.B Veg.C Tdb (oC) Twb (oC) I. W/m2
11.00 20.5 29.5 24 33 28 160
11.30 18 25.5 21 28 25 117
12.00 16 22 19 32 28 157
12.30 14 19 16 35 28 155
13.00 13 16.6 14.5 32 26 132
13.30 12 15 13.5 32 28 159
14.00 11 13.5 12.5 40 30 203
14.30 11 13 12 33 28 114
15.00 11 12.5 11.5 40 30 167
15.30 11 12.5 11.5 32 28 98
TableVII: Direct sunlight drying data for all the three samples for day 3 on 14/09/06
Time VegA VegB VegC Tdb (oC) Twb (oC) I. W/m2
11.00 10 11.5 11 32 28 151
11.30 10 11.5 11 32 28 154
12.00 10 11.5 11 35 28 182
12.30 10 10.5 11 35 28 182
414
13.30 10 10.5 11 32 28 122
14.00 10 10.5 11 35 28 146
14.30 10 10.5 11 32 27 157
15.00 10 10.5 11 35 28 162
15.30 10 10.5 11 33 28 153
TABLE VIII: PROXIMATE ANALYSIS IN PERCENTAGE (%)
(i) Tete
Sample %Moisture %Protein %Fat %Carbohydrate %Fibre %Ash
Fresh 78 4.8 0.8 10.6 2.2 3.6
Day 1 74 4.2 0.8 9 2.2 9.8
Day2 69 2.2 0.5 7 2.2 19.1
Day3 61 2 0.4 5 2.2 29.4
Day4 50 1.8 0.2 3 2.2 42.8
Day5 41 1.4 0.1 3 2.2 52.3
(ii) Ewuro
Sample %Moisture %Protein %Fat %Carbohydrate %Fibre %Ash
Fresh 59 17.3 3.6 9.8 9.5 0.8
Day 1 57 15.2 3.2 9.5 9.5 5.6
Day2 53 13 2.8 7.8 9.5 13.9
Day3 50 11.5 2.1 6.4 9.5 20.5
Day4 42 7.5 2 2.9 9.5 36.1
Day5 41 4.5 1.5 1.4 9.5 42.1
(iii) Ugu
Sample %Moisture %Protein %Fat %Carbohydrate %Fibre %Ash
Fresh 83 4.8 0.8 0.4 2.4 8.6
Day 1 81 4.7 0.8 0.4 2.4 10.7
Day2 74 3.5 0.7 0.3 2.4 19.1
Day3 69 2.2 0.5 0.2 2.4 25.7
Day4 66 0.9 0.3 0.2 2.4 30.2
Day5 54 0.8 0.2 0.1 2.4 42.5
TABLE IX: RESULT OF MICROBIAL LOAD ANALYSIS (cfu/g)
Sample/da
y Fresh Day 1 Day 2 Day 3 Day 4 Day 5