Abstract— Along with the progress in technical capabilities in recent years, many artifacts are becoming increasingly complicated. It is therefore necessary to conduct "unrestricted thinking" and "rational thinking" for the product design of large-scale artifacts. In order to support this form of design, the M method, based on the Multispace Design Model (M model) is proposed here. The M method is designing design methods based on the M model that can comprehensively address various design tasks. This method supports designers to derive design solutions by continuously repeating the processes of extracting, classifying, and associating the design elements. We extracted some problems of the M method by analyzing the questionnaire conducted in the design workshop of the M method held in 2013, and proposed the M method system by improving their solutions. Additionally, the applicability of the proposed M method system was verified through the questionnaire survey conducted in a design workshop. This study proposes the M method system delivered via computer in order to enable designers to employ the M method effectively in the design activity. In the proposed M method system, by digitizing sketching by paper and extraction work of design elements by handwritten memo, it is possible to perform all design processes in the M method on the M method system. Therefore, improvement of work efficiency is expected.
Index Terms— Multispace design model, multispace design method, M method system.
I. INTRODUCTION
Due to artifacts becoming generally larger and more complicated, the elements required for designing them are increasing steadily. The enormous number of design factors to be taken into consideration may lead to huge design requirements. Therefore, doing design thought bound by conditions may possibly lead to a local solution without novelty. It is said that in order to create novelty and a high degree of perfection in design, it is necessary to proceed bottom-up design based on idea generation and the top-down design development by analysis [1], [2].The KJ method [3], brainstorming method [4], and so on, can be cited as representative methods used for designing artifacts. Although these methods are appropriate for undertaking bottom-up design development based on idea generation, it is considered difficult to conduct top-down design development by analysis. Therefore, the M method is proposed as a method introducing the viewpoint of the multi-space design model to design development of both the bottom-up type idea and top-down
Manuscript received August 5, 2018; revised October 12, 2018. Daisuke Iseki and Shota Amabe are with the Graduate of Science and Technology, Keio University, Yokohama, Japan (e-mail: [email protected]; [email protected]).
Takeo Kato and Yoshiyuki Matsuoka are with the Faculty of Science and Technology, Keio University, Yokohama, Japan (e-mail: [email protected], [email protected]).
type analysis [5]-[7]. The M method is a design method based on a “Multispace Design Model” that can address various design acts comprehensively. In M method, design solutions can be derived by extracting design elements and repeating their classification and association. Here, extracting design elements means arranging design elements in each space of value, meaning, state, attribute, and circumstance included in the Multispace Design Model (M model). In the design using the M method, the designer fills design elements in paper medium (cards) such as sticky notes, and arranges them on a white board or large sheets of paper based on the viewpoint of multispace. However, it is hard to conceive of concretely and it is impossible to keep records with this method. On the other hand, research on the digitalization of design method by computer began in the 1980s, and significant research is currently being conducted. Specifically, research to digitize the KJ method is extensive, and typical examples include the KJ editor [8], D-ABDUCTOR [9], and the like. It has been shown that by digitizing the design method, it becomes easier to share images due to multimedia contents such as images and sounds and easier recording by computer. Therefore, by digitizing the M method, there is a possibility that the problem of the paper medium described above can be improved. In this study, we improved solutions to the above-mentioned problem by digitizing the M method which, until now, has relied on large sheets of paper and sticky notes Section 2 outlines the proposed M method. In Section 3, we describe the basic concept and operation procedure of the developed M method system. Section 4 describes the results and includes a discussion on the effectiveness verification of the developed system. Section 5 summarizes the results of this research and proposes issues for future study.
II. M METHOD
The M method is a design method that introduces the viewpoint of the “M model” into both design and analysis of ideas and analysis. This method supports the derivation of design solutions by introducing the brainstorming method, affinity method [10], and relation diagram [11] based on the M model. The brainstorming method is directed toward the generation of free and diverse ideas in various themes. The affinity projection method is a method for grouping highly compatible items among the listed items, and finding and sorting out problems. An associative drawing is a drawing method to clarify the structure of a problem by concatenating the relationship between cause and result, purpose and means, etc. with arrows for the purpose of arranging complicated intertwined problems [12]. The procedure of M method is to perform analysis and idea generation by repeating the following four steps using value space, meaning space, state space, attribute space, and circumstances.
Proposition of M Method System
TABLEI:MMETHOD BENEFITS
Step 1: Sampling of design elements
Keywords, pictures, sketches and etc. are used to sample design elements.
Step 2: Classification of design elements Sampled design elements are grouped together. Step 3: Structuration of design elements
Correlations are drawn among grouped design elements. Step 4: Breakdown and addition of design elements Correlations are re-examined; design elements are broken down and added to.
By advancing the idea generation based on these steps, design elements can be arranged in each space, making them easy to organize.
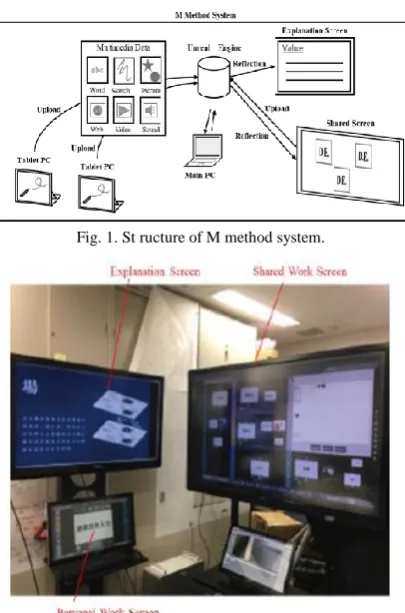
Fig. 1. St ructure of M method system.
Fig. 2. Appearance of M method system.
III. M METHOD SYSTEM
The configuration diagram of the M method system and the actual M method system are shown in Figs. 1 and 2, respectively.
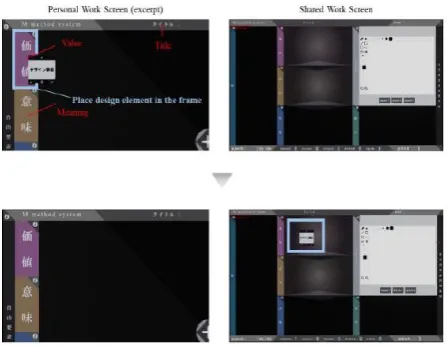
Fig. 3. Personal work screen.
Fig. 4. Shared work screen.
Fig. 5. Scene change on design element input.
Fig.7. Result of reflect ing the value elements from the personal work screen to the shared work screen.
This system comprises two screens with different functions and is assumed to be used by individuals or multiple persons. One is a "Personal Work Screen” (see Fig. 3) for extracting and categorizing design elements, and the other is a "Shared Work Screen” (see Fig. 4) for structuring and analyzing design elements. The two screens are connected via a network to realize the exchange of design elements.
The procedure of using this system is described below. Step 1: Extraction of design elements
In this step, the user extracts design elements on the Personal Work Screen. By pressing the plus button in the center of the screen, it becomes possible to input design elements (see Fig. 5).
Step 2: Selection of representation form of design elements The user selects the representation form of design elements from the selection button (see Fig. 6). Representation forms of selectable design elements include text, sketch, randomly displayed image, image searched on the web, moving picture, and sound.
Step 3: Classification of design elements
The user classifies the design elements into the space of value space, meaning space, state space, attribute space, and circumstance. In the Personal Work Screen, the results of classifying design elements on the Personal Work Screen are reflected on the Shared Work Screen. Fig. 7 shows the result of moving the value element from the Personal Work Screen to the Shared Work Screen.
Step 4: Listing of design elements
In the Shared Work Screen, the user lists the design elements extracted and classified by each participant.
Step 5: Grouping design elements
Grouping design elements by drawing lines on the Shared Work Screen in the discussion. Also, by pressing the Shared Work Screen for a long time, the drawing lines can be deleted.
Step 6: Structuration of design elements
Relation of grouped design elements are drawn by lines. Similarly, by pressing the Shared Work Screen for a long time, the drawing lines can be deleted.
Step 7: Breakdown and addition of design elements
Correlations are re-examined; design elements are broken down and added. In addition, design elements can be edited and deleted by pressing the Settings button on the Shared Work Screen.
Step 8: Realization of design
The user advances realization of the design in Steps 1 through 7 by drawing the idea sketch. The idea sketch can be drawn in the solution part of the Shared Work Screen. The color of the drawing pen and background can be changed freely, and basic figures such as circles and squares can also be arranged.
Fig. 8 shows an example of using the Shared Work Screen.
IV. VALIDATION EXPERIMENT FOR M METHOD SYSTEM
A. Experimental Method
In order to verify the effectiveness of the M method system, we conducted an experiment to design products in 30 minutes using the M method (case 1) and the proposed M method system (case 2). All experiment participants (n=5) are design experts who design products as daily work. A questionnaire survey was conducted after the experiment. In the questionnaire, evaluation items were set for "nine benefits of the M method". In addition, a questionnaire was conducted using numerical evaluation based on the 5- point Likert scale method and free-description answers to open questions.
Please describe your impressions of the two methods. (1) Do you think you can clarify the relationships of the design elements? (About Benefit 1)
(2) Do you think you can clarify the difference in ideas? (About Benefit 2)
(3) Do you think you can clarify the process of thinking? (About Benefit 3)
(4) Do you think that it can be used for various objects? (About Benefit 4)
(5) Do you think you can use it in a free way? (About Benefit 5)
(6) Do you think it can be used for collaboration with others? (About Benefit 6)
(7) Do you think you can think of ideas that create new values? (About Benefit 7)
(8) Do you think you can think of an idea that is suitable for a place and creates a place? (About Benefit 8)
(9) Do you think you can think of ideas that utilize new technologies and services? (About Benefit 9)
Fig. 8. Example of using shared work screen.
B. Experimental Results and Discussion
The results of the questionnaire obtained from participants in the experiment were tabulated and the average value was obtained for each question. The results are shown in Table II. Except for effects 2 and 5, the evaluation value of the M method system exceeded that of the M method, exceeding 4.0 on average. Pertaining to effectiveness, the evaluation value of the M method system exceeded the evaluation value of the M method, exceeding 4.0 on average.
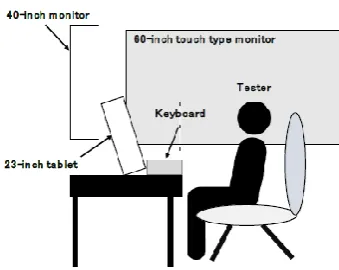
Fig. 9. Experimental environment of case 1.
Fig.10. Experimental environment of case 2.
Fig. 11. The state of experiment of case 1.2.
TABLEII:RESULT OF THE EXPERIMENT
TABLEIII:NUMBER OF DESIGN ELEMENTS IN EACH SPACE
Next, we consider, from the free description answer on each effect and effectiveness (Table I), the cause for the evaluation value of the M method system exceeding the evaluation value of the M method using the paper medium.
The reason why the evaluation value of effect 1 is higher is explained as follows:
We can classify many design elements conceived of using various expression methods into each space, and we can clarify the relationships among design elements and how the relationships are made.
You can change the size of design elements, save the work process, and visually organize by making use of photos and movies.
The reason why the evaluation value of effect 4 is higher is explained as follows:
It is possible to correspond to a wider target area by expressing design elements with multimedia and to handle a large amount of design elements on the Shared Work Screen while organizing them. In addition, we made using the M method system and the basic method of the M method the same, using a paper medium.
The reason why the evaluation value of effect 6 is higher is explained as follows:
By expressing the design elements with multimedia, it is possible to clearly express the idea of the individual and it is easy to share the image with others.
The reason why the evaluation value of effect 7 is higher is explained as follows:
One can get a compulsion idea from images. In addition, we were able to take the merit of the M method using paper medium into the M method system as it is.
The reason why the evaluation value of effect 8 is higher is explained as follows:
You can express design elements in multimedia and easily consider circumstances. In addition, we were able to take the merit of the M method using paper medium into the M method system as it is.
The reason why the evaluation value of effect 9 is higher is explained as follows:
By using various expression methods, it is possible to express technology seeds and it is easy to think concretely.
The reason why the evaluation value of effectiveness is higher is explained as follows:
Design elements can be conceived of in various ways of expressing, and several people can conceive and arrange design elements at the same time by changing their appearance according to their importance.
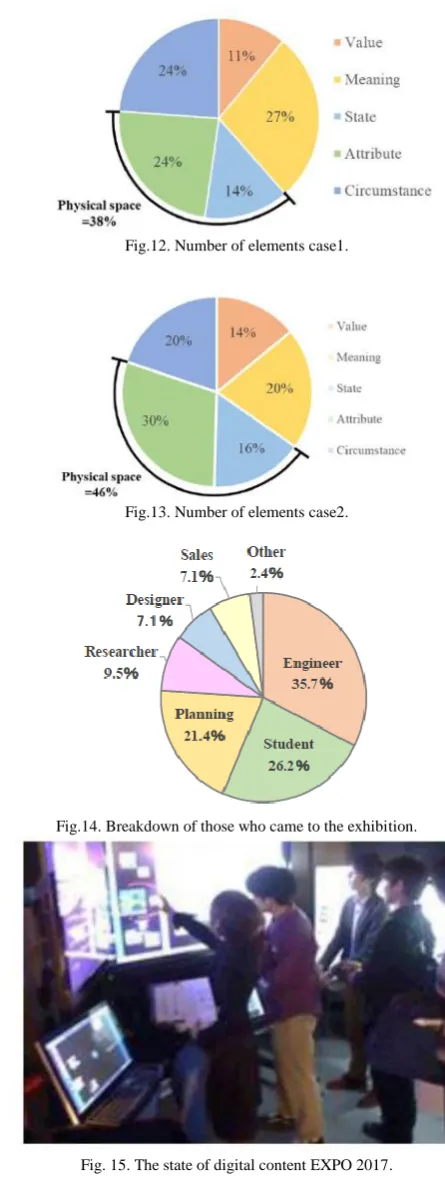
Next, the number of design elements classified into "multi-space" was examined and aggregated. The results are shown in Table III. In this experiment, comparing the number of design elements by the M method and by the M method system, the M method system was able to deliver more design elements. In the study of the brainstorming method, the quality and the number of ideas have been correlated [13]. By using the M method system, it is believed that the quality of the ideas improved because more ideas were presented than with the M method. In addition, the number of elements of "value space" of the M method system is larger than the number of the M method’s, and it is thought that it is possible to deal with various values.
Furthermore, Fig. 12 and 13 show the proportion of design elements for each "space" in the M method and M method system. In the M method, the usage ratio of "physical space" was 38%, whereas in the M method system, it was 46%. It is thought that designers can consider "physical space" by handling images and movies as design elements.
Fig.12. Number of elements case1.
Fig.13. Number of elements case2.
Fig.14. Breakdown of those who came to the exhibition.
Fig. 15. The state of digital content EXPO 2017.
C. Overview of Digital Content EXPO 2017
the questionnaire survey established the overall effectiveness of the system and the three features summarizing the nine benefits of the M method that are “to be easy to organize”, “easy to handle”, and “easy to think”, and we investigated how it felt compared to a five-stage method of idea conception. We also examined the occupation and the age of respondents and their impression of using this system by free-reply response. Fig. 15 shows the state of Digital
Content EXPO 2017.
TABLEIV:RESULT OF QUEST IONNAIRE ON DIGITAL CONTENT EXPO 2017
TABLEIV:APART OF FREE DESCRIPTION REPLY FROM DIGITALCONTENT EXPO 2017
D. Evaluation Results Obtained at Digital Content Expo 2017
Table IV shows the results of the five-stage evaluation for the four evaluation items. Since all the scores for evaluation items for the question for how it felt compared with one’s usual method of idea formation exceeded 3, the system is considered valid. From the free description replies that “I thought that it would be nice to think that you can visually catch something with a large amount of information, such as images, rather than letters” and “I see something that I have never seen so far”, it seems that the validity of this system was demonstrated to various users including engineers and designers who are intended target users for the system. The reason why the evaluation score of this system exceeds 3 is apparently that it is possible to organize a large amount of information by using this system and it is possible to think about ideas with novelty. However, it seems necessary to consider a method to improve the user-experience aspects of this system from the free reply description that “concentration abates if you are not accustomed to the system”. A part of the free description reply obtained at the exhibition is shown in Table IV.
V. CONCLUSION
In this study, to verify the effectiveness of the proposed M method system in which the M method is running on a computer, we conducted comparative experiments to design products using the M method and the M method system, and conducted a questionnaire survey after the experiment. By analyzing a 5- point Likert scale method based numerical evaluation and free-description answers, we confirmed the effectiveness of the M method system. In future, it is necessary to verify the effectiveness of each function implemented in the M method system and further improve it.
REFERENCES
[1] T. Asanuma, Y. Ujiie, K. Sato, and Y. Matsuoka, “Classification of idea generation methods in design based on the multispace design model,” The Science of Design, vol. 58, 2011.
[3] J. Kawakita, The Original KJ Method, Kawakita Research Institute, Tokyo, 1991.
[4] F. O. Alex, Your Creative Power, Charles Scribner’s Sons, New York, 1948.
[5] Y. Matsuoka, Design Science -“Six Viewpoints” for the Creation of Future-, Maruzen, Japan, 2010, pp. 18-19.
[6] Y. Matsuoka, “Multispace design model as framework for Design science towards integration of design,” in Proc. International Conference on Design Engineering and Science, ICDES-10, October 2010.
[7] Y. Matsuoka, Y. Ujiie, T. Asanuma, S. Takano, Y. Izu, K. Sato, and T. Kato, M method – Design Thinking on Multispace, Kindai-Kagaku-Sha, Japan, 2013.
[8] N. Takeda, A. Shiomi, K. Kawai, and H. Ohiwa, “Requirement analysis by the KJ editor,” IEEE,1993.
[9] K. Sugiyama and K. Misue, “A generic compound graph visualizer/manipulator: D-abductor,” International Symposium on Graph Drawing,1995.
[10] S. Takai and K. Ishii, “A use of subjective clustering to support affinity diagram results in customer needs analysis,” Concurrent Engineering Research and Applications, vol. 8, no. 2, pp. 101-109, 2010.
[11] S. Mizuno, Management for Quality Improvement: The 7 New QC Tools, Productivity Press, 1988.
[12] Y. Nayatani, Seven New QC Tools, Productivity Press, 1994. [13] S. GIsaksen, “A review of brainstorming research, Six critical issues
for inquiry,” Creative Problem Solving Group-Buffalo, 1998.
Daisuke Iseki is specialized indesign science, and
product development system. He is currently, the Ph.D. candidate at Keio University. He also works as industrial designer at SONY, Tokyo, Japan.
Shota Amabeis specialized indesign science.He
is currently, the Graduate School of Science and Technology, Keio University.
[2] T. Asanuma, Y. Ujiie, K. Sato, and Y. Matsuoka, “Classification of analysis methods in design based on the multispace design model,”
Yoshiyuki Matsuoka is specialized in design science, design engineering, and product development system. He is currently, aprofessor at Keio University, President of DesignJuku, President of JSSD (Japan Society for the Science of Design), the vice-president of JSDE (Japan Society for Design Engineering) and a fellow of JSME (The Japan Society of Mechanical Engineers). He is also a board member of ASME, IEEE.
Takeo Katoka is specialized in design