http://www.sciencepublishinggroup.com/j/ijeee doi: 10.11648/j.ijeee.20190404.13
ISSN: 2575-5013 (Print); ISSN: 2575-5021 (Online)
Flow Pattern and Hydraulic Parameter Characteristics of the
Different Topographic Position in the Small Catchment
Wang Lingling, Zuo Zhongguo, Lou Xuan, Huang Jing, Hou Xinxin
Yellow River Institute of Hydraulic Research, Key Laboratory of the Loess Plateau Soil Erosion and Water Loss Process and Control of Ministry of Water Resources, Zhengzhou, China
Email address:
To cite this article:
Wang Lingling, Zuo Zhongguo, Lou Xuan, Huang Jing, Hou Xinxin. Flow Pattern and Hydraulic Parameter Characteristics of the Different Topographic Position in the Small Catchment. International Journal of Economy, Energy and Environment. Vol. 4, No. 4, 2019, pp. 80-87. doi: 10.11648/j.ijeee.20190404.13
Received: July 2, 2019; Accepted: August 23, 2019; Published: August 27, 2019
Abstract:
Flow pattern and hydraulic parameter characteristics of the different topographic position in the “slope-gully-basin” system under the rainfall intensities of 60, 90 and 120 mm/h using generalized small watershed model with the simulated rainfall experiment. The results show that the increase of the rainfall intensity will result in the increase of the Reynolds number. During the whole experiment, only when the rainfall intensity is 60 mm/h, the flow pattern of the hilly-slope is laminar flow. The flow patterns of the other geomorphic position are all turbulent flow. Moreover, the Reynolds number of slope flow is much less than that of channel flow. With the increase of rainfall intensity, flow patterns of the all different geomorphic position changed from the stratum flow into torrent flow. Furthermore, the Froude number increases first and then decreases with the increase of rainfall intensity. For the resistance coefficient of the overland flow, with the increase of rainfall intensity, the resistance coefficient of overland flow and channel flow decreases obviously. For the spatial distribution of resistance coefficient, the maximum occurs at the hilly-slope and the minimum at the channel.Keywords:
Topographic Position, Flow Pattern, Hydraulic Parameter, Simulated Rainfall, Generalized Small Watershed Model1. Introduction
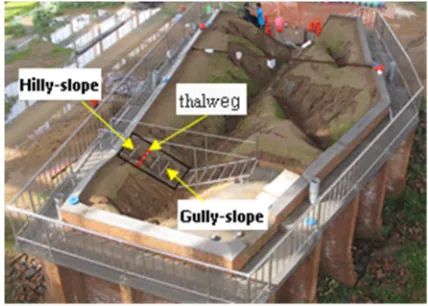
Catchments in hilly-gully region of the Loess Plateau displayed clear vertical zoning along from the top of slope to the bottom of the valley. The profile is divided into the hilly slope, gully slope and the channel. The area connecting the hilly slope, gully and valley slope is called the hilly-gully system and it is also called entire slope. This symmetric hilly-gully system constitutes the most area in the basin [1-3]. There are great differences in erosion modes and sediment-runoff relationship in the different geomorphological locations [4-9]. Therefore, observing and analyzing the hydrodynamic parameters of runoff at different geomorphological locations in the basins is the basis for clarifying the dynamic mechanism of erosion and sediment yield process and revealing the mechanism of runoff-sediment relationship at different geomorphological position.
the monitoring of runoff hydraulic parameters at different geomorphological locations.
In the laboratory simulation experiment, the flow pattern characteristics of overland flow and rill flow on slopes and their variation are studied mainly on the scale of slope plot and slope-gully system. The results show that the hill-slope runoff discharging into gully-slope or the increase of the rainfall intensity will result in the increase of the Reynolds number and Froude number and the shift of flow pattern from the stratum flow into torrent flow [10, 16-17]. However, there is a lack of observation and research on the hydraulic characteristics of water flow in River Basin during its transmission from slope to gully and then to outlet of watershed.
Thus, in this study, selecting the hydraulic parameters such as runoff velocity, Reynolds number, Froude number and Darcy-Weisbach resistance coefficient, the hydrodynamic characteristics of runoff at slope, gully slope and gully of different grades in a watershed system are studied by
combining the generalized small watershed model with the simulated rainfall experiment. The research results can provide a theoretical basis for the establishment of the mechanism model of soil erosion prediction in river basins.
2. Materials and Method
2.1. Generalized Small Watershed Model
The experiment was carried out at the Soil and Water Loss Test Hall of the Loess Plateau, MWR. Taking Qiaogou catchment which located in Loess Hilly and gully region as a prototype watershed, an generalization model with preliminary gully network is designed through abstraction and generalization based on the statistical analysis of the geomorphological features of Qiaogou catchment [18-19]. The initial morphological features of the generalized small watershed model are shown in the Table 1.
Table 1. The initial morphological features of the generalization small watershed model.
Morphological unit Area/m2 Length/m Width /m Perimeter/m Height /m Gradient/%
The first branch 15 6.50 2.02 19.05 2.03 31.2
The second branch 13 5.45 2.60 16.58 1.05 19.3
The whole watershed 66 15 7.53 40.35 2.76 18.4
The soil used in the experiment is from Mshan, Zhengzhou. The model foundation is filled with soil of 1 m which was not sifted. The soil is crushed and filled with water and compacted naturally to prevent settlement during the test. The surface soil about 60 cm depth is silted by 1 cm sieve. The gradation of surface soil is shown in Table 2. Furthermore, the surface soil is filled in layers. the dry bulk density of the surface soil is closed to that of the surface soil in the natural remediation basin, and the variation range of soil bulk density is 1.4~1.5 g/cm3 after sprinkling water and natural subsidence compaction for about 3 months when the generalization watershed model was completed.
Table 2. Particle composition of the soil for testing.
Particle size >0.25 0.25-0.075 0.075-0.005 <0.005
Percentage/% 0.0 10.4 83.7 5.9
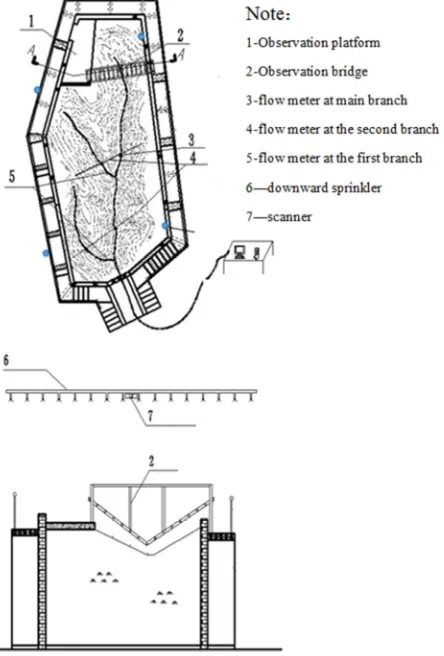
2.2. Installation of Observation Equipment
A downward sprinkler was installed on the top of the generalized model. Four rain gauges were evenly placed around the generalized model. The observation bridge was set up on the top of the whole slope (Figure 1), and the runoff velocity, width and depth were measured artificially at the hilly-slope and gully-slope position. The flow meter was installed at the different parts of main ditch and the branch channel to collect flow velocity, flow width of the channel [20]. According to the research results of erosive rainfall characteristics on the Loess Plateau, the simulated rainfall intensity is set at 60 mm/h, 90 mm/h and 120 mm/h. Studies on rainfall erosivity at home and abroad have found that the product of rainfall kinetic energy and maximum rainfall
intensity of 30 minutes has the best correlation with soil erosion [21]. Therefore, the duration of a single rainfall must be more than 30 minutes. Finally, the duration of three rainfall intensities (60 mm/h, 90 mm/h and 120 mm/h) were determined to be 60 min, 45 min and 45 min, respectively.
Figure 1. The whole slope observation area in the watershed.
2.3. Observation and Collection of Test Data
saturated soil moisture content. Finally, the soil moisture content before experiment varied from 24.8% to 26.5%.
Before the experiment, the whole generalized model was covered with plastic film, then opening the sprinkler for 5 to 10 minutes to calibrate the rainfall intensity. After calibrating the test rainfall intensity, the film was removed to start the experiment.
When runoff is generated at the outlet of any channel, the runoff velocity, width and depth were measured at the hilly-slope, gully-slope and different levels of channel section. Runoff velocity was measured by potassium permanganate solution tracer every 2 minutes at the hilly-slope and gully-slope, ranging from 0.5 meters. The runoff width and depth on hilly-slope and gully-slope were measured with ruler. The runoff velocity and width of channel were collected every 2 minutes by flow meter. The water temperature was measured before and after the experiment, and the mean values of the two were obtained for calculating the viscous coefficient of runoff movement.
After the generalization model was completed, the initial topography of the model was scanned by a three-dimensional laser scanner. After the end of each rainfall, the morphology after the rainfall was scanned and used as the initial morphology of the next simulated rainfall.
Figure 2. Installation of observation instruments.
2.4. Data Analysis and Processing Method
(1) Runoff depth (h). Runoff depth on slope was measured
by ruler. It is difficult to measure the runoff depth of channel directly. Therefore, it is assumed that the flow distributes uniformly along the channel. The calculation of runoff depth of channel is as follows:
vBt q =
h (1)
Where, h is runoff depth in the channel, m; q is the runoff in the period of t minutes, m3; v is runoff velocity of cross-section, m/s; B is width of cross-section, m.
(2) Reynolds number (Re). Reynolds number is the ratio of inertial force to viscous force of runoff. When Reynolds number is less than 500, the runoff is laminar, and when it is greater than 500 the runoff is turbulent. It is calculated as follows
Re=vυh, 2
6
T 000221 . 0 + T 0337 . 0 + 1
10 × 755 . 1 =
υ (2)
Where,
υ
is he viscous coefficient of runoff movement, m2/s; T is water temperature, °C.(3) Froude number (Fr). Froude number is the ratio of inertia force to gravity of runoff. When Fr is less than 1, the runoff is tranquil flow and when Fr is more than 1 the runoff is torrent flow. It is calculated as follows:
Fr h g
v
= (3)
(4) Darcy-weisbach resistance coefficient (f). Darcy-weisbach resistance coefficient can be used to describe the resistance effect of the gully on the runoff. The calculation formula is as follows:
2 v
J h g 8 =
f (4)
Where, J is hydraulic energy slope. Because of the steep slope in the Loess Hilly and gully region, the hydraulic energy slope can be expressed by cosθsinθ, where θ is slope gradient or gully gradient.
3. Results and Analysis
3.1. Characteristics of Flow Velocity
The average runoff velocity at different geomorphological position under the different rainfall intensity is shown in Table 3.
Table 3. The runoff velocity of the different geomorphology position.
Rainfall intensity
The different geomorphology position
Whole slope The first branch The second
branch
The main channel
hilly-slope gully-slope mean upper middle lower mean upper middle-lower mean
60 0.115 0.204 0.160 0.156 0.388 0.394 0.313 0.343 0.286 0.305 0.296
90 0.154 0.430 0.292 0.281 0.380 0.412 0.346 0.394 0.312 0.464 0.388
120 0.150 0.480 0.315 0.369 0.399 0.388 0.385 0.408 0.376 0.407 0.386
Note: Hydraulic parameters of different geomorphology position are calculated for each rainfall intensity. In the same rainfall intensity experiment, the hydraulic parameters are averaged.
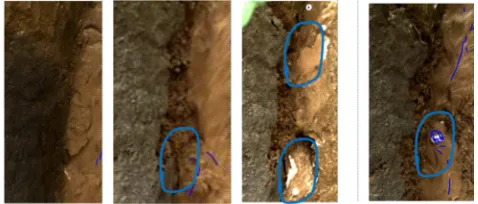
The formation process of drop sill and eddy is shown in Figure 3.
Figure 3. The formation process of drop sill.
For the spatial distribution of flow velocity, the flow velocity increased obviously from slope to channel. At the slope, with the continuous erosion of simulated rainfall, the rill continues to develop, the density of gullies continues to increase, and the roughness of the slope surface continues to increase. Finite elevation difference (LD) and finite slope (LS) were used to calculate slope surface roughness (SSR) [23]. The results showed that during the whole simulated rainfall experiment, the surface roughness of the whole slope increased from 1.6 to 3.4. Because of the increasing roughness of the slope surface, the flow on the slope surface was cut by the rill in the process of confluence, which lead to the continuous change of the flow route, resulting in the flow velocity of the slope surface was significantly decreased. But from hilly-slope to gully-slope, the flow velocity increased. The main reason was that the slope of the gully slope, with an average slope of 40 degrees, much larger than the slope of the
hilly slope, with an average slope of 20 degrees. When the flow transferred from the hilly-slope to the gully-slope, the steep slope made the potential energy of the flow change into kinetic energy and the flow velocity increased continuously. In the process of runoff transferring from the upper part to the lower part of the channel, the flow velocity was also increasing. On the one hand, because the upstream of the channel was closely connected with the gully slope and was affected by the retrogressive erosion resulting in the high ravine density. So, the flow route changed constantly due to the rill split and merge. Then the path of runoff movement increased which caused the decrease of the flow velocity. On the other hand, the channel gradient also made the potential energy of flow continuously transform into kinetic energy. With the increase of overland flow, the depth of channel runoff deepened continuously. The channel flow was no longer a thin layer flow on the slope [24].
3.2. Characteristics of Reynolds Number
The average Reynolds number at different geomorphological position under the different rainfall intensity is shown in Table 4. The results showed that only under 60 mm/h rainfall intensity, the runoff Reynolds number of hilly-slope was less than 500, the flow pattern was laminar flow. And the runoff Reynolds number in other geomorphologic position was more than 500 under all simulated rainfall intensity, the runoff pattern was turbulent. Moreover, with the increase of rainfall intensity, the runoff Reynolds number at any geomorphologic position increased.
Table 4. The Reynolds number of the different geomorphology position.
Rainfall intensity
The different geomorphology position
Whole slope The first branch The second
branch
The main channel
hilly-slope gully-slope mean upper middle lower mean upper middle-lower mean
60 468 1511 989 3394 2118 4669 3394 2235 1716 4623 3170
90 529 2374 1452 3175 4209 4886 4090 6155 5046 8106 6576
120 528 2564 1546 3756 4071 5171 4333 7648 6290 8341 7316
However, the variation of runoff Reynolds number in different geomorphological position was also different. On the whole slope, the Reynolds number of the gully-slope was much larger than that of the hilly-slope, which indicated that under the action of continuous confluence of runoff on the hilly-slope the turbulence of runoff on the gully-slope increased. For channel flow, under the combined action of
3.3. Characteristics of Froude Number
The average Froude number at different geomorphological position under the different rainfall intensity is shown in Table 5.
Table 5. The Froude number of the different geomorphology position.
Rainfall intensity
The different geomorphology position
Whole slope The first branch The second
branch
The main channel
hilly-slope gully-slope mean upper middle lower mean upper middle-lower mean
60 0.58 0.98 0.78 0.89 1.23 1.00 1.04 0.80 1.04 0.79 0.91
90 0.85 1.85 1.35 1.39 1.23 1.68 1.43 1.21 1.43 1.35 1.39
120 0.83 1.31 1.07 1.20 1.29 1.30 1.26 1.11 0.84 0.94 0.89
With the increase of simulated rainfall intensity, the runoff pattern at the sections of the whole slope, the first branch and the second branch changed from slow flow to torrent. However, under the simulated rainfall intensity of 120mm/h, the runoff pattern was slow flow due to the occurrence of drop sill in the main channel which caused the flow velocity decreasing rapidly at the re-attachment area behind the drop sill.
When the rainfall intensity increased from 60 mm/h to 120 mm/h, the Froude number of runoff increased first and then decreased at the same geomorphological position. This indicated that the Froude number of runoff was not only related to rainfall intensity, but also to the morphology of the watershed. Under the simulated rainfall experiment, the runoff yield is the result of the combined effect of rainfall and infiltration. Namely, RS=P F, where RS is runoff yield; P is rainfall; F is infiltration. Under the same rainfall condition, the runoff yield is mainly determined by infiltration. The tested soil is Mangham loess with uniform soil texture. The initial soil moisture content is basically the same before each experiment. So, the initial infiltration rate and stable infiltration at different geomorphological position can be regarded as constants. Therefore, under the simulated rainfall conditions, the rainfall intensity mainly affected the runoff yield. And the watershed morphology affected the process of runoff confluence.
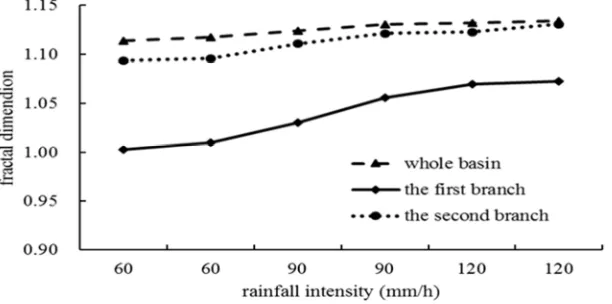
Fractal dimension of Landform is a quantitative Index for
quantitative description of watershed landform characteristics [15]. Using the topographic scanning data after each simulated rainfall, the fractal dimension of different geomorphic units under different simulated rainfall was calculated, and the evolution process characteristics of different geomorphic units were analyzed [25] (Figure 4). The results showed that the fractal dimension of the topographic morphology of the branches and the whole basin increased with the increase of simulated rainfall, which indicated that under the action of rainfall splash and runoff scouring, the gully network of the branches and the whole basin developed continuously and the topographic morphology became more and more complex. However, with the continuous increase of rainfall, the change of geomorphological morphology showed a trend of increasing first and then decreasing. For the first branch, the maximum fractal dimension was 2.50% which happened after the first 90mm/h rainfall intensity. For the second branch, the maximum fractal dimension was 1.37%, which happened after the second 90mm/h rainfall intensity. And for the main channel, the maximum fractal dimension was 0.58%, which happened after the second 60mm/h rainfall intensity. The non-equilibrium of morphological changes in small watersheds may be the reason that Froude number increased first and then decreased at different geomorphological positions.
Figure 4. Fractal dimension of landforms in different rainfall intensity.
From the Table 5, the phenomenon that the Froude number of slope runoff was less than that of channel flow illustrated that the flow pattern of channel was more complex in the
slope to channel, with the increasing of confluence area (the project area of the first branch, the second branch and the whole basin is 13 m2, 15 m2 and 66 m2 respectively) the runoff of the different channel increased. However, the Froude number of different channel sections did not increase with the increase of runoff. It showed that the flow pattern of different channel sections was not only affected by runoff, but also related to the evolution of morphology.
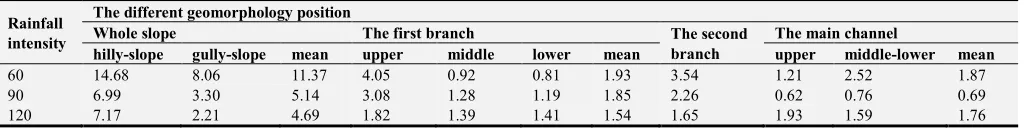
3.4. Characteristics of Darcy-weisbach Resistance Coefficient
The average Darcy-weisbach resistance coefficient at different geomorphological position under the different rainfall intensity is shown in Table 6.
Table 6. The Darcy-weisbach resistance coefficient of the different geomorphology position.
Rainfall intensity
The different geomorphology position
Whole slope The first branch The second
branch
The main channel
hilly-slope gully-slope mean upper middle lower mean upper middle-lower mean
60 14.68 8.06 11.37 4.05 0.92 0.81 1.93 3.54 1.21 2.52 1.87
90 6.99 3.30 5.14 3.08 1.28 1.19 1.85 2.26 0.62 0.76 0.69
120 7.17 2.21 4.69 1.82 1.39 1.41 1.54 1.65 1.93 1.59 1.76
With the increase of simulated rainfall intensity, the resistance coefficient at different geomorphological position generally showed a decreasing trend. For the spatial distribution characteristics, the resistance coefficient of slope runoff was always greater than that of channel flow. At the whole slope, because the runoff of the hilly-slope continuously converged into the gully-slope, the resistance coefficient of the gully-slope was smaller than that of the gully-slope which caused the erosion of the gully-slope severely and the topographic change to be more intense. At the main channel, when the rainfall intensity is 60mm/h and 90mm/h, the resistance coefficient of the main channel was smaller than that of the branch channel because the main channel was the confluence of the whole basin, the flow of the channel was deeper and the hydraulic energy slope was reduced. But when the rainfall intensity is up to 120mm/h, drop sills appeared at the different sections of the main channel, and a transverse vortex was formed in the area attached to the sills. So, the velocity of main channel flow decreased rapidly, resulting in an increase in the resistance coefficient of the main channel.
3.5. Influencing Factors of Runoff Hydraulic Parameters at Different Geomorphological Position
The spatial distribution characteristics of runoff Reynolds number, Froude number and resistance coefficient at different geomorphological positions in the basin showed that rainfall intensity, overland flow, channel confluence, surface roughness and morphology have important effects on hydraulic parameters at different geomorphological locations. The change of geomorphology changed the runoff path, which affected the runoff velocity. Flow velocity was the basis of Reynolds number, Froude number and resistance coefficient calculation. Due to the constant change of flow velocity, the Reynolds number, Froude number and resistance coefficient of different geomorphological locations were changed. Furthermore, the increase of rainfall intensity increased the turbulence of runoff on the one hand, and increased the confluence intensity on the other. So, with the increasing the rainfall intensity, the Reynolds number and Froude number of runoff increased.
At the whole slope, in the process of runoff transferring from hilly-slope to gully-slope, slope pattern, overland flow and surface roughness have obvious effects on hydraulic parameters under the same rainfall intensity. When the gully-slope received the confluence of the hilly-slope, the flow velocity of gully-slope runoff increased rapidly. So, the inertia force of gully-slope runoff increased significantly, which caused the Reynolds number and Froude number of gully-slope runoff increase [12]. Moreover, after the confluence of hilly-slope runoff, the runoff of gully-slope appeared uneven water depth, the local velocity increased suddenly, and resistance coefficient of gully-slope runoff decreased.
When runoff passed from slope to branch and then to main channel, the Reynolds number of channel runoff increased obviously, and the channel runoff was torrent under the different rainfall intensity. The resistance coefficient of channel runoff was not only related to catchment area, but also closely related to the evolution process of channel morphology. For the main channel, it was the confluence of the whole basin, the channel flow was deeper and the hydraulic energy slope was reduced, which made the resistance coefficient of the main channel smaller than that of the branch. Compared with the first branch and the second branch, due to the gully slope of the first branch is larger than that of the second branch, the runoff depth of gully decreased sharply with the gully-slope increasing. So, the runoff resistance coefficient of the first branch was smaller than that of the second branch.
4. Conclusions
Flow pattern and hydraulic parameter characteristics of the different topographic position in the “slope-gully-basin” system under the rainfall intensities of 60, 90 and 120 mm/h using generalized small watershed model with the simulated rainfall experiment. The main conclusions were as follows.
(1) Only when the rainfall intensity is 60 mm/h, the runoff is laminar flow. Under other simulated rainfall intensities, the runoff in different geomorphologic position shows turbulent flow.
at different geomorphological locations changed from slow flow to jet flow, and the channel flow showed stronger turbulence than the slope runoff. And the Froude number of runoff in hilly-slope, gully-slope and channel cross sections of different grades increased first and then decreased with the increase of simulated rainfall intensity,
(3) Resistance coefficients of different geomorphological locations show a decreasing trend as a whole. The spatial distribution of resistance coefficient shows that hilly-slope is larger than gully-slope, and the gully slope is larger than the gully slope.
Restricted by the simulated rainfall conditions and the size of the indoor generalized model, the observation and analysis of hydraulic parameters in different geomorphological positions of the watershed were observed and analyzed only under the existing conditions. In the future, it is necessary to strengthen the scale study of simulation experiments, and to compare and revise the experimental results with those observed under natural rainfall conditions.
Acknowledgements
This work was jointly supported by the National Key Research and Development Program (Key projects for the Efficient Development and Utilization of Water Resources) (2016YFC0402402) and the National Natural Science Foundation (41301299).
References
[1] Jiang, D. L.; Zhao, C. X.; Chen, Z. L. The preliminary analysis of sediment sources in the watersheds of the middle Yellow River. Acta Geographica Sinica 1966, 32, 20-36. (In Chinese) [2] Liang G. L, Chen Hao, Cai Q. G, et al. Research progress of
modern topographic evolvement and landform erosion in Loess Plateau. Research of Soil and Water Conservation. 2004, 11 (4): 131-137. (In Chinese)
[3] Liu, P. L. The current status in establishing the prototype observation network for soil and water losses in hilly Loess Plateau. Soil and Water Conservation in China 2005, 12-13. (In Chinese)
[4] Jiao J. Y, Liu Y. B, Tang K. L. An approach to runoff and sediment generation of gully and intergully land in small watershed. Journal of soil and water conservation. 1992, 6 (2): 24-28. (In Chinese)
[5] Shi Z. H, Song C. Q. Water erosion processes: a historical review. Journal of soil and water conservation. 2016, 30 (5): 1-10. (In Chinese)
[6] Gao G. Y, Zhang J. J, Liu Y, et al. Spatio-temporal patterns of the effects of precipitation variability and land use/cover changes on long-term changes in sediment yield in the Loess Plateau, China. Hydrol. Earth Syst. Sci, 2017, 21: 4363-4378. [7] Gonzalo Martinez, Mark Weltz, Frederick B. Pierson et al.
Scale effects on runoff and soil erosion in rangelands: Observations and estimations with predictors of different availability. Catena, 2017, 151: 161-173.
[8] Philipp Baumgart, Anette Eltner, Alexander R. Scale dependent soil erosion dynamics in a fragile loess landscape. Zeitschrift fur Geomorphologie, 2017, 61: 191-206.
[9] Wang, L. L.; Yao, W. Y.; Tang, J. L.; Wang, W. L.; Hou, X. X. Identifying the driving factors of sediment delivery ratio on individual flood events in a long-term monitoring headwater basin. Journal of Mountain Science 2018, 15, 1825-1835. [10] Wang W. L, Lei A. L, Li Z. B, et al. Study on dynamic
mechanism of rill, shallow furrows and gully in the soil erosion chain. Advance in water science. 2003, 14 (4): 471-475. (In Chinese)
[11] Ding, W. F.; Li, M.; Zhang, P. C.; et al. Experimental study on the sediment yield characteristics in slope-gully system. Transactions of the CSAE 2006, 22, 10-14. (In Chinese) [12] Xiao P. Q, Zheng F. L, Yao W. Y. Flow pattern and hydraulic
parameter characteristics in hillyslope-gullyslope system. Advance in water science. 2009, 20 (2): 236-240. (In Chinese)
[13] Wang, Z. L.; Wu, Y. H.; Bai, Z. G.; Guo, B. W.; Zhao, G. Y. Study on Soil Erosion in Typical Regions of Loess Plateau. World Scientific-Technology Research & Development 2000, 76-79. (In Chinese)
[14] Yu, G. Q.; Li, Z. B.; Zhang, X.; et al. Numerical simulation of gravitational erosion in slope-gully system on Loess Plateau [J]. Acta Pedologica Sinica 2010, 47, 809-816. (In Chinese)
[15] Zhang P, Yao W. Y, Tang H. W, et al. Evolution and quantization method of rill morphology on the slope under rainfall simulation. Advance in water science, 2015, 26 (1): 52-59. (In Chinese)
[16] Zhai J., Lu X. N, Xiong D. H, et al. Review on the research progress of hydrodynamic characteristics and their influencing factors for the runoff of soil erosion, Safety and environmental engineering. 2012.5: 1-5, 9. (In Chinese)
[17] Sun L, Zhang G. H, Luan L. L et al. Temporal variation in soil resistance to flowing water erosion for soil incorporated with plant litters in the Loess Plateau of China [J]. CATENA. 2016. 145: 239-245.
[18] Lei A. L, Tang K. L. Rainfall Similarity in Soil Erosion Model Test and Its Realization. Chinese science bulletin. 1995. 40 (21): 2004-2006. (In Chinese)
[19] Lei A. L, Shi Y. X, Tang K. L. Soil Similarity in Soil Erosion Model Experiments. Chinese science bulletin. 1996. 41 (19): 1801-1804. (In Chinese)
[20] Xie Y. Y, Fan D. M, Wang L. L, et al. Artificial rainfall of indoor small watershed model automatic measurement of channel flow velocity and data processing. Yellow River, 2015. 37 (3): 100-102. (In Chinese)
[21] Wu Y. P, Xie Y. Zhang W. B. Comparison of different methods for estimating average annual rainfall erosivity. Journal of soil and water conservation. 2001, 15 (3): 31-34. (In Chinese)
[23] Liang X. L, Zhao LS, Wu J, et al. Simulation of response law for soil surface roughness and hydraulics parameters of runoff. Transactions of the Chinese Society of Agricultural Engineering.2014, 30 (19): 123-131. (In Chinese)
[24] Zhou S. M; Lei T. W; Warrington David N. et al. Does watershed size affect simple mathematical relationships
between flow velocity and discharge rate at watershed outlets on the Loess Plateau of China. Journal of Hydrology. 2012. 444-445: 1-9.