Abstract—In visual-motor coordination, the human brain processes visual stimuli representative of
complex motion-related tasks at the occipital lobe to generate the necessary neuronal signals for the
parietal and pre-frontal lobes, which in turn generates movement related plans to excite the motor
cortex to execute the actual tasks. The paper introduces a novel approach to provide rehabilitative
support to patients suffering from neurological damage in their pre-frontal, parietal and/or motor
cortex regions. An attempt to bypass the natural visual-motor pathway is undertaken using interval
type-2 fuzzy sets to generate the approximate EEG response of the damaged
pre-frontal/parietal/motor cortex from the occipital EEG signals. The approximate EEG response is used
to trigger a pre-trained joint coordinate generator to obtain desired joint coordinates of the link
end-points of a robot imitating the human subject. The robot arm is here employed as a rehabilitative aid
in order to move each link end-points to the desired locations in the reference coordinate system by
appropriately activating its links using the well-known inverse kinematics approach. The
mean-square positional errors obtained for each link end-points is found within acceptable limits for all
experimental subjects including subjects with partial parietal damage, indicating a possible impact of
the proposed approach in rehabilitative robotics. Subjective variation in EEG features over different
sessions of experimental trials is modelled here using interval type-2 fuzzy sets for its inherent power
to handle uncertainty. Experiments undertaken confirm that interval type-2 fuzzy realization
Bypassing the Natural Visual-Motor Pathway to
Execute Complex Movement Related Tasks
Using Interval Type-2 Fuzzy Sets
outperforms its classical type-1 counterpart and back-propagation neural approaches in all
experimental cases, considering link positional error as a metric. The proposed research offers a new
opening for the development of possible rehabilitative aids for people with partial impairment in
visual-motor coordination.
Index Terms—Interval type-2 fuzzy sets, Fuzzy mapping, Bypassing natural visual-motor pathways,
Prediction of positional body joint coordinates and Inverse kinematics in Robotics, Rehabilitative aids for
visual-motor impairment
I. INTRODUCTION
Brain-computer interfacing (BCI), which is currently passing its infancy, has gained immense popularity
over the last decade for its increasing applications in rehabilitative robotics [1]-[5]. Patients suffering from
paraplegia [6], paraparesis [6], cerebral palsy [97], Optic ataxias [8], [9], Balint’s Syndrome [10] and other
brain-related diseases [11] including post stroke patients [7] usually have reduced functioning in
pre-frontal, parietal lobe and/or motor cortex, prohibiting them to correctly control their limb and body
movements due to impairments in sensory-motor coordination. The conventional BCI techniques utilize the
signals acquired directly from the motor cortex during motor imagery tasks to decode the motor
executions/imaginations. [12]-[14], [82]. In case of partial damages of the brain modules on the
visual-motor coordination pathways, the subjects are unable to perform the coordination tasks. The brain signals
acquired from motor cortex of those people are compromised since the pathways for motor coordination
and execution are disrupted in these cases. Consequentially, decoding of BCI motor imagery directly from
motor cortical signals in these cases is not beneficial. One approackh to solve this problem is to bypass the
pathways containing the damaged brain modules. This paper attempts to rehabilitate patients with such
visual-motor coordination impairment by arranging an alternative (artificial) pathway from the occipital
lobe to the motor cortex (via the pre-frontal and parietal lobe) through a two-step non-linear mapping
The problem addressed in the paper is briefly outlined as follows. Let X and Y be two distinct feature
vectors obtained from EEG signals acquired from two brain regions/lobes. Let M X: Y
be a mapping
function. If we can recover M from successful instances of XandY,
then for an unknown
'
X close enough
toX,
we can retrieve '.
Y Nonlinear regression [90], [91] and function approximation by supervised neural
learning [92], [93] are widely used techniques to develop the mapping function M. These mapping techniques work well when the feature vectors are free from noise.
Measurements in real world problems are often found to be contaminated with various forms of noise
[81]. EEG signals acquired from a subject during his/her experimental trials to perform a cognitive task
often are found to be contaminated with noise for the following reasons. A few common sources of noise
that influence the acquired EEG signals include lack of subjective concentration, parallel undesirable
cognitive thoughts while performing the main cognitive tasks, undesirable head/body movements/eye
blinking, and noisy ambience. Naturally, the features extracted from the EEG signals in presence of the
above noisy sources are affected with noise.
Traditional mapping policies that attempt to generalize M X: Y
from several Xi s and corresponding
Yi s for i =1 to n trials cannot correctly capture the non-linearity in the function Y = M(X) for non-uniform fluctuation in noise over the different trials. The problem in the present context is to design a suitable
mapping M, which would not be significantly influenced in presence of random fluctuation of noise over the EEG trials.
The logic of fuzzy sets has proved itself an interesting tool for decision-making under uncertainty and
noise [15-25], [Fill me in]. Type-2 fuzzy sets, which has been introduced by Zadeh in 1975 [26], and has
been popularized by Mendel [27] - [34] over the last decade, have an inherent representational
characteristics to model measurement uncertainty by membership functions [35-39], [98]. An interval
type-2 fuzzy set (ITtype-2FS) often is characterized by two membership functions (MFs), called upper membership
embodies an infinitely large number of (embedded) type-1 fuzzy sets [40-42], and is referred to as footprint of uncertainty (FOU). Thus, for example, for a fuzzy concept: height is MEDIUM, we have n different type-1 MFs obtained from n sources. The UMF (LMF) of IT2FS at a given value of linguistic variable x is obtained here by taking the maximum (minimum) of the type-1 fuzzy MFs at the same x obtained from n
sources. Thus at a given height (x=6 feet, say), the FOU bounded by the UMF and the LMF has a wide space of uncertainty in the membership of height is MEDIUM.
The EEG features acquired during task-planning having wider variance, IT2FS seems to be an efficient
tool for EEG feature encoding (and also mapping). Given two brain lobes L1 and L2, suppose we have n
sets of features for both the lobes for n sets of experimental trials, aimed at planning/performing a given cognitive task. We construct one FOU for each feature of lobe L1 using the numeric values of the same
feature over n-successful-trials for a given subject i. Similarly, we also obtain one FOU for each feature of lobe L2 using the numeric values of the same feature over n successful trials for the same subject i. Now,
given an unknown experimental trial, for which we obtain all the features from the EEG of lobe L1, we use
these to instantiate the IT2FS MFs of lobe L1, and using standard IT2 inferential procedure attempt to infer
the IT2 MFs for each unknown feature of lobe L2. Now, by type-2 defuzzification (fuzzy decoding) of each
FOU, dedicated for each feature, we obtain the predicted features of lobe L2. This process is used to
determine features from successful instances of occipital EEG to parietal and prefrontal EEG and then by
using the resulting IT2MFs of the parietal and prefrontal regions we, ultimately obtain the EEG features of
the motor cortex region. Experiments undertaken confirm that for normal subjects, the predicted motor
cortex features obtained from the measured occipital features by the proposed IT2FS technique is very
accurate with mean square error less than or equal to 1.25.
It is thus apparent that to predict EEG response for movement related task from the EEG response to
visual stimuli, we need to have prior EEG data from successful instances of occipital lobe, parietal lobe,
have Balint’s Syndrome, optic ataxia, optic apraxia, Parkinsson’s diseases, paraplegia, paraparesis, cerebral
palsy, or other brain ailments cannot perform complex planning due to partial non-functionality of the
parietal, pre-frontal and/or motor cortex [6], [7], [10]. Since the visual-motor pathways are affected for
these types of patients, the proper signals cannot be acquired directly from the motor cortex. Thus
conventional BCI systems [2], [4], [5], [80], [82], [83], aiming at generation of control commands for
rehabilitative aids (such as brain-commanded artificial limbs [Fill me: Saugat Journal paper-P300 based
limb]) from the acquired EEG signals captured directly from the motor cortex are unsuitable for the above
types of patients. Thus, focusing on the patients with impaired visual-motor coordination due to damaged
prefrontal, parietal and/or motor cortex, this paper attempts to derive the mapping of occipital to parietal
and prefrontal lobe to motor cortical EEG features from successful instances of visual-motor coordination
task and use this mapping in future to offer rehabilitative aids to these patients.
There exists a lot many works on EEG driven motor planning/control [2], [4], [5], [80], [82], [83]. A few
works that require special mention in this regard include EEG driven mind controlled wheelchair [1], [84],
[85], brain-actuated asynchronous control of humanoid robots [86], BCI based unmanned car control [88],
virtual gaming [89] and other applications [82]. Unfortunately, none of these works consider bypassing
visual-motor pathways by EEG-BCI. The present work thus seems to be a promising research in the BCI
EEG response to
Visual Stimulus
Optic nerve pathway
Occ
Par MC
Execution of movement
Movement planning Visual
Stimuli
(a) pF
Occipital Lobe
Parietal Lobe
Motor Cortex Visual
Stimulus
Other Lobes Other Lobes
Movement Execution
Prefrontal Lobe And caudal
frontal
Other Lobes Other Lobes
(b)
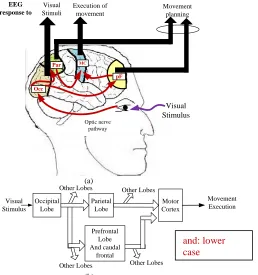
Fig. 1. Neural pathways (redline) inside the brain that transforms input visual stimulation to complex movement plans (at parietal), and movement execution (in motor cortex) (a) Active pathway from occipital to motor cortex in visual-motor coordination, (b) Schematic view of the architectural connection in (a)
The EEG features derived for motor cortex from such mapping now can be used to predict target joint
coordinates of subjects’ limb movement associated with complex sensory motor coordination task. The
target joint coordinates of subjects’ shoulder, elbow and wrist are captured from his/her successful
movement of these joints in a visual-motor coordination task. The capturing of this coordinates is done
using a Kinect sensor system [43-49] to determine the artificial mapping of occipital features to parietal and
prefrontal features to motor cortical features to joint coordinates of shoulder, elbow and wrist of the
right-handed subjects. The mapping are later used to test the feasibility of artificial mapping introduced above in
visual-motor coordination experiments, particularly for possible futuristic rehabilitation of patients
suffering from sensory-motor coordination impairments. The mapping of motor cortex features to joint
coordinates is then performed by the IT2FS technique mentioned above. The joint coordinates of subjects
thus predicted from his/her occipital EEG data are then used to subsequently input to a robotic arm with
multiple links, each having correspondence to specific limbs of a human subject. During resetting, the robot and: lower
aligns its links similar to start-up positions of the subjects’ (fixed) natural limb positions (hanging down).
Next the robot determines the angular shifts/displacement required for each link to reach the desired goals
for individual joint by an inverse kinematic approach. In our simple system, we attempted to imitate only
three joints of the upper arm (shoulder, elbow and wrist).
The rest of the paper is structured into six sections. Section II provides a system overview along with the
proposed T1FS and IT2FS based mapping. Experimental details and corresponding results are given in
section III. System validation is undertaken in section IV with an overall discussion of the proposed system
in section V. Conclusions are summarized in section VI.
II. PRINCIPLES AND METHODOLOGY
This section provides a thorough discussion on the proposed feature mapping technique using Type-1
fuzzy sets (T1FS) and IT2FS. It also gives an overview of the complete scheme employed for occipital to
parietal, and parietal/pre-frontal to motor cortex feature mapping.
Let,
,
( )
j i r
f
t
be the jth instance of the ith feature of an EEG signal acquired on day t from the rth corticalregion of the scalp, where j, i, and t lie in [1, l], [1, n], and [1,k] respectively.
)
(
,t
F
iRj
be the jth instance of the ith feature of an EEG signal acquired on day t from the Rth cortical region of the scalp, where j[1, ], l i[1, ] and m t[1, ].k
,
( )
i r
f
t
be a random variable with mean ,1
1
( ) ( )
l j
i i r
j
m t f t
l
and variance
22
, 1
1
( ) ( ) ( )
l j
i i r i
j
s t f t m t
l
.,
( )
i R
F
t
be a random variable with mean ,1
1
( ) ( )
l j
i i R
j
M t F t
l
2 2 , 1 1 ( ) ( ) ( ) l ji i R i
j
S t M t M t
l
.We here propose a mapping scheme from feature set
f
f
i r,( ),
t i
1 to
n
to feature set
i R,( ), i
1 to n
F
F
t
, where the parameters involved in the sets are defined above. The randomnessin
f
i r,( )
t
is captured by a Gaussian type membership function (MF) ( , ( ))i
CLOSE TO MEAN fi r t
or hereafter,
,
( ( ))
i
C fi r t
for brevity, where the MF indicates the degree of closeness of
f
i r,( )
t
with the mean value mi(t) of the random variablef
i r,( )
t
. Similarly, the randomness inF
i R,( )
t
is captured by a Gaussian type MF,
( ( ))
i
CLOSE TO MEAN Fi R t
or ( , ( ))
i
D Fi R t
. Choice of Gaussian type MF here is induced by the experimental
observation that the random variable fi r, ( )t always lies in the interval [mi3si,mi 3si]. Similarly, the
random variable Fi R, ( )t always lies in the interval [Mi3Si,Mi3Si].
To keep the proposed mapping free from the effect of diurnal variation, t, we use random variables
,
i r
f
andF
i R, with respective mean and variance obtained by central limit theorem [79]. The mean andvariance of
f
i r, are obtained as ,1
( )
k
i r i
t
f
m t
and 2 21
( ) k
i i
t
v s t
, whereas the mean and variance of,
i R
F
are given by ,1
( )
k
i R i
t
F
M t
and 2 21
( ) k
i i
t
V S t
respectively. The Gaussian MFs ( , ( ))i
C fi r t
and
,
( ( ))
i
D Fi R t
with mean and variance as introduced above are given by
22 2 ,
(
)
,
r r i i i i f f vC
f
i re
and
2 2 2 ,(
)
.
R R i i i i F F V DF
i Re
(2)Min Min 1,r
f
' 1,r f , n r f ' , n r f , n R F 1,R F ' 1,R F ' , n R F ~ 1 1,( r)
C f
1,R F FOU , n R F ' 1,rf
' , n rf
MeasurementsIT2 Fuzzy Reasoning
T2 Defuzz. Antecedent Space Consequent Space IT2 Inference
T2 Defuzz. ~ ( n, )
n r C f
~ 1 1, ( R)D
F
~ ( n, )
n R D F ~ ' 1 1, ( R)
D F ~ ' n, ( ) n R D F FOU
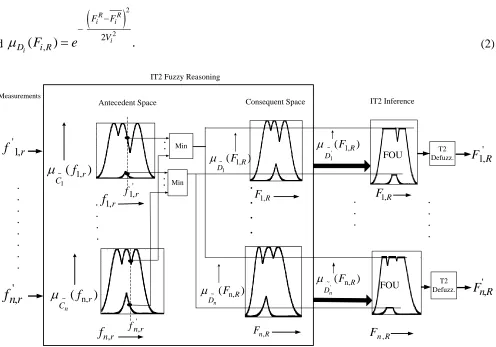
Fig. 2. Feature mapping using proposed IT2FS
A. Type-2 Fuzzy Feature Mapping
Type-1 fuzzy (T1FS) technique, introduced above, attempts to model the variations of a feature across
experimental trials by a type-1 MF. However, for simplicity in representation, the measurements containing
diurnal variation in a feature are represented by a single fuzzy (Gaussian type) MF. Such MF, however,
fails to include fluctuation over days. This section overcomes the above limitation by combining the type-1
MFs describing diurnal variation with the help of an interval type-2 (IT2) representation. The uncertainty
involved within and across diurnal variations of features thus can be better modeled by IT2FS (See Fig. A.1
in the Appendix). The fuzzy mapping induced by the following interval type-2 rule thus is expected to yield
more realistic inferences than its type-1 counterpart (See Fig. A.2 in the Appendix), indicating parietal and
motor cortex EEG features from the measured occipital features.
Rule Ri: If
~
1, 1
(f r is C and)
~
2, 2
(f r is C ) and ….. and
~
n,
(f r is C Then n)
~
,
where
~
j
C for j=1 to n and
~
i
D are IT2FS. We have n such rules with the same antecedent as for IT2 Rule Ri
but varied consequent
F
i R, for i = 1 to n.The randomness of a feature over different instances on a day is modeled here by a Gaussian MF
,
( ( ))
i
C fi r t
with mean m ti( )and variance s ti2( ) as defined earlier. The MF is given by
2 ,
2 ~
( ( ) ( )) 2 ( ) ,
( (t)) .
i r i
i
i
f t m t s t i r C f e
(6)
We now construct a IT2 MF with upper Membership Function (UMF) and Lower Membership Function
(LMF) for feature fi r, given by
, ~ ,
1
( ) ( ( ))
i
k
i r i r
t C
UMF f Max f t
(7)
~
, ,
1
and L ( ) ( ( ))
i
k
i r i r
t C
MF f Min f t
(8)
The region between the UMF and the LMF is called the footprint of uncertainty (FOU). Similarly, we
define UMF(Fi,R) and LMF(Fi,R). Once the computation of UMF(fi,r), LMF(fi, r), UMF(Fi,R) and LMF(Fi, R) for i=1 to n is over, we employ the following four steps for predicting the EEG features of region R from
the measured features
f
i r, at region r.Step 1: Instantiate
UMF(
f
i r,)
andLMF(
f
i r,)
by the measurementsf
i r,
for i=1 to n to determine the lower and upper firing strengths LFSi r, and UFSi r, given by
, ,
, ( , )
i r i r
i r i r f f
LFS LFM f
(9)
, ,
, ,
and ( )
i r i r
i r i r f f
UFS UFM f
(10)
Step 2: The composite lower and upper firing strengths LFSr and UFSr are now obtained by taking fuzzy aggregation, here Min, of the LFSi r, s for i=1 to n.
Replace LFM by LMF
,
1
n
r i r
i
LFS Min LFS
(11)
,
1
and
n
r i r
i
UFS Min UFS
(12)
Step 3: We next determine the FOU q of the consequent membership space by performing fuzzy t-norm
(min) over the LFSr (UFSr) and the qth consequent LMF(Fq, R)(UMF(Fq,R)) for q= 1 to n. This is given by
, ,
LMF F( q R )Min LFSr, LMF F( q R) (13)
, ,
and UMF F( q R )Min UFSr, UMF F( q R) (14)
Step 4: The feature
F
q R
, is now evaluated using the following two sub-steps. First, we compute the lower and the upper end point centroids (Cl,q and Cu,q) of the resulting FOU q by the following expressions [50-55]: , , , , , . . l l q l q l q C q q q Cl q C
q q
C
UMF x dx LMF x dx C
UMF dx LMF dx
(15), , , , , . . u q u q u q u q C q q C
u q C
q q
C
LMF x dx UMF x dx C
LMF dx UMF dx
(16)Here we use the well-known Karnik-Mendel [50-55] iterative algorithm to compute Cl,qand Cu,q using the
above two equations. In the next step, we evaluate feature
F
q R
, by taking average of Cl,q and Cu,q, i.e.,
, , ,
1
2
q R l q u q
F
C
C
(17)parietal features from occipital features, prefrontal features from occipital features and joint coordinates
prediction from motor cortical features, the IT2FS scheme presented in Fig. 2 is executed.
B. Proposed System Architecture
The principle of type-1(T1FS) and IT2 fuzzy (IT2FS) approach for EEG feature mapping from
region r to region R on the human scalp has been extended here for rehabilitative application of subjects with damaged pre-frontal, parietal and/or motor cortex regions. We here attempt to utilize the
proposed fuzzy mapping policy to map the EEG features extracted from occipital region to predict the EEG
features of the same subject for the parietal/prefrontal and motor cortex regions. Fig. 3 explains the fuzzy
mapping principles involved to predict the EEG features of parietal, prefrontal and motor cortex regions.
Here, for known measurements fi,o for i=1 to n obtained from the occipital region “O” of subject-1 and known Fj,P for j=1 to n obtained from the parietal region “P” and Fj,pF for j=1 to n obtained from the prefrontal region “pF”, we construct type-1 or IT2 fuzzy sets describing fi,o is Ci and Fj,P is Dj and Fj,pF is Ej
for i= 1 to n and j=1 to n. Then for known observations about
f
i o', i =1 to n, we attempt to predictF
j,P' forj=1 to n and F/j,pF (Do correct formatting for F/j,pF) for j=1 to n using the principle discussed above. In the
second phase, we similarly construct type-1 or IT2 MFs for fj,Pis Cj, Fj, pF Dj and
F
k,MC is Ek and thenfor j, k = 1 to n, we instantiate fj,Pis Cj by predicted
' j,P
F
,(i.e., by settingf
j,P
F
j,P' ) and f j,pF is Dj byF/j, pF for j=1 to n, to predict
'' ,MC
k
F
for k=1 to n using the geometric principles introduced in theAppendix (See Fig. A.3).
Subject Visual stimulus FE T1/ IT2 Fuzzification for each occipital feature Occ Par MC FE FE
T1/ IT2 inference generating procedure
T1/ IT2 defuzzification
1,MC, 2,MC, . . ., n,MC
F F F
T1/ IT2 Fuzzification for each parietal
feature
T1/ IT2 Fuzzification for each motor
cortex feature T1/ IT2 inference generating
procedure T1/ IT2 defuzzification
Input measurements
Observed 1,P, 2,P, . . ., n,P
F F F
i,P,
F i
FP
FE T1/ IT2 Fuzzification for each pre- frontal feature T1/ IT2 inference generating procedure T1/ IT2 defuzzification
1,FP, 2,FP, . . ., n,FP
F F F
Observed ai,P,
F i
Fuzzified Occipital MF
Fuzzified Prefrontal MF Fuzzified Parietal MF
Fig. 3. IT2FS fuzzy inference generation system
Occipital Lobe Damaged Natural Pathway via Parietal, Prefrontal Lobe and Motor Cortex
EEG Features Fuzzy technique to determine predicted EEG
features at motor cortex from parietal and prefrontal features Junction Coordinate Prediction using Fuzzy Mapping Inverse Kinematics of a
Robot Predicted EEG Features Junction Coordinates Angular Displacement needed for each link Visual Stimulus Link Parameters
Fuzzy technique to determine predicted EEG features at prefrontal region from
occipital features
Fuzzy technique to determine predicted EEG features at parietal region from
occipital features Predicted EEG Features
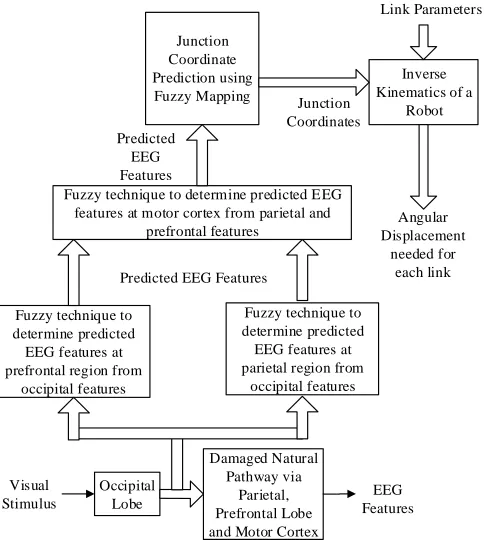
Fig.4. The complete scheme during task execution session
F/1.pF, F/2,pF , ……, F/n, pF
(a) ' 1 X 1 X ' 0 1 1. 1
X T X
0 1 T 1 ' 2 X 2 X
' 0 1 2 1. 2. 2 X T T X
1 2 T 2 ' 3 X 3 X
' 0 1 2 3 1. 2. 3. 3
X T T T X
2 3 T 3 J0 Link 1 Gr J1 J2 J3 Link 2 Link 3 (b) Parameters
for link 1
Parameters for link 2
Parameters for link 3 0 1 T Z0 Z1 Z2 Z3
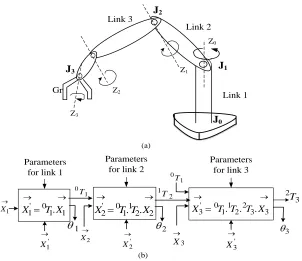
Fig. 5. Inverse kinematics solution for joint coordinates
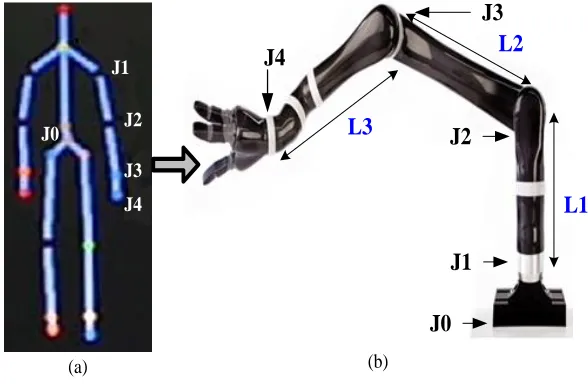
The motor cortex EEG features thus obtained is used to predict three distinct joint-coordinates: J1, J2,
and J3 (Fig. 4), resembling shoulder, elbow and wrist joints respectively of the subject (Fig. 5(a)), while J0
resembling the subject’s waist is being used as the reference joint (see Fig.5(a)), for the subject with
damaged parietal, prefrontal and/or motor cortex. The prediction involves again functional mapping, which
has been performed by both T1 and IT2FS techniques introduced above. The predicted joint coordinates are
now used to determine the angular movements required for different links of the robot, which is performed
here by inverse kinematic technique used in robotics [56], [78]. A brief outline to the proposed inverse
kinematic approach is given below for convenience of the non-specialist readers. The overall schematic is
presented in Fig. 4.
Inverse Kinematics: Let the initial coordinate of joint Ji be Xi ( ,x y zi i, i)T
and its final coordinate after
rotation be Xi' (xi ,yi ,zi )T
'
' 0 1 1
1 2 '
. ... .
. , say
i i
j
i i i
i i i o j i i x x
y T T T y
z z x A y z (18)
where, oAj 0T T1.1 2...j1Tj.
Thus given x y zi', i', i' T, x y zi , i, i T,and 0T T1.1 2...j2Tj1, we can find j1Tj from the following expression:
'
' 0 1 2 1
1 2 1
'
1 1
. ... .
. . , say
i i
j j
i j j i
i i
i
o j
j j i
i
x x
y T T T T y
z z
x
A T y
z (19)
where oAj1 is known. Computing j1Tj and hence the angle of rotation iaround a given axis, which is
expressed in the form of Sin iand/or Cosi in j1Tj, is the inverse kinematic problem [101]. The inverse kinematic problem is solved here stepwise starting from link 1. The general structure of solving the
problem in the present context is given in Fig. 5(b).
III. EXPERIMENTS AND RESULTS
Principles of feature prediction of the parietal and motor cortex EEG from the measured EEG features of
the occipital region, introduced earlier, are experimentally tested in this section. We here briefly outline the
experimental set-up, followed by experimental steps and main results.
A. Experimental set-up
to extract EEG signals. Experiments are conducted on 10 right handed normal healthy individuals (4 female
and 6 male of age group 40-55 years) as well as on 30 right handed disabled subjects. 30 diseased subjects
included people suffering from six types of diseases/disability, namely isolated optic ataxia (OA) (with
damaged in one side of the post parietal cortex), paraplegia (PG) (loss in motor control), Balint’s syndrome
(BS) (suffering from visual-motor coordination), paraparesis (PR) (partial loss in motor control), post
stroke (PS) patients with damaged parietal/prefrontal or motor cortex and cerebral palsy (CP) (affects
motor movement and muscle coordination). These diseased subjects are mainly suffering from impairments
of frontal/ parietal and/motor cortex regions leading to visual, motor and visual-motor coordination. Five
subjects belonging to each of these six disease/disability groups are chosen, thus comprising thirty subjects,
including 17 male and 13 female in the age group 40-55years.
Subjects are engaged in a movement-related task-planning through visually inspired stimuli. EEG
signals are acquired from the occipital (channels O1 and O2), parietal (channels P3 and P4), pre-frontal
(FP1 and FP2) and motor cortex regions (channels C3 and C4) of subjects using the standard 10/20 EEG
configuration [59]-[60]. A Kinect sensor system, manufactured by Microsoft Corporation, USA, is used in
conjunction with the EEG system to measure the joint-coordinates in the right arm of the subjects
throughout the experiments (Fig. 6(a)). The Kinect system includes two cameras, one in the visual
wavelength and the other in the infra-red (IR) wavelength. The camera in the visual wavelength gives
image information and the one in the IR wavelength gives depth information. Both the visual and depth
information are jointly used to construct a skeleton of the human subject with positions of 20 joint
coordinates of the subject within its field of view. We, however, use the 3D coordinates of wrist, elbow and
shoulder of the subject only. The sampling rate of Nihon Kohden EEG machine is set at 500 Hz and that of
Kinect sensor is 30Hz. A humanoid (JACO) robot arm [61]-[62] (manufactured by Kinova, USA) capable
of mimicking one complete arm of a normal human being, is used to test/validate the predicted movement
of subjects from his/her predicted motor cortex features.
[95] modality of EEG. In our initial experiments, we considered power spectral density (PSD) [13],
[63]-[65] Adaptive Autoregressive (AAR) parameters [66]-[69] and Daubechies-4 wavelet coefficient [70]-[73]
features, but later discovered that only PSD features are a good choice, as AAR and wavelet coefficients
features do not add any improvements in the results of final joint coordinate prediction.
(b) (a)
J1 J2
J3
J4
J1
J2
J3
J4 L1
L2
L3
J0
J0
Fig. 6 (a) The skeleton obtained by processing the Kinect output showing the corresponding joints (J1-J4), with the waist joint J0 is taken as reference (b) The JACO Robot Arm showing the corresponding joints (J1-J4), with the robot arm base J0 is taken as reference and the respective links (L1 – L3)
B. MF Construction
The experiment includes throwing a ping-pong ball toward a subject from a distance of 20 feet at a speed
of 2feet/sec approximately, where the subject recognizes the stimulus, plans and executes the
movement-related task to hit the ball with a bat held at his/her right arm. Only the successful instances, where hit
occurs are considered here repeatedly over 10 epochs/day and over 10 days on each of the subjects to
design the Type-1/IT2 membership functions of the acquired occipital, parietal, pre-frontal, and motor
cortex EEG features of each subject.
C. Testing Phase
During the testing phase, the subject observes the ball movement and attempts to plan the movement of
his/her arm to hit the ball. The principles employed for prediction of Type-1/IT2 pre-frontal, parietal and
motor cortex features. The overall system introduced in Fig. 4 is invoked to determine the joint coordinates
of shoulder, elbow, and wrist of subject from the predicted features of motor cortex of the same subject.
TABLE I
PERCENTAGE OF NORMALIZED POSITIONAL LINK ERROR FOR NORMAL AND DISEASED SUBJECTS Subject ID
(N-Normal/ D-Diseased)
Link No.
Percentage of Normalized Positional Link error for IT2FS (T1FS)
(%)
Time taken for IT2FS (T1FS)
(sec)
L1 L2 L3 L1 L2 L3
1-N 6.1 (7.2) 3.4 (3.8) 5.01 (6.2) 2.5 (4.0) 2.0 (3.4) 3.2 (5.4) 2-N 7.0
(8.4) 3.25 (5.2) 3.40 (5.6) 1.8 (2.6) 2.2 (3.1) 4.3 (5.1) 3-N 7.80
(9.4) 3.16 (6.4) 3.60 (6.3) 2.2 (2.4) 1.9 (2.7) 3.8 (3.1) 4-N 7.20
(9.1) 3.45 (4.9) 3.75 (4.2) 2.0 (2.5) 2.8 (3.2) 3.1 (2.5) 5-N 7.45
(8.6) 3.84 (4.8) 4.02 (5.7) 1.7 (2.1) 2.0 (2.6) 2.7 (2.9) 6-N 3.4
(5.6) 4.7 (7.5) 3.84 (6.8) 2.4 (3.0) 2.6 (2.9) 3.3 (3.9) 7-N 6.35
(8.1) 5.27 (10.4) 4.78 (7.5) 2.2 (2.8) 2.0 (2.7) 3.4 (4.7) 8-N 7.58
(8.1) 5.2 (6.8) 5.8 (7.2) 2.7 (3.2) 2.9 (3.6) 3.3 (4.1) 9-N 7.2
(7.7) 3.5 (4.6) 4.3 (6.8) 2.1 (2.5) 2.8 (3.4) 3.3 (3.8) 10-N 7.7
(8.3) 4.8 (6.2) 4.5 (7.9) 1.9 (2.3) 2.6 (3.1) 3.2 (3.5) 1-D (OA)
17.3, 17.6, 16.8, 16.9, 17.1 (18.5), (18.2), (17.7),
(17.4), (17.9)
14.5, 12.6, 13.5, 14.7, 14.4 (15.7), (13.3), (14.5),
(15.1), (14.9)
13.9, 13.4, 14.6, 14.2, 15.2 (14.6), (13.7), (15.1),
(14.8), (15.9)
4.6, 4.1, 3.8, 4.6, 4.9 (5.2), (4.7), (4.3),
(5.3), (5.7)
5.2, 4.8, 5.4, 4.7, 5.1 (5.9), (5.3), (5.8),
(5.3), (6.1)
6.1, 6.3, 5.6, 6.1, 6.4 (6.4), (6.7), (5.8),
(6.6), (6.8) 2-D
(PG)
22.5, 21.0, 23.6, 23.8, 21.6 (24.2), (23.8), (27.4),
(28.1), (23.7)
16.7, 16.4, 17.1, 17.8, 16.9 (18.2), (17.9), (17.8),
(18.4), (17.3)
20.0, 20.2, 18.3, 21.4, 19.6 (23.4), (25,6), (21.5),
(26.3), (23.5)
6.4, 5.6, 6.7, 6.9, 5.1 (7.1), (6.3), (6.9),
(7.4), (5.7)
7.3, 6.6, 6.9, 7.1, 7.4 (8.5), (6.9), (7.4),
(8.2), (8.8)
7.9, 8.3, 7.7, 8.2, 8.5 (8.3), (8.6), (8.0),
(8.7), (8.8) 3-D
(BS)
12.7, 12.3, 13.4, 12.8, 13.1 (14.0), (13.6), (14.2),
(13.5), (13.9)
9.5, 9.7, 10.2, 8.9, 9.4 (11.3), (10.4), (11.1),
(9.7), (9.9)
9.6, 9.1, 9.8, 8.7, 10.1 (11.2), (9.7), (10.4),
(9.3), (10.8)
4.9, 4.8, 5.3, 5.7, 4.7 (5.2), (5.3), (5.9),
(6.5), (5.8)
6.5, 6.9, 7.1, 6.1, 6.8 (7.0), (7.4), (8.2),
(6.5), (7.2)
8.6, 8.8, 7.7, 7.4, 8.2 (9.1), (9.6), (8.5),
(7.8), (8.8) 4-D
(PR)
27.9, 24.5, 26.1, 28.4, 28.0 (29.1), (29.5), (30.2),
(33.8), (24.7)
20.5, 21.8, 19.5, 17.8, 18.4 (24.7), (23.3), (21.6),
(19.4), (20.7)
23.6, 24.5, 22.7, 27.7, 25.6 (28.6), (29.4), (25.4),
(30.5), (27.9)
7.9, 6.6, 7.4, 8.1, 6.7 (8.6), (6.8), (7.9),
(8.7), (7.2)
7.6, 7.2, 7.8, 8.1, 7.4 (8.3), (7.0), (8.3),
(8.6), (7.9)
8.0, 8.3, 7.9, 8.1, 8.6 (8.9), (9.1), (8.4),
(8.7), (8.9) 5-D
(PS)
26.0, 23.4, 27.8, 26.0, 25.5 (29.3), (25.6), (30.3),
(27.3), (29.3)
25.3, 26.8, 23.6, 22.5, 26.1 (28.3), (29.0), (28.1),
(25.2), (29.7)
24.7, 26.1, 27.3, 22.4, 25.6 (29.3), (28.2), (31.4),
(26.7), (27.1)
6.5, 6.3, 6.1, 6.8, 6.6 (7.4), (6.7), (6.4),
(7.4), (7.0)
6.9, 7.2, 7.6, 6.4, 6.2 (7.6), (7.7), (7.9),
(6.6), (6.5)
7.2, 7.4, 7.1, 6.9, 7.5 (7.9), (7.7), (7.6),
(7.3), (8.1) 6-D
(CP)
18.8, 19.2, 21, 5, 17.6, 20.4 (20.2), (23.6), (24.7),
(18.2), (23.6)
20.4, 22.9, 18.3, 19.4, 22.6 (22.2), (24.7), (20.5),
(22.3), (26.3)
16.7, 17.2, 15.4, 15.7, 14.8 (18.5), (19.2), (17.4),
(16.3), (15.1)
7.7, 8.3, 7.4, 6.9, 7.5 (8.1), (8.7), (7.6),
(7.2), (7.8)
7.9, 7.2, 8.5, 8.2, 7.7 (8.8), (7.3), (8.9),
(8.4), (8.1)
8.2, 8.6, 8.9, 7.9, 8.4 (9.1), (8.9), (9.6),
TABLE IIA(ANWESHA:CITE THIS IN TEXT)
COMPARISON OF PERFORMANCE IN TERMS OF HIT RATE FOR FOUR CASES:(A) WITHOUT AID,B)WHILE MAPPING IS PERFORMED FROM PREFRONTAL FEATURES TO JOINT COORDINATES, (C)PLANNING DIRECTLY FROM MOTOR CORTEX AND,(D)WHILE MAPPING IS PERFORMED FROM OCCIPITAL TO PREFRONTAL/PARIETAL
FEATURES TO MOTOR CORTEX FEATURES TO JOINT COORDINATES
Subject
Hit rate (%)
While patients are directly involved to hit
the ball
While mapping is performed from prefrontal features
to joint coordinates
While mapping is performed from
motor cortex features to joint
coordinates
While mapping is performed from
occipital to prefrontal/parietal
features to motor cortex features to joint coordinates
While mapping joint coordinates
directly from compromised parietal and motor
cortex features
Normal 85.4 82.3 84.3 80.2 NA
1-D (OA) 21.2 26.3 40.2 53.8 24.1 2-D (PG) 18.4 22.1 38.1 51.4 21.8 3-D (BS) 11.3 17.4 32.4 48.1 15.2 4-D (PR) 35.4 29.2 54.4 70.4 26.2 5-D (PS) 20.2 26.4 39.2 52.3 23.8 6-D (CP) 24.4 32.1 43.1 57.2 29.3
TABLEIIB(ANWESHA:CITE THIS IN TEXT)
RUNTIMECOMPLEXITYOFEXISTINGANDPROPOSEDTECHNIQUES
Mapping Algorithms
Run time complexity While mapping
is performed from prefrontal features directly
to joint coordinates
(in Sec)
While mapping is performed from
motor cortex features to joint
coordinates (in Sec)
While mapping is performed from
occipital to prefrontal/parietal
features to motor cortex features to joint coordinates
(in Sec)
While mapping joint
coordinates directly from compromised parietal and motor cortex
features (in Sec)
T1FS 4.2 2.4 7.6 6.2
IT2FS 6.4 3.6 9.2 7.3
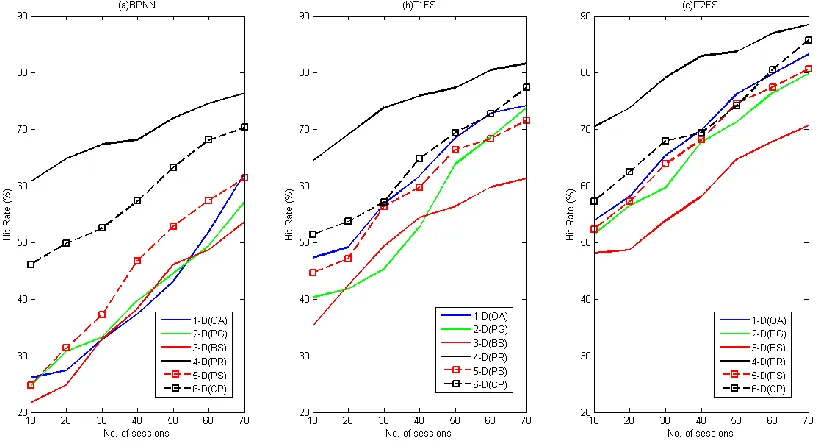
Fig. Hit rate (%) variations over the increases number of sessions for all the six groups of disabled subjects i.e. 1-D (OA), 2-D(PG), 3-D(BS), 4-D(PR), 5-D(PS) and 6-D(CP) depicted for the various mapping algorithms. Blue, green and red lines represents BPNN, T1FS and IT2FS respectively.
Fig. . Hit rate (%) variations over the number of sessions for the three different mapping algorithms (a) BPNN, (b) T1FS and (c) IT2FS. TABLE III
COMPARISON OF TIME TAKEN FOR HIT FOR FOUR CASES:(A) WITHOUT AID,(B)WHILE MAPPING IS PERFORMED FROM PREFRONTAL FEATURES TO JOINT COORDINATES, (C)PLANNING DIRECTLY FROM MOTOR CORTEX AND,(D)WHILE MAPPING IS PERFORMED FROM OCCIPITAL TO PREFRONTAL/PARIETAL FEATURES
TO MOTOR CORTEX FEATURES TO JOINT COORDINATES
Subject
Time taken to hit the ball from the onset of throw for successful hits (in sec)
While patients are directly involved to hit/miss the
ball
While mapping is performed from prefrontal features to joint
coordinates
While mapping is performed from motor cortex features to
joint coordinates
While mapping is performed from
occipital to prefrontal/parietal
features to motor cortex features to joint coordinates
Normal 40.2 (hit) 40.3 40.8 41.6
1-D (OA)
42.2(hit) Miss
42.12 (hit) 42.12(hit)
42.12 (hit) 42.12(hit)
(PG) miss 42.21 (hit) 42.21 (hit) 42.21 (hit) 3-D
(BS)
43.4(hit) Miss
43.13(hit) 43.13(hit)
43.13(hit) 43.13(hit)
43.13(hit) 43.13(hit) 4-D
(PR)
41.3(hit) Miss
41.02 (Hit) 41.02 (Hit)
41.02 (Hit) 41.02 (Hit)
41.02 (Hit) 41.02 (Hit) 5-D
(PS)
42.3 (hit) Miss
42.14(hit) 42.14(hit)
42.14(hit) 42.14(hit)
42.14(hit) 42.14(hit) 6-D
(CP)
42.1 (hit) Miss
41.73 (hit) 41.73 (hit)
41.73 (hit) 41.73 (hit)
41.73 (hit) 41.73 (hit)
The JACO robot arm is then commanded to turn its links accordingly to reach the desired position of the
ball to hit it. The desired coordinate of the end-points of link 1, link 2 and link 3 of JACO robot arm (Fig.
7) are determined by inverse kinematics [100]. The coordinates of the actual end points of the robot are also
determined through measurements. The normalized positional error (NPE), defined by actual positional error (Euclidean distance between desired and actual link end point coordinates) committed, divided by the
corresponding link length, is measured. Table-I provides the results of percentage of normalized positional
errors for the end-points of three links (Link-1: upper arm, Link-2 lower arm, and Link-3: palm) of 10
normal subjects and six diseased groups including five subjects of each group are given in sequence and the
time taken for each link to align itself from initial to the goal position. The percentage calculation is done
by multiplying the normalized positional error by 100. It is clear from the Table that IT2FS NPEs are
relatively smaller than type-1 fuzzy logic based systems, in all cases. It is also observed that the positional
errors and time taken by diseased subjects are more than the normal subjects and IT2FS yielded better
results than its Type-1 counterpart. Table II and III provides the hit rate (i.e., the number of hits to the ball
by the bat divided by a sum of the number of hits and misses) and time taken to hit/miss the ball
respectively for four situations i.e., while patients are directly involved to hit the ball, while mapping is
performed directly from prefrontal features to joint coordinates, while mapping is performed directly from
motor cortex features to joint coordinates, and while mapping is performed from motor cortex features to
joint coordinates. It is observed that the hit rates for disabled subjects are maximum (increased by around
35% on an average with respect to direct hitting of ball by individuals without aid) when the robot arm is
controlled by the joint coordinated predicted from occipital to parietal/prefrontal to motor cortex features.
occipital to parietal/prefrontal to motor cortex features
IV. PERFORMANCE ANALYSIS
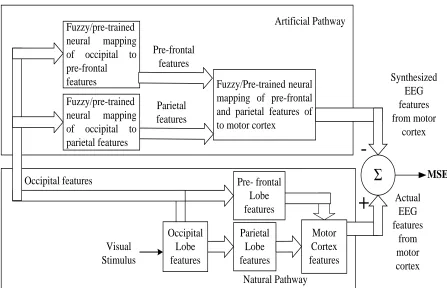
The performance of the proposed system is analyzed with respect to two viewpoints. First, we compare the
mean-square error in the predicted features for type-1 fuzzy, IT2FS and neural [94], [96] (back-propagation algorithm) [74]-[77] realization (see Fig. 7 and Fig. 8), where the mean square error (MSE)is
defined as
21
1
. n
i i
i
MSE t c n
(20)Here, ti= ith target parietal (or motor cortex) EEG feature of a given subject s, and ci= ith computed parietal (or motor cortex) EEG feature of the same subject s. It is observed from TABLE-IV that the mean square error for parietal, prefrontal and motor cortex regions by the IT2FS realization outperforms its
competitors for all subjects. The average time taken for feature prediction by T1FS, IT2FS and BPNN is
0.06ms, 0.078 ms and 0.085 ms respectively.
Second, we compare the performance of the three mapping techniques in presence of noise. Since EEG
signals are often contaminated with noise due to involuntary eye/head movements, poor signal ambience,
cognitively induced noise (such as, parallel undesirable thoughts by the subjects), examining the
performance of the algorithm in presence of noise is very important.
FE
FE FE
Neural Mapping
Neural Mapping
+
- +
-Subject, P2 Same Visual
Stimulus during Training
Occ Par MC Weight
adaptation algorithm
Weight adaptation
algorithm
Fig. 7.Training phase of feature mapping using neural nets (NN)
Fuzzy/pre-trained neural mapping of occipital to parietal features
Fuzzy/Pre-trained neural mapping of pre-frontal and parietal features of to motor cortex
Parietal Lobe features Motor Cortex features
Σ
Parietal features Synthesized EEG features from motor cortex Visual Stimulus Actual EEG features from motor cortex+
-Artificial Pathway Natural Pathway MSE Occipital Lobe features Pre- frontal Lobe features Fuzzy/pre-trainedneural mapping of occipital to pre-frontal features Pre-frontal features Occipital features
Fig. 8. Experimental testing phase of feature mapping using Fuzzy/neural technique
TABLE IV
PERFORMANCE OF IT2FS(T1FS) IN PREDICTING THE FEATURES OF NORMAL SUBJECTS
Subject ID (N-Normal, D-Diseased) Mapping Technique Used Parietal Feature Error (MSE) Prefrontal Feature Error (MES) Motor Cortex Feature Error (MSE) Normal
T1FS 0.3287 0.2957 0.5536 IT2FS 0.0522 0.0496 0.0587 BPNN 0.4671 0.3701 1.2513 1-D
(OA)
T1FS 0.8534 0.9234 1.0102 IT2FS 0.0831 0.0910 0.0923 BPNN 0.8923 0.8843 0.9774 2-D
(PG)
T1FS 0.6572 0.6874 0.7123 IT2FS 0.0781 0.0710 0.7881 BPNN 0.7124 0.7754 0.9512 3-D
(BS)
T1FS 0.6682 0.7122 0.8874 IT2FS 0.0643 0.0711 0.0831 BPNN 0.7681 0.7982 1.0233 4-D
(PR)
T1FS 0.7183 0.7451 0.8921 IT2FS 0.0832 0.0883 0.8921 BPNN 0.8674 0.9163 1.1280 5-D
(PS)
T1FS 0.7013 0.7364 0.7524 IT2FS 0.0683 0.0712 0.0823 BPNN 0.7714 0.7983 1.0702 6-D
(CP)
T1FS 0.6912 0.7284 0.7731 IT2FS 0.0834 0.0881 0.0953 BPNN 0.7274 0.0894 1.0241
TABLE V
Subjects
Additive Gaussian noise
with mean=0 and variance=
Mapping Technique
Positional Link error (%) Time taken for IT2FS
(sec)
L1 L2 L2 L1 L2 L3
Normal
0.5
IT2FS 18.14 22.00 25.28 2.81 2.98 3.31 T1FS 27.25 24.00 29.35 3.09 2.82 3.42 BPNN 30.51 28.70 32.40 2.65 2.83 3.20 2
IT2FS 16.08 20.60 19.05 3.44 3.67 3.81 T1FS 22.45 21.76 23.31 3.23 3.32 3.72 BPNN 20.87 23.97 26.48 3.02 3.18 3.91 4
IT2FS 8.23 8.55 8.88 2.71 2.95 2.90 T1FS 10.56 11.72 10.05 2.98 3.03 3.43 BPNN 13.44 12.00 11.28 3.28 3.83 3.04
Diseased
0.5
IT2FS 32.21 37.52 43.40 6.10 7.31 7.52 T1FS 37.61 38.22 47.91 6.51 6.72 7.81 BPNN 43.20 42.51 47.52 6.52 7.61 7.52 2
IT2FS 25.12 27.32 32.51 7.31 7.91 8.32 T1FS 28.62 29.01 30.02 7.52 7.82 7.81 BPNN 29.51 31.00 34.31 7.61 7.61 8.41 4
IT2FS 18.22 21.22 25.11 8.52 8.82 9.32 T1FS 26.21 28.61 29.12 8.61 8.71 9.51 BPNN 28.42 30.12 33.70 8.90 9.82 9.82
We here examined the effect of noise on the performance of the three realizations (algorithms) by
measuring percentage of positional link errors, when the measured occipital features are induced with
Gaussian noise of zero mean and varying standard deviation. TABLE-V provides the results in positional
link errors when noise variance is set to 0.5, 2.0, and 4.0 which are averaged over all 10 normal and 30
diseases subjects respectively. It is observed from the TABLE-V that in all situations IT2FS outperforms
T1 FS and back-propagation algorithm in positional link errors for all the three links. The results given in
TABLE-V thus confirm that the proposed IT2FS realization carries a significant merit in bypassing the
neural pathways for diseased subjects, and thus has immense scope for practical realization as the next
generation rehabilitative aid. Unfortunately, the nicety of IT2FS in EEG feature prediction has not been
explored in the current literature.
V. DISCUSSION
The objective of the present work is to bypass the damaged/partially damaged regions/lobes in the human
brain by artificial means with a motivation to develop rehabilitative aids to people suffering from
the lost coordination between any two successive brain modules in the signaling pathways [99] used for
visual-motor coordination. Any traditional mapping techniques, including regression, neuro-computational
and the like could have been used to solve the present problem. However, the choice of IT2FS is induced
by the additional merits of fuzzy sets in general and IT2FS in special to eliminate the effect of noise that
may enter into the acquired EEG signals (due to thoughts other than the targeted task) from selected
channels.
Experiments are performed with 30 diseased individuals with partial damage in parietal and/or motor
cortex regions, where these patients are asked to hit a ball thrown from a distance of 20 feet at low speed
(2 feet/second approximately). The motivation of the experiment is to study the normal coordination in
their brain between each two modules lying on the signaling pathways used to perform visual-motor
coordination. It is observed that success rate in hit is only 35% on an average when experimented with
subjects with partial parietal and or motor cortex failures. The experiment, however, gave a success rate
over 84% when performed with 10 healthy subjects. The high failure rate in hit by the patients with partial
parietal, prefrontal and/or motor cortex inspired us to generate motor cortex features from the occipital
features of these subjects by an IT2FS based mapping from occipital features to pre-frontal/parietal features
and next from parietal and pre-frontal features to motor cortex features. The mapping is developed from
successful trials of the subjects, i.e., when they could hit the ball properly.
The last part of the experimental set-up is developed to engage a robot to hit the ball for a patient. While
the patient engages himself in watching the throw and trajectory of the ball, the occipital EEG signals are
acquired and relevant features are extracted and then using the mapping policy introduced above the motor
cortex features are extracted. Finally, one more mapping is required to determine the joint coordinates of
the robot holding a bat to orient itself properly to hit the flying ball. The mapping is developed with the
measured parietal features and joint coordinates of the right hand of the subject, obtained from a Kinect
hit the ball. Although a better arrangement could be the orientation of the palm (to control the in- and
out-swings of the palm), the present Kinect based scheme, however, cannot serve the problem.
It is interesting to note that the artificial mapping used to generate joint coordinates directly from the
occipital region yields less link error and execution time in comparison to the link errors obtained while
mapping from prefrontal region, motor cortex to joint coordinates or direct playing by the diseased
subjects. Consequently, the mapping of joint coordinates from occipital to prefrontal and parietal to motor
cortex features increases the hit rate by additional 35% with respect to the hit rate when subjects are
directly involved in hitting the ball. On the other hand, the hit rate merely increases by 5 % and 20 % when
mapping is performed directly from prefrontal and motor cortex to joint coordinates respectively with
respect to subjects’ direct hitting of the ball without aid. [Anwesha: Please add comparisons with some
References, indicating them in [] box. This is very important.]
VI. CONCLUSION
Sensory-motor coordination remained an open area of active research for the next generation BCI
applications. This paper introduces a novel approach to visual-motor coordination with a possible emphasis
to rehabilitate patients with partial failure in such coordination. Considering the well-known functional
architecture of the brain, this paper attempts to develop an artificial mapping between the features
generated from two active brain regions/lobes during the execution of visual-motor coordination phase. The
conventional functionality of occipital, parietal, prefrontal and motor-cortex regions in visual signal
processing, planning and decision making and motor execution respectively is presumed, and a mapping of
the responses from occipital to parietal and prefrontal, and next prefrontal/parietal to motor cortex is
developed using Type-1 fuzzy, IT2FS and neural techniques.
IT2FS being more robust to noise, in comparison to its Type-1 counterpart and neural networks, has been
selected to perform the mapping. Experiments undertaken reveal that the IT2FS based mapping yields
Neural back-propagation scheme, which has wider application in function approximation has been used
here as a reference model to supplement the proposed fuzzy techniques. However, experiments undertaken
confirm that although the neural approach has comparable performance in occipital to parietal/motor cortex
feature mapping, it performs poorly in presence of noise in the EEG features. As infiltration of noise in
EEG cannot be prevented, the proposed Type-2 fuzzy mapping technique seems to have immense
importance with respect to neural and type-1 fuzzy mapping techniques. Experiments undertaken also
confirm the above results.
Experimental results further reveal that direct mapping of prefrontal and motor cortex features to joint
coordinates results in a miss for a maximum of 83% and 68% respectively for diseased subjects, which,
however, can be reduced to 48% by an automatic mapping from occipital features to parietal/prefrontal
features to motor cortex to joint coordinates. Here lies the importance of the proposed technique. The
principles adopted in the paper can be used in the next generation rehabilitative aids for people with partial
visual-motor coordination impairment.
ACKNOWLEDGEMENT
The authors gratefully acknowledge the funding they received from University Grants Commission
(UGC) to pursue this research under UGC-UPE-II program in cognitive science. The first author also
acknowledges the funding she received from CSIR, India in pursuance of her Ph.D. (Engineering) degree at
Jadavpur University, Calcutta, India.
REFERENCES
[1] H. Dandan, Q. Kai, F. Ding-Yu, J. Wenchuan, C. Xuedong and B. Ou, "Electroencephalography (EEG)-Based Brain Computer Interface (BCI): A 2-D Virtual Wheelchair Control Based on Event-Related Desynchronization/Synchronization and State Control," IEEE Trans. Neural Systems and Rehabilitation Engineering, vol. 20, pp. 379-388, 2012.
[3] C. Escolano, J.M. Antelis and J. Minguez, "A Telepresence Mobile Robot Controlled With a Noninvasive Brain Computer Interface," IEEE Trans. Systems, Man, and Cybernetics, Part B: Cybernetics, vol. 42, pp. 793-804, 2012
[4] Y. Takata, M. Saeki, J. Izawa, K. Takeda, Y. Otaka, K. Ito and T. Kondo, "Analysis of key factors on ERD production for BCI neuro-robotic rehabilitation," in 4th IEEE RAS & EMBS International Conference on Biomedical Robotics and Biomechatronics (BioRob), pp. 240-245, 2012.
[5] M. Sarac, E. Koyas, A. Erdogan, M. Cetin and V. Patoglu, "Brain Computer Interface based robotic rehabilitation with online modification of task speed," in 2013 IEEE International Conference on Rehabilitation Robotics (ICORR), pp. 1-7, 2013.
[6] J.N. Kornegay, “Alzheimer’s Paraparesis (paraplegia), tetraparesis (tetraplegia), urinary/fecal incontinence. Spinal cord diseases,” in Probl Vet. Med., vol. 3 (3), pp. 363-377, 1991.
[7] B.B. Johansson, “Brain plasticity and stroke rehabilitation,” in Stroke, vol. 31, pp. 2230-230, 2000.
[8] M.T. Perenin and A. Vighetto, “Optic ataxia: a specific disruption in visual-motor mechanisms. Different aspects of the deficit in reaching for objects,” in Brain, vol. 111(3), pp. 643-674, 1988.
[9] E.J. Hwang, M. Hauschild, M. Wilkie and R.A. Andersen, “Inactivation of parietal reach region causes optic ataxia, impairing reaches but not saccades,” in Neuron, Elsevier, vol. 76, pp. 1021-1029, 2012.
[10]M. Rizzo, “Balint’s syndrome and associated visual-spatial disorders,” in Baillieres Clinical Neurology, vol. 2(2), pp. 415-437, 1993.
[11]A. Hasan, T. Bergener, M.A. Nitsche, W. Strube, T. Bunse, P. Falkai and T. Wobrock, “Impairment of motor cortex responses to unilateral and bilateral direct current stimulation in schizophrenia,” in Frontiers in Psychiatry, vol. 4, 2013. [12]S. Bhattacharyya, A. Sengupta, T. Chakraborti, A. Konar and D.N. Tibarewala, "Automatic feature selection of motor
imagery EEG signals using differential evolution and learning automata," Medical & Biological Engineering & Computing, Springer, pp. 1-9, 2013.
[13]A. Khasnobish, S. Bhattacharyya, A. Konar, D.N. Tibarewala and A.K. Nagar, "A Two-fold classification for composite decision about localized arm movement from EEG by SVM and QDA techniques," in The 2011 International Joint Conference on Neural Networks (IJCNN), pp. 1344-1351, 2011.
[14]T. M. Rutkowski, A. Cichocki, T. Tanaka, D.P. Mandic, C. Jianting and A.L. Ralescu, "Multichannel spectral pattern separation - An EEG processing application," in IEEE International Conference on Acoustics, Speech and Signal Processing, 2009 (ICASSP), pp. 373-376, 2009.
[15]N. Hiroshi and A. L. Ralescu, "Implementation of fuzzy systems using multilayered neural network," in IEEE International Conference on Neural Networks, vol.1, pp. 317-322, 1993.
[16]S. Visa and A. Ralescu, "A fuzzy classifier for imbalanced and noisy data," in IEEE International Conference on Fuzzy Systems, vol.3, pp. 1727-1732, 2004.
[18]J. M. Garibaldi and T. Ozen, "Uncertain Fuzzy Reasoning: A Case Study in Modelling Expert Decision Making," IEEE Trans. Fuzzy Systems, vol. 15, pp. 16-30, 2007.
[19]A. B. Cara, C. Wagner, H. Hagras, H. Pomares and I. Rojas, "Multiobjective Optimization and Comparison of Nonsingleton Type-1 and Singleton Interval Type-2 Fuzzy Logic Systems," IEEE Trans. Fuzzy Systems, vol. 21, pp. 459-476, 2013. [20]R. A. Francelin and F. A. C. Gomide, "A neural network for fuzzy decision making problems," in Second IEEE
International Conference on Fuzzy Systems, vol. 1, pp. 655-660, 1993.
[21]F. J. Lin, S. Y. Chen, P. H. Chou, and P. H. Shieh, “Interval Type-2 Fuzzy Neural Network Control for X-Y-Theta Motion Control Stage Using Linear Ultrasonic Motors,” Neurocomputing, vol. 72, pp. 1138-1151, 2008.
[22]A. Lemos, W. Caminhas and F. Gomide, "Evolving fuzzy linear regression trees," in IEEE International Conference on Fuzzy Systems (FUZZ), pp. 1-8, 2010.
[23]L. Faa-Jeng, L. Chih-Hong and S. Po-Hung, "Self-constructing fuzzy neural network speed controller for permanent-magnet synchronous motor drive," IEEE Trans. Fuzzy Systems, vol. 9, pp. 751-759, 2001.
[24]G. Nakamiti, R. Freitas, J. Prado and F. Gomide, "Fuzzy distributed artificial intelligence systems," in Fuzzy Systems, IEEE World Congress on Computational Intelligence., vol. 1, pp. 462-467, 1994.
[25]B. Garg, M.M.S. Beg and A.Q. Ansari, "Fuzzy time series model to forecast rice production," in IEEE International Conference onFuzzy Systems (FUZZ), pp. 1-8, 2013.
[26]L. A. Zadeh, “The concept of a linguistic variable and its application to approximate reasoning-I,” Inform. Sci., vol. 8, pp. 199–249, 1975.
[27]J. M. Mendel and R. B. John, "Type-2 fuzzy sets made simple," IEEE Trans. Fuzzy Systems, vol. 10, pp. 117-127, 2002. [28]N. N. Karnik and J. M. Mendel, "Introduction to type-2 fuzzy logic systems," in IEEE World Congress on Computational
Intelligence., pp. 915-920, 1998.
[29]L. Qilian and J. M. Mendel, "Interval type-2 fuzzy logic systems: theory and design," IEEE Trans. Fuzzy Systems, vol. 8, pp. 535-550, 2000.
[30]W. Hongwei and J. M. Mendel, "Uncertainty bounds and their use in the design of interval type-2 fuzzy logic systems,"
IEEE Trans. Fuzzy Systems, vol. 10, pp. 622-639, 2002.
[31]J. M. Mendel and W. Hongwei, "Type-2 Fuzzistics for Symmetric Interval Type-2 Fuzzy Sets: Part 1, Forward Problems,"
IEEE Trans. Fuzzy Systems, vol. 14, pp. 781-792, 2006.
[32]J. M. Mendel and W. Hongwei, "Type-2 Fuzzistics for Symmetric Interval Type-2 Fuzzy Sets: Part 2, Inverse Problems,"
IEEE Trans. Fuzzy Systems, vol. 15, pp. 301-308, 2007.
[33]J. M. Mendel and R. I. John, “Type-2 fuzzy sets made simple,” IEEE Trans. on Fuzzy Systems, vol. 10, pp. 117–127, Apr. 2002.
[35]Q. Liang, N. N. Karnik, and J. M. Mendel, “Connection admission control in ATM networks using survey-based type-2 fuzzy logic systems,” IEEE Trans. Syst., Man, Cybern. C, vol. 30, pp. 329–339, Aug. 2000.
[36]L. Qilian and J. M. Mendel, "Equalization of nonlinear time-varying channels using type-2 fuzzy adaptive filters," IEEE Trans. Fuzzy Systems, on, vol. 8, pp. 551-563, 2000.
[37]J. M. Mendel, “Fuzzy sets for words: A new beginning,” in Proc. Of IEEE Int’l. Conf. on Fuzzy Systems, St. Louis, MO, pp. 37–42, May 2003.
[38]H. Hagras, “A hierarchical type-2 fuzzy logic control architecture for autonomous mobile robots,” IEEE Trans. Fuzzy Syst., vol. 12, no. 4, pp. 524–539, Aug. 2004.
[39]H. Hagras, “Type-2 FLCs: A new generation of fuzzy controllers,” IEEE Comput. Intell. Magazine, vol. 2, no. 1, pp. 30–43, Feb. 2007.
[40]D. Wu and J. M. Mendel, "A vector similarity measure for linguistic approximation: Interval type-2 and type-1 fuzzy sets,"
Information Sciences, vol. 178, pp. 381-402, 2008.
[41]W. Dongrui, "On the Fundamental Differences between Interval Type-2 and Type-1 Fuzzy Logic Controllers," IEEE Trans. Fuzzy Systems, vol. 20, pp. 832-848, 2012.
[42]T. Bilgic and I. B. Turksen, “Measurement of membership functions: Theoretical and empirical work,” in Handbook of Fuzzy Systems: Foundations, D. Dubois and H. Prade, Eds. Boston, MA: Kluwer, vol. 1, pp. 195–228, 2000.
[43]A. Doumanoglou, S. Asteriadis, D.S. Alexiadis, D. S., D. Zarpalas and P. Daras, "A dataset of Kinect-based 3D scans," in
IEEE 11thIVMSP Workshop, 2013, pp. 1-4, 2013.
[44]M. Draelos, N. Deshpande and E. Grant, "The Kinect up close: Adaptations for short-range imaging," in IEE