Mapping and QTL analysis of the barley population Alexis × Sloop
7
0
0
Full text
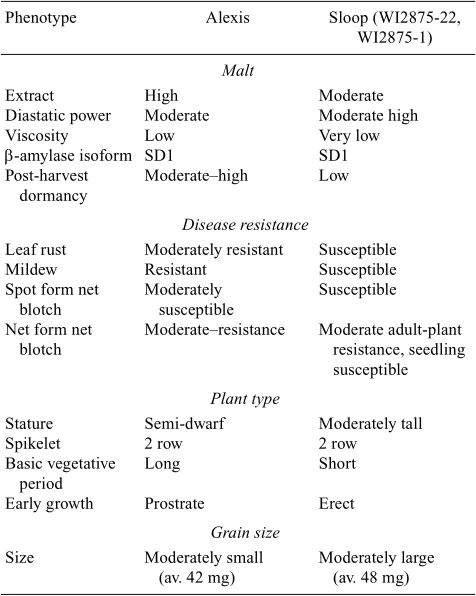
(2) 1118. Australian Journal of Agricultural Research. Table 1. Comparison of Alexis and Sloop (WI2875-22, WI2875-1) for key traits when grown under South Australian conditions Phenotype. Alexis. Sloop (WI2875-22, WI2875-1). Malt Extract Diastatic power Viscosity β-amylase isoform Post-harvest dormancy Leaf rust Mildew Spot form net blotch Net form net blotch. Stature Spikelet Basic vegetative period Early growth Size. High Moderate Low SD1 Moderate–high. Moderate Moderate high Very low SD1 Low. Disease resistance Moderately resistant Resistant Moderately susceptible Moderate–resistance. Susceptible Susceptible Susceptible Moderate adult-plant resistance, seedling susceptible. Plant type Semi-dwarf 2 row Long. Moderately tall 2 row Short. Prostrate. Erect. Grain size Moderately small (av. 42 mg). Moderately large (av. 48 mg). Population construction Initially, the cross WI2875-1 × Alexis was made at the Waite Campus in 1994. The population was progressed through F2 and F3 by single-seed descent. Two hundred recombinant inbred lines (RIL) were derived from F4 single seeds. These were multiplied in 2-row by 4-m plots in 1998, to provide seed for the NBMMP field experiments in 1999 and 2000. In Western Australia, the cross Alexis × Sloop (WI2875-22) was made in 1996 and the doubled haploid (DH) lines were produced from F1 donor plants using the anther culture method in 1997 (S. Broughton and P. Priest, Western Australian Department of Agriculture, pers. comm.). Hence, of the 264 individuals chosen for map construction and phenotyping, 153 were RIL from WI2875-1 × Alexis and 111 were DH lines from Alexis × Sloop. Table 2 shows markers used in construction of maps. Construction of map RFLP analysis Plant DNA extraction was by a DNA mini-prep method adapted from Rogowsky et al. (1991). Restriction endonuclease digestion and Southern hybridisation followed standard methods. Total genomic DNA was digested with BamHI, DraI, EcoRI, EcoRV, HindIII, and XbaI.. A. R. Barr et al.. Table 2.. Markers used in construction of maps. Marker type AFLP RFLP SSR (Uni. of Adelaide) SSR (SCRI) Other Total. Doubled haploids. Recombinant inbred lines. 187 053 005 045 001 291. 177 051 000 045 001 274. Deoxyribonucleic acid clones used as probes to detect restriction fragment length polymorphisms (RFLPs) were obtained through the Australian Triticeae Mapping Initiative (P. Sharp, University of Sydney) and from the repository of the International Triticeae Mapping Initiative. RFLP markers are typically designated Xabc, Xabg, Xawbma, Xbcd, Xbg, Xcdo, Xmwg, Xksu, Xpsr, XpTAG, Xwg. Simple sequence repeat (SSR) analysis Microsatellite markers were obtained from the published sequences of Maroof et al. (1994), Becker et al. (1995), Liu et al. (1996), Struss and Plieske (1998), Pillen et al. (2000), and Ramsay et al. (2000). Twelve new SSR markers prefixed Xawbms (Adelaide Waite Barley Microsatellite) were developed by Karakousis (2002). Most markers were chosen on the basis that they mapped to a single locus and gave high quality polymerase chain reaction (PCR) results. SSR markers are typically designated Xawbms, Xbmac, Xbmag, XEBmag, XEBmatc, Xgms, and XHV. PCR amplification and electrophoresis of microsatellites are described in Ramsey et al. (2000) or using the methods described by Karakousis et al. (2003, this issue) and Ablett et al. (2003, this issue). In brief, amplification was performed by a standard thermal cycling profile or by touchdown-PCR (Don et al. 1991). Separation of PCR products was performed on agarose gels, polyacrylamide gels, or by capillary electrophoresis. Adapters and primers used in amplified fragment length polymorphism (AFLP) analysis The AFLP method developed by Vos et al. (1995) was followed with some modifications. Genomic DNA (1 mg) was digested with the restriction endonucleases PstI and MseI and double-stranded PstI and MseI adaptors were ligated to the ends of the restriction fragments. Pre-amplification was performed using primers specific for the PstI and MseI adaptors, including one selective nucleotide, followed by selective amplification using similar primers with 3 selective bases. The pre-amplification mix was diluted 1:5 in water before being used in the selective amplification step. Pre-amplification PCR conditions consisted of 20 cycles of 94°C for 30 s, 56°C for 1 min, and 72°C for 1 min. PCR reaction conditions for selective.
(3) 300. 250. 200. 150. 100. 50. 0. 1H. Distance cM. XP14/M49-91. XP13/M47-163. XP11/M48-345. Xabg458. X7SGLOB. Xbcd304. Xwg996b. XP14/M49-139. XBmac154. XEBmac501. XksuD14b. XP12/M50-94. XP13/M61-164. XP14/M49-70. Xbcd22. XP12/M51-81. XksuE18. XBmac213. Xhor1. XP14/M60-95. XP14/M61-92. XP14/M48-363. XAC-CCC181. XP13/M55-308. XksuD14a. 2H. Fig. 1.. XP14/M47-275 XP13/M54-318 XP13/M54-107 AT-CTT238 XP14/M48-279 XP14/M59-287 XP13/M55-306 XP13/M61-101 XP12/M50-241 XP13/M47-275 Xwg516 XP13/M49-172 XP13/M48-123 Xhvm36 XP14/M48-94 XP13/M47-399 Xabg2 XP12/M50-199 XP14/M59-176 XP14/M48-332 XP13/M54-224 XP12/M51-265 XP12/M51-270 Xpsr131 XP13/M62-133 XBmac640 XBmac607 XBmac623 XP14/M60-371 XBmag518 XBmac93 XBmac684 XBmag114 XP12/M51-344 XP14/M55-351 XP14/M59-233 XP13/M49-59 XP13/M59-288 XBmag378 Xabg14 XP13/M47-192 Xcdo474 XP14/M60-299 XBmag125 XP14/M61-111 XP14/M51-203 Xawbma21 XP14/M49-237 XP13/M59-275 XP14/M59-226 Xcdo665A XP11/M51-170 XP13/M59-256 XP13/M59-266 XP12/M51-157 XBmac415 Xhvm54 XP13/M50-203 XP14/M60-94 XP13/M47-256 XP14/M47-378 XP13/M50-127 XP12/M54-94 XksuF41 X43TH1d7.seq Xabc171B Xbcd292 Xcdo36 XP14/M61-348 XP14/M55-156 Xwg645 Xbg123 XP12/M54-97 XP14/M51-114 XP13/M51-237. 4H. XBmag419. XHvMLOHIA. Xcdo63. XP11/M48-119. XTacMD. XHvBTA13. Xwg719. XP12/M50-292. XP13/M61-318. XP13/M51-252. XP13/M50-110. XP13/M51-90. XBmac181. XBmag375. XBmac906. Xgms089. XP11/M48-307. Xcdo669. Xhvm40. XP13/M51-340. XP14/M51-302. 5H. Xabg705a XP13/M51-127 XP14/M51-294 Xpsr326 XP14/M51-201 XP13/M49-211 XP13/M54-356 Xbcd276 XBmac286 XBmag387 XP13/M48-180 XBmac113 XP14/M55-370 XP14/M61-98 XBmac96 Xmcg001.B10 XBmag337 XP13/M58-239 XBmag223 XP13/M59-224 XP12/M54-118 XP14/M48-123 Xpsr637 XP14/M55-135 Xcdo400 XP14/M55-146 Xabg3 Xabg712 Xgms61 XP14/M49-171 Xbcd265 XP13/M61-198 XP13/M62-224 Xgms27 XP13/M61-386 XP13/M61-388 XP13/M50-305 XP14/M48-195 XBmag222 XP13/M59-191 XSerpinZ7 XP13/M55-131 XP14/M51-211 XP11/M51-333 XP11/M62-179 Xmcg002.G11 XP14/M48-197 Xabc310 XP13/M51-349 XP13/M59-186 XP13/M59-69 XP12/M50-298 XP13/M51-199 XP13/M50-252 XP11/M51-215 XP11/M51-193. Linkage map derived from the doubled haploid Alexis × Sloop lines.. 3H. XP11/M62-224 XP12/M51-259. XP14/M47-166 XP14/M61-242 XP11/M62-183. XBmac708 XP11/M48-241. XP11/M51-99 XP13/M61-245 Xbcd131b XP12/M61-226. Xbcd131a Xabg705b. XP14/M61-154 XP13/M50-331 Xabg4 XBmag13. XBmag225. XP14/M48-216 Xgms116. XP12/M50-328 XBmac67. XBmag0131. XP11/M62-261 XP12/M51-320. XP14/M55-265. XP14/M47-64 Xabc171a XP13/M59-132 XP13/M62-196 Xabg471. 6H. Xpsr666 XP12/M51-191 XP13/M48-254 Xpsr899 Xbcd342 XBmac316 XP13/M50-120 XP13/M55-94 XP14/M61-62 XP13/M50-367 XBmac874 XP13/M61-357 XP13/M61-272 XP13/M51-205 Xbcd269 XP22/M58-151 XP13/M49-101 Xcmwg669 Xhwm001.f10 XHvclI XP14/M51-166 XP14/M47-197 XP14/M51-308 XP11/M62-390 XP13/M61-216 Xwg622 XP13/M61-328. 7H. XP12/M51-73 XP11/M62-141 XP13/M51-134 Xabg704 XP13/M61-73 XP14/M47-278 XP14/M47-357 XP13/M50-272 XP13/M51-264 XP14/M47-315 XP14/M61-138 XP14/M60-191 Xbcd129 XP13/M48-208 XP11/M62-353 XP13/M48-85 XP12/M51-121 XP11/M51-341 XP13/M50-237 XBmag206 XPc-B4e Xwg789 X55TH2e7.seq XP12/M51-148 XP13/M51-107 XP14/M47-164 XP14/M59-167 XP14/M60-133 XSSS1 Xld XP13/M59-110 XHvCMA Xcdo665b XHvSS1 XP12/M51-200 XP11/M48-367 XP14/M48-150 XP12/M54-56 XHvA22S XBmac31 XP14/M59-215 Xbcd147 XBmag359 XBmac827 XBmac167 XBmag507 XP14/M55-102 XBmac764 Xwg996a XP14/M60-154 XP14/M60-177 XP12/M50-223 XP11/M51-163 XP14/M49-187 XP12/M51-360 XP13/M59-309 XP13/M59-277 XP13/M59-118 XP14/M47-355 XP13/M51-203 XP13/M50-102 XBmac755 XP13/M47-300 XP14/M55-130 XP11/M51-161 XBmag135 XP14/M55-344. Mapping and QTL analysis of Alexis × Sloop Australian Journal of Agricultural Research 1119.
(4) 1H. XP14/M49-91. XP13/M47-163. XP11/M48-345. Xabg458. XP14/M49-139. Xwg996b. XBmac0154. XBmac0501. XksuD14B. XP12/M50-94. XP13/M61-164. XP14/M49-70. XP13/M62-388. Xbcd22. XP12/M51-81. XksuE18. XBmac0213. XHor1. XP14/M60-95. XP14/M48-363. XksuD14A. XP13/M55-308. XP14/M61-92. XAC-CCC181. Fig. 2.. 2H. 3H. XP13/M62-257. XP12/M51-259. XP11/M62-183. XP11/M62-224. XP14/M47-166. XP11/M48-241. XP14/M61-242. XBmac0708. XP12/M61-226. Xbcd131(B). XP13/M61-245. XP11/M51-99. Xabg705B. Xbcd131(A). XBmag0013. Xabg4. XP14/M61-154. XBmag0225. Xgms116. XP14/M48-216. Xwg178. XBmac0067. XBmag0131. XP11/M62-261. XP12/M51-320. Xabg471. XP14/M55-265. XP13/M62-196. XP13/M59-132. Xabc171A. XP14/M47-64. 4H. XBmag0419. Xcdo63. XP11/M48-119. Xwg719. XP12/M50-292. XP13/M61-318. XP13/M51-252. XP13/M51-90. XBmag0375. XBmac0906. XBmac0181. Xgms089. XP11/M48-307. Xhvm40. Xcdo669. XP13/M51-340. XP14/M51-302. 5H. XP13/M51-127 Xabg705A XP14/M51-294 Xpsr326 XP14/M51-201 Xbcd276 XP14/M55-370 XP13/M48-180 XP14/M61-98 XP13/M49-211 XP13/M54-356 XBmag0387 XBmac0286 XBmac0113 XBmac0096 XBmag0337 XBmag0223 XP12/M54-118 XP13/M59-224 XP14/M51-434 Xpsr637 Xcdo400 XP14/M55-135 XP14/M55-146 Xabg3 Xbcd265 Xabg712 Xgms061 XP14/M49-171 XP13/M61-198 XP13/M62-224 XP13/M61-386 XP13/M61-388 XP13/M50-305 XP13/M54-207 XP14/M48-195 XBmag0222 XP13/M59-191 XSerpinZ7 XP14/M51-211 XP13/M55-131 XP11/M51-333 Xmcg002.G11 XP11/M62-179 XP13/M51-349 Xabc310 XP14/M48-197 XP13/M59-186 XP13/M59-69 XP12/M50-298 XP13/M51-199 XP11/M51-215 XP13/M62-421 XP11/M51-193. Linkage map derived from the recombinant inbred Alexis × Sloop-sib (WI2875-1) lines.. XP13/M51-237. XP12/M54-97 XP14/M51-114. XP14/M61-348 Xwg645 Xbg123. Xbcd292 Xcdo36. XksuF41 X43TH1d7.seq Xabc171B. XP12/M54-94. XP14/M47-275 XP13/M54-318 XP13/M54-107 AT-CTT238 XP14/M48-279 XP14/M59-287 XP13/M55-306 XP13/M61-101 XP12/M50-241 XP13/M47-275 Xwg516 XP13/M49-172 XP13/M48-123 Xhvm36 XP14/M48-94 XP13/M47-399 Xabg2 XP12/M50-199 XP14/M59-176 XP14/M48-332 XP13/M54-224 XP12/M51-265 XP12/M51-270 XP13/M62-354 Xpsr131 XP13/M62-133 XBmac0640 XBmac0607 XBmac0623 XBmag0518 XBmac0093 XBmac0684 XBmag0114 XP12/M51-344 XP14/M55-351 XP14/M59-233 XP13/M49-59 XP13/M59-288 XBmag0378 Xabg14 XP13/M47-192 Xcdo474 XBmag0125 XP14/M61-111 XP14/M51-203 Xawbma21 XP14/M49-237 XP13/M59-275 XP14/M59-226 Xcdo665A XP11/M51-170 XP13/M59-256 XP13/M59-266 XP12/M51-157 XEBmac0415 Xhvm54 XP13/M50-203 XP14/M60-94 XP13/M47-256. 6H. Xwg622. XP11/M62-390. XP13/M61-216. XP13/M61-328. XP14/M51-308. XP14/M47-197. XP14/M51-166. Xhwm001.f10. XcMwg669. XP13/M49-101. Xbcd269. GT-CGT151. XP13/M51-205. XP13/M61-272. XP13/M61-357. XBmac0874. XP14/M61-62. XP13/M55-94. XP13/M50-120. XBmac0316. Xpsr899. Xbcd342. XP13/M48-254. XP12/M51-191. Xpsr666. 7H. Xabg704 XP12/M51-73 XP14/M47-278 XP13/M51-134 XP14/M47-357 XP13/M51-264 XP14/M47-315 XP13/M61-73 XP11/M62-141 XP14/M61-138 XP14/M60-191 XP13/M48-85 Xbcd129 XP13/M48-208 XP11/M62-353 XP12/M51-121 XBmag0206 XPc-B4e XP11/M51-341 Xwg789 XP12/M51-148 XP13/M51-107 55TH2e7.seq XP14/M47-164 XP14/M59-167 XP14/M60-133 Xsss1 Xiso-amylase XlimDex XP13/M59-110 XP12/M51-200 Xcdo665B XHvCMA XP14/M48-150 XP11/M48-367 XP12/M54-56 XP14/M59-215 XBmac0031 XBmag0359 XBmac0827 XBmac0167 XBmag0507 XP14/M55-102 XP14/M60-177 XP14/M60-154 XP11/M51-163 XP12/M50-223 XP13/M59-309 XP12/M51-360 XP14/M49-187 XP13/M51-203 XP13/M59-118 XP14/M47-355 XBmac0755 Xwg420 XP13/M47-300 XP14/M55-130 XP11/M51-161 XP14/M55-344 XBmag0135. Australian Journal of Agricultural Research. 350. 300. 250. 200. 150. 100. 50. 0. Distance cM. 1120 A. R. Barr et al..
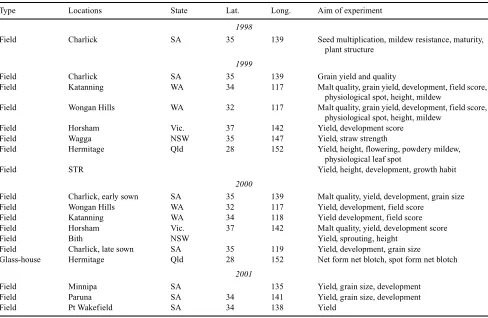
(5) Mapping and QTL analysis of Alexis × Sloop. Table 3. Type. Locations. Australian Journal of Agricultural Research. 1121. Experiments conducted with the Alexis × Sloop population State. Lat.. Long.. Aim of experiment. 139. Seed multiplication, mildew resistance, maturity, plant structure Grain yield and quality Malt quality, grain yield, development, field score, physiological spot, height, mildew Malt quality, grain yield, development, field score, physiological spot, height, mildew Yield, development score Yield, straw strength Yield, height, flowering, powdery mildew, physiological leaf spot Yield, height, development, growth habit. 1998 Field. Charlick. SA. 35. Field Field. Charlick Katanning. SA WA. 35 34. 139 117. Field. Wongan Hills. WA. 32. 117. Field Field Field. Horsham Wagga Hermitage. Vic. NSW Qld. 37 35 28. 142 147 152. Field. STR. Field Field Field Field Field Field Glass-house. Charlick, early sown Wongan Hills Katanning Horsham Bith Charlick, late sown Hermitage. SA WA WA Vic. NSW SA Qld. 35 32 34 37. 139 117 118 142. 35 28. 119 152. Malt quality, yield, development, grain size Yield, development, field score Yield development, field score Malt quality, yield, development score Yield, sprouting, height Yield, development, grain size Net form net blotch, spot form net blotch. Field Field Field. Minnipa Paruna Pt Wakefield. SA SA SA. 135 141 138. Yield, grain size, development Yield, grain size, development Yield. 1999. 2000. 2001 34 34. amplification consisted of one cycle at 94°C for 30 s, 65°C for 30 s, and 72°C for 1 min, followed by 9 cycles over which the annealing temperature was decreased by 1°C per cycle with a final step of 25 cycles of 94°C for 30 s, 56°C for 30 s, and 72°C for 1 min. Three alternative protocols were used for visualisation of AFLP products. These were silver staining, radio-labelling with [γ32P] ATP, or fluorescent tagging of the oligonucleotide primers. Silver staining was carried out as described by Bassam and Caetano-Annollés (1993). For radio-labelling, the PstI primer used in selective amplification was end-labelled with [γ32P] ATP and T4 polynucleotide kinase. Amplified fragments were separated on 6% denaturing polyacrylamide gels. The gels were transferred to 3MM paper for drying and autoradiography was carried out with Fuji RX medical X-ray film at room temperature for 24–48 h. For multifluorophore fragment analysis, PstI primers were either labelled with 6-carboxy-fluorescein (6-FAM), tetrachloro-fluorescein (TET), or hexachloro-fluorescein (HEX), whereas the MseI primer was unlabelled. One µL of each of the labelled PCR products was pooled. The combined sample was dried then mixed with 0.25 µL of a N,N ,N´,N ´-tetramethyl-6-carboxyrho-damin (TAMRA)-. labelled internal length standard GeneScan-500 TAMRA (PE/Applied Biosystems) and 1.75 µL of formamide, denatured for 3 min at 90°C, and quickly chilled on ice. Electrophoresis of samples was carried out on 6% denaturing polyacrylamide gels in an ABI Prism 373XL DNA sequencer (PE/Applied Biosystems). For raw data collection, the ABI Prism Collection Software version I.I was employed. AFLP fragment analysis was performed with GeneScan analysis software version 3.1 (PE/Applied Biosystems), as described in the user’s manuals. The nomenclature for an AFLP marker is derived from the enzyme combination, the primer combinations, and the relative molecular weight of the product. KeyGene provides the standard list of AFLP nomenclature at the following web address: http://wheat.pw. usda.gov/ggpages/keygeneAFLPs.html. Linkage map construction To maintain data quality, all molecular marker data were scored independently by at least 2 individuals. Data obtained from scoring segregation patterns of DNA markers among the DH and RI populations were analysed using MapManager QT (versions QTb27ppc and QTb28ppc, Manly and Cudmore 1997) using the Kosambi mapping.
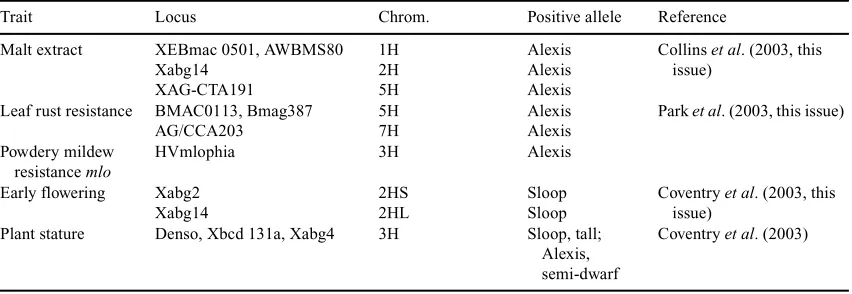
(6) 1122. Australian Journal of Agricultural Research. Table 4.. A. R. Barr et al.. Key trait–marker associations implemented in Australian Breeding programs. Trait. Locus. Chrom.. Positive allele. Reference. Malt extract. XEBmac 0501, AWBMS80 Xabg14 XAG-CTA191 BMAC0113, Bmag387 AG/CCA203 HVmlophia. 1H 2H 5H 5H 7H 3H. Alexis Alexis Alexis Alexis Alexis Alexis. Collins et al. (2003, this issue). Xabg2 Xabg14 Denso, Xbcd 131a, Xabg4. 2HS 2HL 3H. Sloop Sloop Sloop, tall; Alexis, semi-dwarf. Leaf rust resistance Powdery mildew resistance mlo Early flowering Plant stature. function (Kosambi 1944; Lander et al. 1987). Initial linkage groups were constructed using the ‘rearrange report’ function to determine the best order of the loci at a threshold value of P = 0.001. Subsequent markers were then integrated using the ‘find best location’ function. The number of double crossover events was then calculated for each linkage group, i.e. parental scores, which are flanked by alternative scores of the alternative parent (Säll and Nilsson 1994). Where an excess of 5 double crossover events were identified, the segregation data were re-inspected and, if necessary, corrected. Cross-referencing markers to published maps allowed the assignment of linkage groups to chromosomes. The maps for both the DH and recombinant inbred lines are shown in Figs 1 and 2, respectively.. Park et al. (2003, this issue). Coventry et al. (2003, this issue) Coventry et al. (2003). Validation Two major studies have been conducted to validate the effect of alleles identified from Alexis × Sloop. They involve the Alexis alleles associated with malt extract (Collins et al. 2003, this issue) and the effects of 3 loci controlling days to heading/photoperiod response on grain yield and stability (Coventry et al. 2003, this issue). These studies confirm that loci of crucial importance to breeding malting barley for Australian conditions were identified in this population. Implementation The most important traits identified in the Alexis × Sloop population are the QTLs controlling malt extract, although several other traits are also significant (Table 4).. Phenotypic data collected. Conclusions. Following seed multiplication in 1998, the full population was available for field experiments in 1999 and 2000. Experiments were conducted in up to 6 locations spread over 5 states (Table 3). Two experiments were chosen from each year on the basis of grain protein (preferably 9.5–12.0%) and grain plumpness for malting.. The Alexis × Sloop population has been a valuable source of 9 marker loci, which have been implemented in Australian breeding programs (Table 4). Further, it has been a useful tool for comparing the suitability of DH and recombinant inbred lines for map construction and QTL analysis. References. QTL analysis MapManager QTX (Manly et al. 2001) was used to develop associations between markers and quantitative trait loci (QTLs). Statistical associations were based on regression analysis. The likelihood ratio statistic (LRS) was calculated using the interval mapping functions in MapManager QTX. Permutation analyses (1000 iterations) were carried out to determine whether a particular value of the LRS was highly significant (99.9%). The Q-gene analytical package (Nelson 1997) was used to confirm associations using interval mapping and maximum likelihood statistics [logarithm of odds ratio (LOD) values] and to generate graphical representations of maps and marker–trait associations.. Ablett GA, Karakousis A, Banbury L, Cakir M, Holton TA, Langridge P, Henry RJ (2003) Application of SSR markers in the construction of Australian barley genetic maps. Australian Journal of Agricultural Research 54, 1187–1195. Barr AR (1998) Sloop syn. WI2875–22. Plant Varieties Journal 11, 15–16. Bassam BJ, Caetano-Annollés G (1993) Silver staining of DNA in polyacrylamide gels. Applied Biochemistry and Biotechnology 42, 181–188. Becker J, Vos P, Kuiper M, Salamini F, Heun M (1995) Combined mapping of AFLP and RFLP markers in barley. Molecular and General Genetics 249, 65–73. Collins HM, Panozzo JF, Logue SJ, Jefferies SP, Barr AR (2003) Mapping and validation of chromosome regions associated with high malt extract in barley (Hordeum vulgare L.). Australian Journal of Agricultural Research 54, 1223–1240..
(7) Mapping and QTL analysis of Alexis × Sloop. Australian Journal of Agricultural Research. Coventry SJ, Barr AR, Eglinton JK, McDonald GK (2003) The determinants and genome locations influencing grain weight and size in barley (Hordeum vulgare L.). Australian Journal of Agricultural Research 54, 1103–1115. Don RH, Cox PT, Wainwright BJ, Baker K, Mattick JS (1991) Touchdown PCR to circumvent spurious priming during gene amplification. Nucleic Acids Research 19, 4008. Eglinton JK, Langridge P, Evans DE (1998) Thermostability variation in alleles of barley beta-amylase. Journal of Cereal Science 28, 301–309. Friedt W, Werner K, Ordon F (2000) Genetic progress as reflected in highly successful and productive modern barley cultivars. In ‘Proceedings 8th International Barley Genetics Symposium’. Adelaide. ISBN 0–086396–677v.1. Karakousis A (2002) The development, identification and application of SSR markers for use in Australian barley (Hordeum vulgare L.) breeding. PhD Thesis, University of Adelaide, South Australia. Karakousis A, Gustafson JP, Chalmers KJ, Barr AR, Langridge P (2003) A consensus map of barley integrating SSR, RFLP, and AFLP markers. Australian Journal of Agricultural Research 54, 1173–1185. Kosambi DD (1944) The estimation of map distances from recombination values. Annals of Eugenics 12, 172–175. Lander ES, Green P, Abrahamson J, Barlow A, Daly MJ, Lincon SE, Newburg L (1987) Mapmaker an interactive computer package for constructing primary genetic linkage maps of experimental and natural populations. Genomics 1, 174–181. Liu ZW, Biyashev RM, Maroof MAS (1996) Development of simple sequence repeat DNA markers and their integration into a barley linkage map. Theoretical and Applied Genetics 93, 869–876. Manly KF, Cudmore RH (1997) Map Manager QT, Software for mapping quantitative trait loci. In ‘Abstracts of the 11th International Mouse Genome Conference, St Petersburg, FL’. Manly KF, Cudmore RH, Meer JM (2001) Map Manager QTX, cross-platform software for genetic mapping. Mammalian Genome 12, 930–932. doi:10.1007/S00335-001-10163. Maroof MAS, Biyashev RM, Yang GP, Zhang Q, Allard RW (1994) Extraordinarily polymorphic microsatellite DNA in barley—species diversity, chromosomal locations, and population dynamics. Proceedings of the National Academy of Sciences of the United States of America 91, 5466–5470.. 1123. Nelson JC (1997) Q-gene: software for marker-based genomic analysis and breeding. Molecular Breeding 3, 239–245. doi:10.1023/ A:1009604312050 Park RF, Poulsen D, Barr AR, Cakir M, Moody DB, Ramen H, Read BJ (2003) Mapping genes for resistance to Puccinia hordei in barley. Australian Journal of Agricultural Research 54, 1323–1333. Pillen K, Binder A, Kreuzkam B, Ramsay L, Waugh R, Forster J, Leon J (2000) Mapping new EMBL-derived barley microsatellites and their use in differentiating German barley cultivars. Theoretical and Applied Genetics 101, 652–660. Ramsay L, Macaulay M, Ivanissevich SD, MacLean K, Cardle L, Fuller J, Edwards KJ, Tuvesson S, Morgante M, Massari A, Maestri E, Marmiroli N, Sjakste T, Ganal M, Powell W, Waugh R (2000) A simple sequence repeat-based linkage map of barley. Genetics 156, 1997–2005. Rogowsky PM, Guidet FLY, Langridge P, Shepherd KW, Koebner RMD (1991) Isolation and characterisation of wheat–rye recombinants involving chromosome arm 1DS of wheat. Theoretical and Applied Genetics 82, 537–544. Säll T, Nilsson N-O (1994) Crossover distribution in barley analysed through RFLP linkage data. Theoretical and Applied Genetics 89, 211–216. Struss D, Plieske J (1998) The use of microsatellite markers for detection of genetic diversity in barley populations. Theoretical and Applied Genetics 97, 308–315. Vos P, Hogers R, Bleeker M, Reijans M, van de Lee T, Hornes M, Freiters A, Pot J, Peleman J, Kuiper M, Zabeau M (1995) AFLP: a new concept for DNA fingerprinting. Nucleic Acids Research 23, 4407–4414.. Manuscript received 28 October 2002, accepted 31 October 2003-11-06. http://www.publish.csiro.au/journals/ajar.
(8)
Figure
Related documents
In a study investi- gating risk factors for epiploic foramen entrapment colic in the UK [16] in a similar, predominantly pleasure horse population, of 522 randomly selected
After individually assessing the selected climate change mitigation measures, in summary, for the construction of the mitigation scenario, we applied to the reference scenario,
Tibial rotation during athletic tasks has been examined recently: we examined gender differences of tibial rotation during single-limb drop landing and estimated that the risk
Mepiquat chloride and shading effects on specific leaf area and K, P, Ca, Fe and Mn content of Lantana camara L.. Aristidis Matsoukis 1* , Dionisios Gasparatos 2 and
Social networks are an opportunity to foster and strengthen dialogue between companies and their audiences and also to integrate social expectations into their corporate
Modeling club structures as bipartite directed networks, we formulate the prob- lem of club formation as a noncooperative game of network formation and identify conditions on
This was the rationale for offering utility computing with the Amazon Web Services ( AWS ) platform. It provides mainly low-level access to computing resources and is
