Concept paper
Infection-Genomics of COVID-19: Are some communities resistant?
R. Manjunatha Kini1,2 and Swati Kundu1
1Department of Biological Sciences, Faculty of Science, National University of Singapore, 117558, Singapore
2Department of Pharmacology, Yong Loo Lin School of Medicine, National University of Singapore, 117600, Singapore
*Corresponding author. Email: [email protected]
Abstract
Introduction
Currently, the whole world is put on hold by a novel corona virus, SARS-CoV2, that is closely related to the Severe Acute Respiratory Syndrome (SARS) virus that caused havoc in 2013 [1]. Coronavirus disease (COVID-19) started by the end of 2019 in China and spread in many Asian countries by February 2020. By early May, COVID-19 infected ~210 countries, claimed ~270,000 lives and afflicted about 3.9 million people. In many parts of the world, COVID-19 is still marching through the communities unabated.
Over the last several decades, several infectious diseases have emerged to infect the mankind. These diseases, depending on their severity, caused serious disruptions to either a small region of the world or spread throughout the world with significant number of human deaths and devastation. In 2018, malaria infected 228 million people worldwide claiming 405,000 lives. African Region had a disproportionately high share of 93% of malaria cases and 94% of malaria deaths [2]. Nearly all malaria deaths are caused by Plasmodium falciparum, the deadliest malaria parasite. P. falciparum accounted for 99.7% of cases in the African Region, while other regions are affected by less virulent species [3]. In contrast, 70% dengue infection burden is in Asia, although 129 countries are at risk [4]. Similarly, seasonal influenza, avian flu and other air borne diseases also affect certain regions of the world but has little or no impact elsewhere. With these factors in mind, we evaluated COVID-19 disease data.
can be evaluated after the complete resolution of COVID-19. The IDR data will alert all relevant government agencies, clinical institutions, pharma industry as well as common man regarding COVID-19 outcome.
Here, we have used IDRs to understand the impact of COVID-19 in various countries and regions in the world. The data suggests that, as with any of the vector- or air-borne infectious diseases, COVID-19 also shows differential impact on various regions of the world. We, therefore, propose to evaluate infection-genomics (sankramikogenomics), in understanding the susceptibility to COVID-19 and the severity of disease progress.
Disease statistics and methods
All COVID-19 data were obtained from https://www.worldometers.info/coronavirus/
Worldometer website. As the data is dynamic and changes rapidly, we have used the latest data
obtained on April 17, 2020, 8 am (Singapore
time). The IDR (%) was calculated as follows:
Results and Discussion
In the first wave, COVID-19 infections started in and affected mostly China. Then people in surrounding East Asian countries were infected. In the second wave, these infections affected Middle East countries, particularly Iran was most affected. In the third wave, COVID-19 infections affected Western European countries and the US. In the fourth and final wave, it has spread to remaining parts of the world. There is no clear separation or breaks between these waves. These waves are considered only to keep the discussions simple.
The first wave of COVID-19
and the government with people’s cooperation, restricted the COVID-19 related IDR (Table 1).
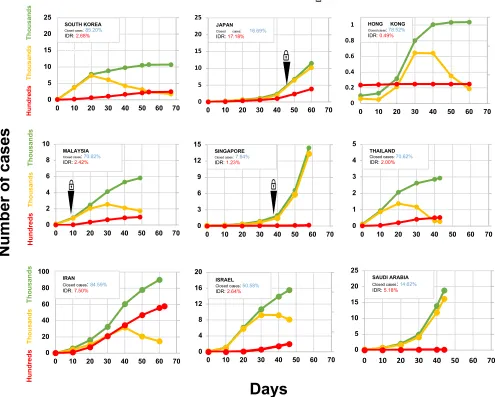
In South Korea, the first case was recorded on January 20, 2020. The IDR reached the peak of 51.5% (32 deaths) on March 3 and since then declined to 24.1% on March 6 on much improved recovery (Figure 2). With aggressive measures, they controlled the spread without shutting everything down through testing most of the population [6] and reduced the IDR to current rate of 2.68% (Table 1). Similarly, by adopting different measures Singapore (daily monitoring of temperature and symptoms, quarantine and stay-home-notice, contact tracing, business continuity plan, social distancing and work from home) and Hong Kong reined COVID-19 infections and IDRs (1.84% and 0.05%, respectively). Japan (investigating flare-ups of cases, identifying the infected and then monitoring their contacts) also controlled COVID-19 infection and IDR (Table 1). Taiwan, Thailand, Vietnam and Malaysia also have IDRs range between 0 to 2.59% except for Japan (6.45%) (Table 1). The battle-readiness was enhanced probably through the experience gained from SARS-2013 and MERV-2015 infections that swept this region. Thus, most of the East Asian countries, in many ways able to control COVID-19 infections and death (Figure 2).
The second wave of COVID-19
infections, Middle East countries have done extremely well in their fight against COVID-19 (Figure 2).
Alarming IDRs in the first world
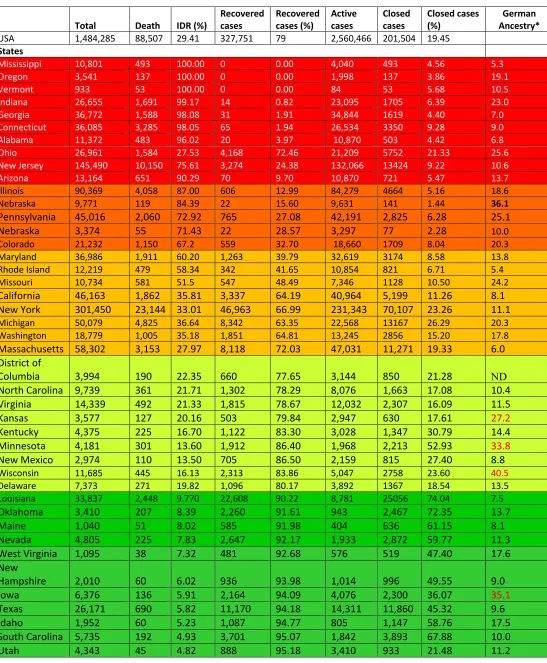
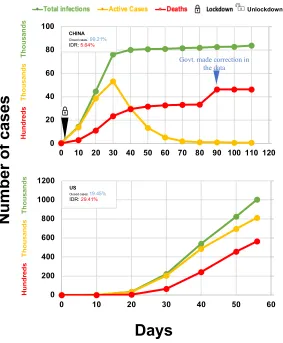
COVID-19 in the US: On February 15, the US had 15 cases, the number reached 100 cases on March 2 and 6,346 cases on March 17. COVID-19 cases swell 100-times to 677,056 in about a month (Figure 1). Since April 2, the number is increasing ~30,000 new cases on an average every day. We evaluated the data from all 50 US states (Table 4). Nineteen states have been successfully defending the infections keeping the IDRs below 10%. South Dakota with IDR (1.12%) leads the country, followed by Wyoming, Hawaii, Tennessee, Alaska, Montana, North Dakota, Arkansas, Utah, South Carolina, Idaho, Texas, Iowa, New Hampshire, West Virginia, Nevada, Maine, Oklahoma and Louisiana (Table 4). These states have done extremely well in fighting COVID-19 infections and related deaths. Next four states, Delaware, Wisconsin, New Mexico, and Minnesota have IDRs range between 11.11 and 13.60%, immediately followed by five states with IDRs below 25%. These nine states have done well in avoiding extreme impact of COVID-19 infections. The next eight states have IDR range from 25-50%. Unfortunately, 15 states have poor record in fighting COVID-19. They are grouped states into one with 51-79% IDRs and the other above 80% IDRs (Table 4). These 23 states, particularly the last 10, need substantial measures to slow down the devastations caused by COVID-19.
Angiotensin-converting enzyme 2 (ACE2), ACE1 and COVID-19
left ventricular enlargement and remodelling [14]. Hence, ACE1 contributes to the development of cardiovascular disease through the generation of angiotensin II. In contrast, ACE2 plays a cardioprotective role and eliminates many of the negative consequences of angiotensin II (For details, see [15,16]). Thus, primarily ACE2 acts as a counterbalance to ACE1.
indicates that chromatin at both the ACE2 and TMPRSS2 loci are accessible in epithelial cells, especially AT2 cells [27]. Further, ACE2+CTSL+ cells are found in the olfactory epithelium, ventricular cardiomyocytes, heart macrophages, and pericytes in multiple tissues, including the heart, lung, and kidney. In addition, several other proteases have been shown to be co-expressed with ACE2 and they may play a role in COVID-19 infections [27]. The epithelial cells of the oral mucosa and tongue [29] and cornea and conjunctiva [30] have high ACE2 expression.
ACE2, a gateway in COVID-19 infections: SARS-CoV2 enters an individual through the ACE2 receptors found in the respiratory track ([27] and several other references). Nature has a number of physical barriers to protect us from such infections including nose hairs, curved and mucous protected nasal passages, and ciliated mucous membrane. These barriers provide excellent protection considering an average adult breathes 11,000 liters of air/day. Despite the number of particles, viruses and bacteria among other pathogens that enter our system daily, most of us remain healthy unaffected by the plethora of “attacks”. Most of these living or dead particles are trapped in the mucus and slowly pushed out of the nose or mouth through cilia, the microscopic hairs. About 1.4 liters of mucus/day keeps the nasal cavity and airways moist, and “captures” all particulate matter for disposal. Mucus gets diluted with serous fluid and swallowed twice a minute. When an individual is dehydrated due to low water intake, cold and dry winters, air conditioners/ heaters or smoking, the volume of serous fluid is reduced. This in turn leads to thick and sticky mucus, which makes people more susceptible to illness, allergies and other respiratory problems [31]. Such dry nasal and upper respiratory track provide SARS-CoV2 access to epithelial cells and their ACE2 resulting in potential infection. Thus, preventing dehydration by ample water intake will reduce the transmission.
Entry or secondary site infection through the mouth probably leads to frequent olfactory and taste disorders in the patients before the onset of full-blown disease [32]. These routes are accessible through frequent touching of the face and rubbing of eyes. Surprisingly, individuals touch their face 23 times/hour [33]. Among these face touches, 44% contact with a mucous membrane (mouth, nose and eyes, one third times each), whereas 56% contact nonmucosal areas. Thus, hand hygiene is an essential and inexpensive preventive method to break transmission associated with self-inoculation.
Key covariates associated with COVID-19 severity: The clinical consequences of COVID-19 infection ranges from asymptomatic carrier status to death. Three key covariates, age, sex and smoking, define COVID-19 severity. The initial evaluation indicates that the disease severity and mortality rates show a significant rise with age (<0.1% for patients under 30 years old to >10% for patients over 70) [34, 35]. Children are less likely to develop severe disease compared to adults [36]. There is also a slightly higher incidence and mortality in men compared to women [37, 38]. Earlier studies using bulk transcriptomics and analysis of single-cell RNA-seq data failed to find significant differences between age groups (>60 vs <60) or gender groups (male vs female) [39]. Muus et al. correlated ACE2 expression in double positive ACE2+TMPRSS2+ cells such as airway epithelial cells (basal, multiciliated, and secretory cells), alveolar AT2 cells, and submucosal gland secretory cells [27]. The expression of ACE2 increases with age in basal and multiciliated cells, while it is elevated in males in airway secretory cells and AT2 cells.
Preliminary analyses indicate that more adverse events occur in smokers [40]. Interestingly, ACE2 gene expression in Asian current smokers is higher compared to non-smokers but not in
predisposition may be due to the much higher smoking rate in men than in women in China [41]. ACE2 expression in multiciliated cells is elevated in former or current smokers [27]. Further, in AT2 cells, there is joint up-regulation of ACE2 and TMPRSS2 with age and ACE2 and CTSL down-regulation in smokers. Overall, there is increased ACE2 expression in airway epithelial cells and reduced expression in AT2 cells of smokers. In the mouse model data also suggested the increased expression levels of ACE2 in airway secretory cells, but not in AT2 cells (For details, see [27]). Thus, expression of ACE2 and associated proteases support the impact of covariates on COVID-19 severity.
CD147, the other receptor, may be as important as ACE2
azithromycin (500 mg on the first day followed by 250 mg daily) show negative PCR results in nasopharyngeal samples. In comparison, 57.1% patients treated with hydroxychloroquine only, and 12.5% of untreated individuals were virus-free [48]. Although further clinical studies are essential to validate these findings, it appears that CD147 could be a target for COVID-19 treatment [49].
Infection-genomics (Sankramikogenomics)
populations of Austria and Switzerland are closely related to Germanic lineage (https://www.indexmundi.com/COUNTRY/demographics_profile.html). Interestingly, the ‘first four German patients’ who were positively confirmed to have the virus recovered from COVID-19 without hospitalization [55]. Taking these and other factors into account, we propose the possibility that people of this ethnic background may be ‘somewhat resistant’ to COVID-19. To test this hypothesis, we considered the demographic ethnicities, with specific focus on ancestral history and percent of Germans, of various US states with low and high IDRs. Of the 25 US states with low IDRs have six-out-of-seven states have high proportion of population belonging to German ethnicity; South Dakota (38.8%), North Dakota (41.4%), Iowa (35.1%), Wisconsin (40.5%), Minnesota (33.8%) and Kansas (27.2%) (Table 4). Only Nebraska (36.1%) has high IDR and is in the bottom 13th position. Hawaii, although has only 5.9% population belonging to German ethnicity, shows low IDR of 3.07%. The low IDR could be due to its 19.2% East Asian population (the highest among the US states) (see discussions below). In contrast, 6-out-of-10 states that have less than 11% German population have high IDRs (>80%). Although it is crystal clear that COVID-19 infections and outcomes depend on innumerable factors including (but not limited to) population density, healthcare facility and personnel, access to healthcare insurance, and total COVID-19 infections and capacity, we observed that large number of the states follow the ‘German factor’.
that there could be an ‘Oriental factor’ responsible for the resistance factor. Hawaii has high proportion of Oriental Asian population and low IDR (discussed above) (Table 4).
ACE2 expression and vulnerability
ACE2 the target receptor, which plays a crucial role in the entry of virus into the cell, has been the focus for the Infection-genomics of COVID-19 infection and disease progress. Several groups have analyzed human genome and single-cell RNA-seq databases for ACE2 variants, allele frequency and expression in various tissues to understand the susceptibility and mechanism of pathophysiology of COVID-19 infection [21, 56, 57, 58].In a recent study, Asian male (55 y) was reported to have an extremely large number of ACE2-expressing cell clusters, including type II alveolar cells (AT2), in the lung compared to five African American and two white individuals [58].Single cell RNA-seq data with significant depth could be used evaluate ACE2 and CD147 expression along with relevant proteases and other accessory proteins in specific cell types of major organs will help us clarify details [27]. Analyses of coding-region variants in ACE2 and the expression quantitative trait loci (eQTL) variants among different populations show that none of the ACE2 mutants are resistant to binding to the virus [55]. Variations in allele frequencies in the eQTL variants along with varied ACE2 expression may suggest distinct susceptibility from different populations [56]. The deletion/insertion (D/I) polymorphism in intron 16 of ACE1 shows geographical and ethnic variations [59] and the D allele is associated with a reduced ACE2 expression. D-allele frequency is inversely proportional to COVID-19 infections [57]. Viruses will reach heart, kidney and ileum through blood, most likely at later stages, which is the leading cause of death through comorbidities. Patients with preexisting hypertension and cardiovascular diseases, particularly who are taking ACE inhibitors or angiotensin II receptor antagonists and have increased ACE2 expression [60, 61], have an increased risk of severe disease and death [62, 63]. Thus, ACE2 is critical for initial infection followed by disease progression.
Minor sequence changes in ACE2 may alter the interaction between SARS-Cov2 virus with human cells and thus, the entry of the virus and infectivity. In a recent study, Stawiski et al. analyzed the polymorphisms of ACE2 with specific emphasis on its interaction with Spike protein. The authors analyzed large datasets (over 290,000 samples representing >400 population groups) and identified nine and 17 rare ACE2 variants that probably increase or decrease binding to virus spike protein [64]. Such variations in ACE2, the target receptor that plays a crucial role in the entry of virus, probably explains the varied sankramikogenomics of COVID-19 in distinct ethnic people.
Conclusions and future prospects
CoVID-19 disrupted the most sophisticated systems and brought them to their knees. The unusual high IDRs in the US and major Western European countries compared to East Asian and Middle East countries could be due to differential susceptibilities of people belonging to distinct ethnicities. We hypothesized that Germanic, oriental and Middle East people may have enhanced resistance to COVID-19-induced death. These factors could be related to structure, splice forms and expression regulation of ACE2 and CD147 receptors or secondary mechanisms leading to death through comorbidities. We have initiated the search for such factors through sankramikogenomics. These mechanistic studies will help in developing strategies to reduce COVID-induced mortality. We urgently need to find therapeutic solutions to resolve this coronavirus gauntlet [65, 66]. These approaches along with better recovery protocols used in the some of the key healthcare centers will help reduce the death. COVID-19 is our warning siren; a strong cooperative, multi-pronged approach is needed overcome this catastrophe.
References:
1. Wu F, Zhao S, Yu B, Chen YM, Wang W, Song ZG, Hu Y, Tao ZW, Tian JH, Pei YY, Yuan ML. A new coronavirus associated with human respiratory disease in China. Nature. 2020 Mar;579(7798):265-9. Doi: https://doi.org/10.1038/s41586-020-2008-3
2. World Health Organization. World malaria report 2019. ISBN 978-92-4-156572-1: xii–xiii, 4–10
3. World Health Organization. Global tuberculosis control: surveillance, planning, financing: WHO report 2008. 393: 10. World Health Organization, 2008. p 10
4. Bhatt S, Gething PW, Brady OJ, Messina JP, Farlow AW, Moyes CL, Drake JM, Brownstein JS, Hoen AG, Sankoh O, Myers MF. The global distribution and burden of dengue. Nature. 2013 Apr;496(7446):504-7. Doi: https://doi.org/10.1038/nature12060
5. Ma J. Coronavirus: China’s first confirmed Covid-19 case traced back to November 17. South China Morning Post. 2020 Mar;13.
6. Beaubien J. How South Korea Reined In The Outbreak Without Shutting Everything down. NPR: Washington, DC, USA. 2020 Mar;26.
7. Wu Z, McGoogan JM. Characteristics of and important lessons from the coronavirus disease 2019 (COVID-19) outbreak in China: summary of a report of 72 314 cases from the Chinese Center for Disease Control and Prevention. Jama. 2020 Apr 7;323(13):1239-42. Doi: :10.1001/jama.2020.2648
8. Kwok KO, Lai F, Wei WI, Wong SY, Tang JW. Herd immunity–estimating the level required to halt the COVID-19 epidemics in affected countries. Journal of Infection. 2020 Mar 21. Doi: https://doi.org/10.1016/j.jinf.2020.03.027
origins and receptor binding. The Lancet. 2020 Feb 22;395(10224):565-74. Doi: https://doi.org/10.1016/S0140-6736(20)30251-8
10. Wan Y, Shang J, Graham R, Baric RS, Li F. Receptor recognition by the novel coronavirus from Wuhan: an analysis based on decade-long structural studies of SARS coronavirus. Journal of virology. 2020 Mar 17;94(7). Doi: 10.1128/jvi.00127-20
11. Wrapp D, Wang N, Corbett KS, Goldsmith JA, Hsieh CL, Abiona O, Graham BS, McLellan JS. Cryo-EM structure of the 2019-nCoV spike in the prefusion conformation. Science. 2020 Mar 13;367(6483):1260-3. Doi: https://doi.org/10.1126/science.abb2507
12. Tipnis SR, Hooper NM, Hyde R, Karran E, Christie G, Turner AJ. A human homolog of angiotensin-converting enzyme cloning and functional expression as a captopril-insensitive carboxypeptidase. Journal of Biological Chemistry. 2000 Oct 27;275(43):33238-43. Doi: 10.1074/jbc.M002615200
13. Donoghue M, Hsieh F, Baronas E, Godbout K, Gosselin M, Stagliano N, Donovan M, Woolf B, Robison K, Jeyaseelan R, Breitbart RE. A novel angiotensin-converting enzyme– related carboxypeptidase (ACE2) converts angiotensin I to angiotensin 1-9. Circulation research. 2000 Sep 1;87(5):e1-9. Doi: https://doi.org/10.1161/01.RES.87.5.e1
14. Re RN. Mechanisms of disease: local renin–angiotensin–aldosterone systems and the pathogenesis and treatment of cardiovascular disease. Nature Clinical Practice Cardiovascular Medicine. 2004 Nov;1(1):42-7. Doi: https://doi.org/10.1038/ncpcardio0012
15. Ussher JR, Lopaschuk GD. An ACE up your sleeve: 2 is better than 1. Doi: 10.1161/circresaha.112.269951
17. Fagerberg L, Hallström BM, Oksvold P, Kampf C, Djureinovic D, Odeberg J, Habuka M, Tahmasebpoor S, Danielsson A, Edlund K, Asplund A. Analysis of the human tissue-specific expression by genome-wide integration of transcriptomics and antibody-based proteomics. Molecular & Cellular Proteomics. 2014 Feb 1;13(2):397-406. Doi: 10.1074/mcp.M113.035600
18. Kim MS, Pinto SM, Getnet D, Nirujogi RS, Manda SS, Chaerkady R, Madugundu AK, Kelkar DS, Isserlin R, Jain S, Thomas JK. A draft map of the human proteome. Nature. 2014 May;509(7502):575-81. Doi: https://doi.org/10.1038/nature13302
19. Wilhelm M, Schlegl J, Hahne H, Gholami AM, Lieberenz M, Savitski MM, Ziegler E, Butzmann L, Gessulat S, Marx H, Mathieson T. Mass-spectrometry-based draft of the human proteome. Nature. 2014 May;509(7502):582-7. Doi: https://doi.org/10.1038/nature13319 20. Schmidt T, Samaras P, Frejno M, Gessulat S, Barnert M, Kienegger H, Krcmar H, Schlegl J, Ehrlich HC, Aiche S, Kuster B. ProteomicsDB. Nucleic acids research. 2018 Jan 4;46(D1):D1271-81. Doi: https://doi.org/10.1093/nar/gkz974
21. Zou X, Chen K, Zou J, Han P, Hao J, Han Z. Single-cell RNA-seq data analysis on the receptor ACE2 expression reveals the potential risk of different human organs vulnerable to 2019-nCoV infection. Frontiers of medicine. 2020 Mar 12:1-8. Doi: https://doi.org/10.1007/s11684-020-0754-0
22. Hikmet F, Mear L, Uhlen M, Lindskog C. The protein expression profile of ACE2 in human tissues. bioRxiv. 2020 Jan 1. Doi: https://doi.org/10.1101/2020.03.31.016048
24. Hoffmann M, Kleine-Weber H, Schroeder S, Krüger N, Herrler T, Erichsen S, Schiergens TS, Herrler G, Wu NH, Nitsche A, Müller MA. SARS-CoV-2 cell entry depends on ACE2 and TMPRSS2 and is blocked by a clinically proven protease inhibitor. Cell. 2020 Mar 5. Doi: https://doi.org/10.1016/j.cell.2020.02.052
25. Lukassen S, Chua RL, Trefzer T, Kahn NC, Schneider MA, Muley T, Winter H, Meister M, Veith C, Boots AW, Hennig BP. SARS-CoV-2 receptor ACE2 and TMPRSS2 are predominantly expressed in a transient secretory cell type in subsegmental bronchial branches. bioRxiv. 2020 Jan 1. Doi: https://doi.org/10.1101/2020.03.13.991455
26. Sungnak W, Huang N, Bécavin C, Berg M, Network HC. SARS-CoV-2 Entry Genes Are Most Highly Expressed in Nasal Goblet and Ciliated Cells within Human Airways. arXiv preprint arXiv:2003.06122. 2020 Mar 13. Doi: 10.1038/s41591-020-0868-6
27. Muus C, Luecken MD, Eraslan G, Waghray A, Heimberg G, Sikkema L, Kobayashi Y, Vaishnav ED, Subramanian A, Smilie C, Jagadeesh K. Integrated analyses of single-cell atlases reveal age, gender, and smoking status associations with cell type-specific expression of mediators of SARS-CoV-2 viral entry and highlights inflammatory programs in putative target cells. BioRxiv. 2020 Jan 1. Doi: https://doi.org/10.1101/2020.04.19.049254
29. Xu H, Zhong L, Deng J, Peng J, Dan H, Zeng X, Li T, Chen Q. High expression of ACE2 receptor of 2019-nCoV on the epithelial cells of oral mucosa. International Journal of Oral Science. 2020 Feb 24;12(1):1-5. Doi: https://doi.org/10.1038/s41368-020-0074-x
30. Xia J, Tong J, Liu M, Shen Y, Guo D. Evaluation of coronavirus in tears and conjunctival secretions of patients with SARS‐CoV‐2 infection. Journal of medical virology. 2020 Jun;92(6):589-94. Doi: 10.1002/jmv.25725
31. D’Amato M, Molino A, Calabrese G, Cecchi L, Annesi-Maesano I, D’Amato G. The impact of cold on the respiratory tract and its consequences to respiratory health. Clinical and translational allergy. 2018 Dec;8(1):20. Doi: https://doi.org/10.1186/s40413-015-0073-0 32. Giacomelli A, Pezzati L, Conti F, Bernacchia D, Siano M, Oreni L, Rusconi S, Gervasoni C, Ridolfo AL, Rizzardini G, Antinori S. Self-reported olfactory and taste disorders in SARS-CoV-2 patients: a cross-sectional study. Clin Infect Dis. 2020 Mar 26;70. Doi: https://doi.org/10.1093/cid/ciaa330
33. Kwok YL, Gralton J, McLaws ML. Face touching: A frequent habit that has implications for hand hygiene. American journal of infection control. 2015 Feb 1;43(2):112-4. Doi: https://doi.org/10.1016/j.ajic.2014.10.015
34. Wang C, Liu L, Hao X, Guo H, Wang Q, Huang J, He N, Yu H, Lin X, Pan A, Wei S. Evolving epidemiology and impact of non-pharmaceutical interventions on the outbreak of coronavirus disease 2019 in Wuhan, China. medRxiv. 2020 Jan 1. Doi: https://doi.org/10.1101/2020.03.03.20030593
35. Hauser A, Counotte MJ, Margossian CC, Konstantinoudis G, Low N, Althaus CL, Riou J. Estimation of SARS-CoV-2 mortality during the early stages of an epidemic: a modelling study in Hubei, China and northern Italy. medRxiv. 2020 Jan 1. Doi: https://doi.org/10.1101/2020.03.04.20031104
37. del Rio C, Malani PN. COVID-19—new insights on a rapidly changing epidemic. Jama. 2020 Apr 14;323(14):1339-40. Doi: 10.1001/jama.2020.3072
38. Guan WJ, Liang WH, Zhao Y, Liang HR, Chen ZS, Li YM, Liu XQ, Chen RC, Tang CL, Wang T, Ou CQ. Comorbidity and its impact on 1590 patients with Covid-19 in China: A Nationwide Analysis. European Respiratory Journal. 2020 Jan 1. Doi: 10.1183/13993003.00wa547-202
39. Cai G. Bulk and single-cell transcriptomics identify tobacco-use disparity in lung gene expression of ACE2, the receptor of 2019-nCov. MedRxiv. 2020 Jan 1. Doi: https://doi.org/10.1101/2020.02.05.20020107
40. Vardavas CI, Nikitara K. COVID-19 and smoking: A systematic review of the evidence. Tobacco induced diseases. 2020;18. Doi: 10.18332/tid/119324
41. Cai H. Sex difference and smoking predisposition in patients with COVID-19. The Lancet Respiratory Medicine. 2020 Apr 1;8(4):e20. Doi: https://doi.org/10.1016/S2213-2600(20)30117-X
42. Muramatsu T. Basigin: a multifunctional membrane protein with an emerging role in infections by malaria parasites. Expert opinion on therapeutic targets. 2012 Oct 1;16(10):999-1011. Doi: 10.1517/14728222.2012.711818
43. Kain KC, Shanks GD, Keystone JS. Malaria chemoprophylaxis in the age of drug resistance. I. Currently recommended drug regimens. Clinical infectious diseases. 2001 Jul 15;33(2):226-34. Doi: https://doi.org/10.1086/321817
45. Tran DH, Sugamata R, Hirose T, Suzuki S, Noguchi Y, Sugawara A, Ito F, Yamamoto T, Kawachi S, Akagawa KS, Ōmura S. Azithromycin, a 15-membered macrolide antibiotic, inhibits influenza A (H1N1) pdm09 virus infection by interfering with virus internalization process. The Journal of antibiotics. 2019 Oct;72(10):759-68. Doi: https://doi.org/10.1038/s41429-019-0204-x
46. Damle B, Vourvahis M, Wang E, Leaney J, Corrigan B. Clinical Pharmacology Perspectives on the Antiviral Activity of Azithromycin and Use in COVID‐19. Clinical Pharmacology & Therapeutics. 2020 Apr 17. Doi: https://doi.org/10.1002/cpt.1857
47. Liu J, Cao R, Xu M, Wang X, Zhang H, Hu H, Li Y, Hu Z, Zhong W, Wang M. Hydroxychloroquine, a less toxic derivative of chloroquine, is effective in inhibiting SARS-CoV-2 infection in vitro. Cell discovery. 2020 Mar 18;6(1):1-4. Doi: https://doi.org/10.1038/s41421-020-0156-0
48. Gautret P, Lagier JC, Parola P, Meddeb L, Mailhe M, Doudier B, Courjon J, Giordanengo V, Vieira VE, Dupont HT, Honoré S. Hydroxychloroquine and azithromycin as a treatment of COVID-19: results of an open-label non-randomized clinical trial. International journal of
antimicrobial agents. 2020 Mar
20:105949. Doi: https://doi.org/10.1016/j.ijantimicag.2020.105949
49. Ulrich H, Pillat MM. CD147 as a Target for COVID-19 Treatment: Suggested Effects of Azithromycin and Stem Cell Engagement. Stem Cell Reviews and Reports. 2020 Apr 20:1-7. Doi: 10.1007/s12015-020-09976-7
51. Chen J, Lee KH, Steinhauer DA, Stevens DJ, Skehel JJ, Wiley DC. Structure of the hemagglutinin precursor cleavage site, a determinant of influenza pathogenicity and the origin of the labile conformation. Cell. 1998 Oct 30;95(3):409-17. Doi: https://doi.org/10.1016/S0092-8674(00)81771-7
52. Crocker J, Abe N, Rinaldi L, McGregor AP, Frankel N, Wang S, Alsawadi A, Valenti P, Plaza S, Payre F, Mann RS. Low affinity binding site clusters confer hox specificity and
regulatory robustness. Cell. 2015 Jan
15;160(1-2):191-203. Doi: https://doi.org/10.1016/j.cell.2014.11.041
53. Guan WJ, Ni ZY, Hu Y, Liang WH, Ou CQ, He JX, Liu L, Shan H, Lei CL, Hui DS, Du B. China Medical Treatment Expert Group for Covid-19. Clinical characteristics of coronavirus disease. 2019. Doi: 10.1056/NEJMoa2002032
54. Yang J, Zheng Y, Gou X, Pu K, Chen Z, Guo Q, Ji R, Wang H, Wang Y, Zhou Y. Prevalence of comorbidities in the novel Wuhan coronavirus (COVID-19) infection: a systematic review and meta-analysis. International Journal of Infectious Diseases. 2020 Mar 12. Doi: https://doi.org/10.1016/j.ijid.2020.03.017
55. Rothe C, Schunk M, Sothmann P, Bretzel G, Froeschl G, Wallrauch C, Zimmer T, Thiel V, Janke C, Guggemos W, Seilmaier M. Transmission of 2019-nCoV infection from an asymptomatic contact in Germany. New England Journal of Medicine. 2020 Mar 5;382(10):970-1. Doi: https://doi.org/10.1056/NEJMc2001468
57. Delanghe JR, Speeckaert MM, De Buyzere ML. The host’s angiotensin-converting enzyme polymorphism may explain epidemiological findings in COVID-19 infections. Clinica Chimica Acta; International Journal of Clinical Chemistry. 2020 Jun;505:192. Doi: 10.1016/j.cca.2020.03.031
58. Zhao Y, Zhao Z, Wang Y, Zhou Y, Ma Y, Zuo W. Single-cell RNA expression profiling of ACE2, the receptor of SARS-CoV-2. BioRxiv. 2020 Jan 1. Doi: https://doi.org/10.1101/2020.01.26.919985
59. Oliveira-Paula GH, Pereira SC, Tanus-Santos JE, Lacchini R. Pharmacogenomics And Hypertension: Current Insights. Pharmacogenomics and Personalized Medicine. 2019;12:341. Doi: 10.2147/PGPM.S230201
60. Ferrario CM, Jessup J, Chappell MC, Averill DB, Brosnihan KB, Tallant EA, Diz DI, Gallagher PE. Effect of angiotensin-converting enzyme inhibition and angiotensin II receptor blockers on cardiac angiotensin-converting enzyme 2. Circulation. 2005 May 24;111(20):2605-10. Doi: https://doi.org/10.1161/CIRCULATIONAHA.104.510461
61. Huang ML, Li X, Meng Y, Xiao B, Ma Q, Ying SS, Wu PS, Zhang ZS. Upregulation of angiotensin‐converting enzyme (ACE) 2 in hepatic fibrosis by ACE inhibitors. Clinical and Experimental Pharmacology and Physiology. 2010 Jan;37(1):e1-6. Doi: https://doi.org/10.1111/j.1440-1681.2009.05302.x
64. Stawiski EW, Diwanji D, Suryamohan K, Gupta R, Fellouse FA, Sathirapongsasuti F, Liu J, Jiang YP, Ratan A, Mis M, Santhosh D. Human ACE2 receptor polymorphisms predict
SARS-CoV-2 susceptibility. bioRxiv. 2020 Jan 1. Doi:
https://doi.org/10.1101/2020.04.07.024752
63. Zheng YY, Ma YT, Zhang JY, Xie X. COVID-19 and the cardiovascular system. Nature Reviews Cardiology. 2020 May;17(5):259-60. Doi: https://doi.org/10.1038/s41569-020-0360-5
65. Li G, De Clercq E. Therapeutic options for the 2019 novel coronavirus (2019-nCoV). Doi: 10.1038/d41573-020-00016-0
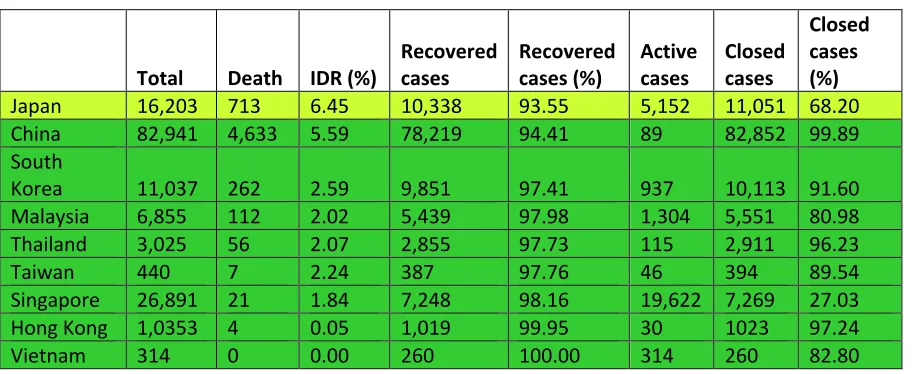
Table 1.COVID-19 infections in the East Asian countries (May 15, 2020)‡
Total Death IDR (%)
Recovered cases
Recovered cases (%)
Active cases
Closed cases
Closed cases (%)
Japan 16,203 713 6.45 10,338 93.55 5,152 11,051 68.20
China 82,941 4,633 5.59 78,219 94.41 89 82,852 99.89
South
Korea 11,037 262 2.59 9,851 97.41 937 10,113 91.60
Malaysia 6,855 112 2.02 5,439 97.98 1,304 5,551 80.98
Thailand 3,025 56 2.07 2,855 97.73 115 2,911 96.23
Taiwan 440 7 2.24 387 97.76 46 394 89.54
Singapore 26,891 21 1.84 7,248 98.16 19,622 7,269 27.03
Hong Kong 1,0353 4 0.05 1,019 99.95 30 1023 97.24
Vietnam 314 0 0.00 260 100.00 314 260 82.80
Various countries with COVID-19 infections are sorted in descending order of their Interim Death Rates (%). Based on the IDRs various countries are grouped into two groups: 11-24% IDRs, greenish yellow; and below 10% IDRs, green.
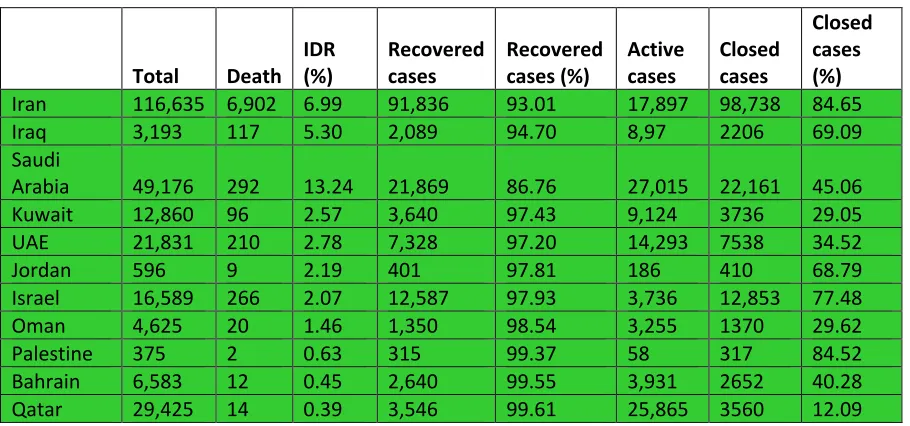
Table 2.COVID-19 infections in the Middle East countries (May 15, 2020)‡
Total Death IDR (%)
Recovered cases
Recovered cases (%)
Active cases
Closed cases
Closed cases (%)
Iran 116,635 6,902 6.99 91,836 93.01 17,897 98,738 84.65
Iraq 3,193 117 5.30 2,089 94.70 8,97 2206 69.09
Saudi
Arabia 49,176 292 13.24 21,869 86.76 27,015 22,161 45.06
Kuwait 12,860 96 2.57 3,640 97.43 9,124 3736 29.05
UAE 21,831 210 2.78 7,328 97.20 14,293 7538 34.52
Jordan 596 9 2.19 401 97.81 186 410 68.79
Israel 16,589 266 2.07 12,587 97.93 3,736 12,853 77.48
Oman 4,625 20 1.46 1,350 98.54 3,255 1370 29.62
Palestine 375 2 0.63 315 99.37 58 317 84.52
Bahrain 6,583 12 0.45 2,640 99.55 3,931 2652 40.28
Qatar 29,425 14 0.39 3,546 99.61 25,865 3560 12.09
Various countries with COVID-19 infections are sorted in descending order of their Interim Death Rates (%). Based on the IDRs all countries are grouped in one group of below 10% IDRs, green.
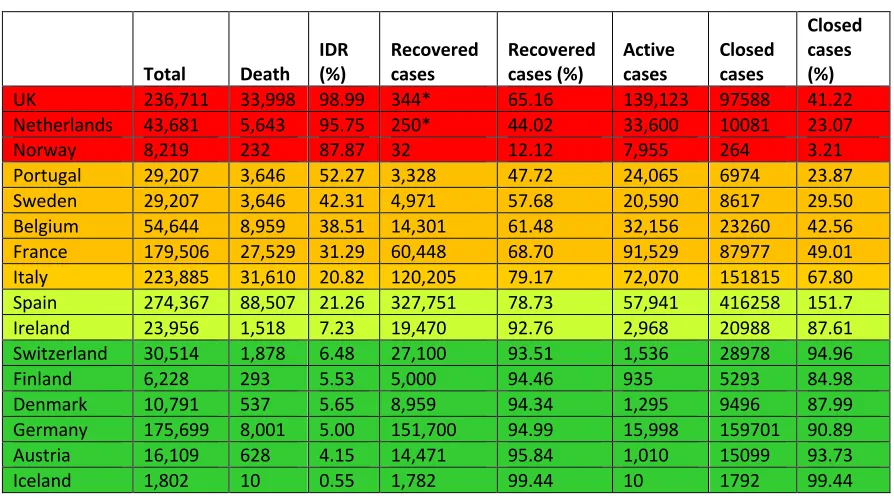
Table 3.COVID-19 infections in the Western Europe (May 15, 2020)‡
Total Death
IDR (%)
Recovered cases
Recovered cases (%)
Active cases
Closed cases
Closed cases (%)
UK 236,711 33,998 98.99 344* 65.16 139,123 97588 41.22
Netherlands 43,681 5,643 95.75 250* 44.02 33,600 10081 23.07
Norway 8,219 232 87.87 32 12.12 7,955 264 3.21
Portugal 29,207 3,646 52.27 3,328 47.72 24,065 6974 23.87
Sweden 29,207 3,646 42.31 4,971 57.68 20,590 8617 29.50
Belgium 54,644 8,959 38.51 14,301 61.48 32,156 23260 42.56
France 179,506 27,529 31.29 60,448 68.70 91,529 87977 49.01
Italy 223,885 31,610 20.82 120,205 79.17 72,070 151815 67.80
Spain 274,367 88,507 21.26 327,751 78.73 57,941 416258 151.7
Ireland 23,956 1,518 7.23 19,470 92.76 2,968 20988 87.61
Switzerland 30,514 1,878 6.48 27,100 93.51 1,536 28978 94.96
Finland 6,228 293 5.53 5,000 94.46 935 5293 84.98
Denmark 10,791 537 5.65 8,959 94.34 1,295 9496 87.99
Germany 175,699 8,001 5.00 151,700 94.99 15,998 159701 90.89
Austria 16,109 628 4.15 14,471 95.84 1,010 15099 93.73
Iceland 1,802 10 0.55 1,782 99.44 10 1792 99.44
Various countries with COVID-19 infections are sorted in descending order of their Interim Death Rates (%). Based on the IDRs various countries are grouped into four groups: higher than 80% IDRs, red; 25-79% IDRs, dark yellow; 7-24% IDRs,
greenish yellow; and below 7% IDRs, green.
‡Updated data was obtained from https://www.worldometers.info/coronavirus/.
Table 4.COVID-19 infections in the US (May 15, 2020)‡
Total Death IDR (%) Recovered cases Recovered cases (%) Active cases Closed cases Closed cases (%) Ancestry*German
USA 1,484,285 88,507 29.41 327,751 79 2,560,466 201,504 19.45
States
Mississippi 10,801 493 100.00 0 0.00 4,040 493 4.56 5.3
Oregon 3,541 137 100.00 0 0.00 1,998 137 3.86 19.1
Vermont 933 53 100.00 0 0.00 84 53 5.68 10.5
Indiana 26,655 1,691 99.17 14 0.82 23,095 1705 6.39 23.0
Georgia 36,772 1,588 98.08 31 1.91 34,844 1619 4.40 7.0
Connecticut 36,085 3,285 98.05 65 1.94 26,534 3350 9.28 9.0
Alabama 11,372 483 96.02 20 3.97 10,870 503 4.42 6.8
Ohio 26,961 1,584 27.53 4,168 72.46 21,209 5752 21.33 25.6
New Jersey 145,490 10,150 75.61 3,274 24.38 132,066 13424 9.22 10.6
Arizona 13,164 651 90.29 70 9.70 10,870 721 5.47 13.7
Illinois 90,369 4,058 87.00 606 12.99 84,279 4664 5.16 18.6
Nebraska 9,771 119 84.39 22 15.60 9,631 141 1.44 36.1
Pennsylvania 45,016 2,060 72.92 765 27.08 42,191 2,825 6.28 25.1
Nebraska 3,374 55 71.43 22 28.57 3,297 77 2.28 10.0
Colorado 21,232 1,150 67.2 559 32.70 18,660 1709 8.04 20.3
Maryland 36,986 1,911 60.20 1,263 39.79 32,619 3174 8.58 13.8
Rhode Island 12,219 479 58.34 342 41.65 10,854 821 6.71 5.4
Missouri 10,734 581 51.5 547 48.49 7,346 1128 10.50 24.2
California 46,163 1,862 35.81 3,337 64.19 40,964 5,199 11.26 8.1
New York 301,450 23,144 33.01 46,963 66.99 231,343 70,107 23.26 11.1
Michigan 50,079 4,825 36.64 8,342 63.35 22,568 13167 26.29 20.3
Washington 18,779 1,005 35.18 1,851 64.81 13,245 2856 15.20 17.8
Massachusetts 58,302 3,153 27.97 8,118 72.03 47,031 11,271 19.33 6.0
District of
Columbia 3,994 190 22.35 660 77.65 3,144 850 21.28 ND
North Carolina 9,739 361 21.71 1,302 78.29 8,076 1,663 17.08 10.4
Virginia 14,339 492 21.33 1,815 78.67 12,032 2,307 16.09 11.5
Kansas 3,577 127 20.16 503 79.84 2,947 630 17.61 27.2
Kentucky 4,375 225 16.70 1,122 83.30 3,028 1,347 30.79 14.4
Minnesota 4,181 301 13.60 1,912 86.40 1,968 2,213 52.93 33.8
New Mexico 2,974 110 13.50 705 86.50 2,159 815 27.40 8.8
Wisconsin 11,685 445 16.13 2,313 83.86 5,047 2758 23.60 40.5
Delaware 7,373 271 19.82 1,096 80.17 3,892 1367 18.54 13.5
Louisiana 33,837 2,448 9.770 22,608 90.22 8,781 25056 74.04 7.5
Oklahoma 3,410 207 8.39 2,260 91.61 943 2,467 72.35 13.7
Maine 1,040 51 8.02 585 91.98 404 636 61.15 8.1
Nevada 4,805 225 7.83 2,647 92.17 1,933 2,872 59.77 11.3
West Virginia 1,095 38 7.32 481 92.68 576 519 47.40 17.6
New
Hampshire 2,010 60 6.02 936 93.98 1,014 996 49.55 9.0
Iowa 6,376 136 5.91 2,164 94.09 4,076 2,300 36.07 35.1
Texas 26,171 690 5.82 11,170 94.18 14,311 11,860 45.32 9.6
Idaho 1,952 60 5.23 1,087 94.77 805 1,147 58.76 17.5
South Carolina 5,735 192 4.93 3,701 95.07 1,842 3,893 67.88 10.0
Various US states with COVID-19 infections in descending order of their Interim Death Rates (%). Based on the IDRs various states are grouped into five groups: higher than 80% IDRs, red; 65-87% IDRs, brown; 26-60% IDRs, dark yellow; 19-22% IDRs, greenish yellow; and below 10% IDRs, green.
‡Updated data was obtained from https://www.worldometers.info/coronavirus/.
*The data on German and East Asian (not shown) ancestry of population in various US states were obtained from https://statisticalatlas.com/state/STATE/Ancestry.
Arkansas 3,127 57 4.48 1,216 95.52 1,854 1,273 40.71 10.7
North Dakota 991 19 4.44 409 95.56 563 428 43.19 41.4
Montana 451 15 4.04 356 95.96 80 371 82.26 26.0
Alaska 351 9 3.80 228 96.20 114 237 67.52 15.6
Tennessee 10,052 188 3.68 4,921 96.32 4,943 5,109 50.83 9.7
Hawaii 609 16 3.07 505 96.93 88 521 85.55 5.9
Wyoming 536 7 2.00 343 98.00 186 350 65.30 23.6
Figure 1. Impact of COVID-19 infections in China and the US‡.
The day when the number of total cases reached 100 was considered as Day 0
‡Data was obtained from https://www.worldometers.info/coronavirus/.
0 200 400 600 800 1000 1200
0 10 20 30 40 50 60
Nu
m
b
er
o
f
ca
se
s
USClosed cases: 19.45%
IDR: 29.41%
Hu n d re d s Thous ands Thous ands 0 20 40 60 80 100
0 10 20 30 40 50 60 70 80 90 100 110 120
Unlockdown
CHINA
Closed cases: 99.21%
IDR: 5.64%
Hu n d re d s Thous ands Thous ands
Days
Figure 2. Impact of COVID-19 infections in East Asian countries and Middle
East countries ‡.
The day when the number of total cases reached 100 was considered as Day 0.
‡Updated data was obtained from https://www.worldometers.info/coronavirus/.
Hun dre ds Tho us an ds Tho us an ds Hun dre ds Tho us an ds Tho us an ds Hun dre ds Tho us an ds Tho us an ds 0 5 10 15 20 25
0 10 20 30 40 50 60 70
SOUTH KOREA Closed cases: 85.20% IDR: 2.68%
SOUTH KOREA
Closed cases: 85.20%
IDR:2.68% 0 3 6 9 12 15
0 10 20 30 40 50 60 70
SINGAPORE
Closed cases:7.64%
IDR:1.23% 0 1 2 3 4 5
0 10 20 30 40 50 60 70
THAILAND
Closed cases:70.62%
IDR:2.00% 0 5 10 15 20 25
0 10 20 30 40 50 60 70
JAPAN
Closed cases: 16.69%
IDR: 17.18%
Hun dre ds Tho us an ds Tho us an ds 0 2 4 6 8 10
0 10 20 30 40 50 60 70
MALAYSIA
Closed cases:70.62%
IDR:2.42%
Nu
m
b
er
o
f
ca
se
s
0 0.2 0.4 0.6 0.8 10 10 20 30 40 50 60 70
HONG KONG
Closed cases: 78.52%
IDR: 0.49%
Hu n d re d s Thous ands Tho us ands 0 20 40 60 80 100
0 10 20 30 40 50 60 70
IRAN
Closed cases: 84.59%
IDR: 7.50%
0 4 8 12 16 20
0 10 20 30 40 50 60 70
ISRAEL
Closed cases: 50.58%
IDR: 2.64%
0 5 10 15 20 25
0 10 20 30 40 50 60 70
SAUDI ARABIA
Closed cases: 14.62%
IDR: 5.18%
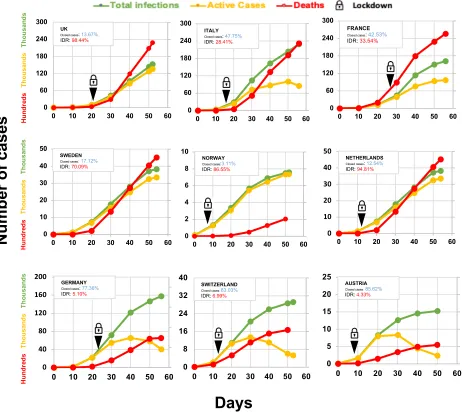
Figure 3.COVID-19 infections in Western European countries‡
The day when the number of total cases reached 100 was considered as Day 0.
‡Updated data was obtained from https://www.worldometers.info/coronavirus/
FRANCE
Closed cases: 42.53% IDR: 33.54% 0 60 120 180 240 300
0 10 20 30 40 50 60
UK
Closed cases: 13.67%
IDR: 98.44%
0 60 120 180 240 300
0 10 20 30 40 50 60
ITALY
Closed cases: 47.75%
IDR: 28.41%
0 60 120 180 240 300
0 10 20 30 40 50 60
0 10 20 30 40 50
0 10 20 30 40 50 60
SWEDEN
Closed cases: 17.12%
IDR: 70.09%
0 40 80 120 160 200
0 10 20 30 40 50 60
GERMANY
Closed cases:77.36%
IDR: 5.10%
0 8 16 24 32 40
0 10 20 30 40 50 60
SWITZERLAND
Closed cases:83.03%
IDR:6.99% 0 5 10 15 20 25
0 10 20 30 40 50 60
AUSTRIA
Closed cases:85.62%
IDR:4.33% 0 2 4 6 8 10
0 10 20 30 40 50 60
Thous
ands
NORWAY
Closed cases:3.11%
IDR: 86.55%
0 10 20 30 40 50
0 10 20 30 40 50 60
NETHERLANDS
Closed cases: 12.54%
IDR: 94.81%
Nu
m
b
er
o
f
ca
se
s
Days
FRANCEClosed cases: 42.53%
IDR: 33.54%