University of Pennsylvania
ScholarlyCommons
Publicly Accessible Penn Dissertations
2019
Surface Patterns On Single Cells: A Consequence
Of A Phase Transition To Modulated Phases
Asja Radja
University of Pennsylvania, [email protected]
Follow this and additional works at:
https://repository.upenn.edu/edissertations
Part of the
Biophysics Commons
This paper is posted at ScholarlyCommons.https://repository.upenn.edu/edissertations/3354
For more information, please [email protected].
Recommended Citation
Radja, Asja, "Surface Patterns On Single Cells: A Consequence Of A Phase Transition To Modulated Phases" (2019).Publicly Accessible Penn Dissertations. 3354.
Surface Patterns On Single Cells: A Consequence Of A Phase Transition
To Modulated Phases
Abstract
Patterns are ubiquitous in the world around us, and we have only begun to scratch the surface of
understanding their complexity and formation. In this thesis, we draw inspiration from rigid, extracellular
surface patterns found on single living cells in many taxa and try to understand if there is a common thread in
their pattern formation mechanisms that can be described by a single physical formalism. Pollen grains,
butterfly wing scales, and deep-sea protists called phaeodarians all have beautifully ornate and varied hard
surface structures that are likely patterned by the deposition of some soft organic matrix originating inside of
the cell. We focus on pollen grain surfaces because of their remarkable geometric variety that is well
documented. We find, through our own electron microscopy and careful histological techniques, that the
patterns arise due to a phase separation of a transient polysaccharide material mechanically coupled to the
underlying elastic cell membrane. We then show that the entire evolved diversity of patterns can be
recapitulated by exploring both the equilibrium states and the dynamics of a modified Landau-Ginzburg
model of phase transitions to modulated phases. We observe the surprising fact that only ~10% of extant
species exhibit patterns that reach equilibrium. Furthermore, we find that although these patterns have
evolved many times in seed plants, they are not, on average, selected for. The remaining 90% of pollen grain
surfaces resemble arrested intermediate states of the phase transition process. We then document the pattern
formation process in butterfly wing scales and show that a transient, spatially periodic surface material sits
between the global surface features of the scales (the ridges). We postulate that the phase transition of this
material may also contribute to the regular patterns on wing scale cells. We finally image the full
three-dimensional features of geodesic phaeodarians tests using x-ray-computed tomography.
Degree Type
Dissertation
Degree Name
Doctor of Philosophy (PhD)
Graduate Group
Physics & Astronomy
First Advisor
Alison M. Sweeney
Keywords
Pattern, Pattern Formation, Phase Transitions, Pollen
Subject Categories
Biophysics
SURFACE PATTERNS ON SINGLE CELLS: A CONSEQUENCE OF A PHASE TRANSITION TO MODULATED PHASES
Asja Radja A DISSERTATION
in
Physics and Astronomy
Presented to the Faculties of the University of Pennsylvania in
Partial Fulfillment of the Requirements for the Degree of Doctor of Philosophy
2019
Supervisor of Dissertation
________________________
Alison M. Sweeney, Associate Professor of Physics and Astronomy
Graduate Group Chairperson ________________________
Joshua Klein, Professor of Physics and Astronomy
Dissertation Committee
SURFACE PATTERNS ON SINGLE CELLS: A CONSEQUENCE OF A PHASE TRANSITION TO MODULATED PHASES
COPYRIGHT 2019
iii
ACKNOWLEDGEMENTS
This dissertation could not have been completed without the help of the incredible people in my academic and personal life. First, I would like to thank my advisor, Alison Sweeney, for her mentorship and guidance. I once heard Alison’s research described as the work that “as kids, we all wanted to grow up to do.” It wasn’t until I met Alison and heard her talk about her research that I realized it is possible to pursue your childhood dreams. I can’t thank her enough for helping me find a subject that I feel deeply connected to and passionate about. During my time in her lab, Alison gave me the freedom to explore any avenue I desired and always encouraged me to be curious about my work. She also directly supported my scientific development by personally teaching me the wet lab techniques I needed to develop to complete this work. In the later stages of my graduate school career, she taught me to be a better writer through her tireless edits and suggestions on both my manuscript and my postdoc applications. I am indebted to her for always encouraging me to do more than I thought I could. Next, I would like to thank Maxim
Lavrentovich, a mentor without whom this dissertation also would not have been possible. Max supported and pushed me to work on the theoretical and computational aspects of this
dissertation when I was uncertain of my abilities. He spent many hours, in many places
(restaurants, bars, my office), teaching me about Landau-Ginzburg theory and the computational tools we would need to explore our model. He opened the world of statistical mechanics research to me. I thank him for tolerating my stubbornness when I insisted on trying things the hard way, for being always available and willing to talk, and mostly, for taking me under his wing.
iv
Biological Systems class for the following fall semester. It was here that I was introduced to his incredible dedication to teaching, attention to detail, and contagious enthusiasm for physics. I will always regret not having made more use of my time with him. I would also like to thank my remaining committee members, Eleni Katifori and Ravi Sheth, for asking enthusiastic questions during my defense and for helpful discussions.
This work depended heavily upon the resources and scientists of many departments at UPenn. I would like to thank Ray Meade and Biao Zuo at the Electron Microscopy Resource Laboratory at the Perelman School of Medicine. They trained me in histology and electron microscopy and were always willing to entertain my endless questions. Thank you to Josh Darfler, Geraldine Lavin, and Samara Gray for keeping our plants healthy and happy and for finding all of the plants whose pollen I wanted to image. I was also very fortunate to have had the opportunity to work with the Center for Teaching and Learning. The CTL staff (Bruce Lenthall, Ian Petrie, Catherine Turner, Emily Elliott, Julie McGurk and Sara DeMucci) works tirelessly to train students and faculty while retaining a humor and enthusiasm for teaching that is incredibly contagious. Finally, I’d like to thank our business administrators and staff who have helped me tremendously in organizing my class schedule and getting lab supplies.
Lastly, I’d like to thank my friends and family. Thank you to all of the current and former members of Alison’s lab with whom I’ve interacted: Amanda Holt, James Townsend, Jill Cai, Stephen Hackler, and Emile Kraus. Thank you Nathan Whelan, Michael Tassia, and Alex Serrano for teaching me about the creatures in our trawl bucket during our cruises. Thank you to Natalie Sanchez for her help with initial work on this project; I learned a lot from mentoring such an eager and hard worker. I would like to especially thank Dillion Fox and Lincoln Relm who have spent many hours critiquing my talks, editing my manuscripts, and discussing science with me; they have become my close friends outside of the lab and I will dearly miss them. I would also like to thank the members of the soft matter theory group; there is a long list of people who have
v
for the wonderful conversations we’ve had. I have also had the opportunity to meet incredible graduate students from other departments: I would like to thank Jiaqi Liu for teaching me about liquid crystals and NingWei Li for teaching me about Langmuir troughs and lipid rafts. Thank you to my friends outside of graduate school that helped me maintain a balanced life: Paige Gembala, David Choi, Noor Alani, Summer Alani, Sarah-Grace Nisperos, Lili Tang, Alex Topete, and my Singapore family. A special thanks to Kyndal Favreau for our almost bi-weekly calls, and to Gunjan Chitnis Merchant. Not many people have the opportunity to live next door to their childhood best friend, more than a thousand miles away from home. Thank you to Gunjan for showing me how to get up no matter how many times life tries to knock you down. Thank you also to Adnan Merchant for always being there.
vi
DEDICATION
vii
ABSTRACT
SURFACE PATTERNS ON SINGLE CELLS: A CONSEQUENCE OF A PHASE TRANSITION TO MODULATED PHASES
Asja Radja Alison M. Sweeney
Patterns are ubiquitous in the world around us, and we have only begun to scratch the surface of understanding their complexity and formation. In this thesis, we draw inspiration from rigid, extracellular surface patterns found on single living cells in many taxa and try to understand if there is a common thread in their pattern formation mechanisms that can be described by a single physical formalism. Pollen grains, butterfly wing scales, and deep-sea protists called phaeodarians all have beautifully ornate and varied hard surface structures that are likely
viii
TABLE OF CONTENTS
Title page
i
Acknowledgements
iii
Dedication
vi
Abstract
vii
List of tables
xi
List of figures
xii
1 Introduction
1
1.1 Pattern formation………1
1.2 Landau-Ginzburg theory of phase transitions………5
1.3 Modulated phases………..7
1.3.1 Modulated phases on 2D flat, infinite sheets………...7
1.3.2 Modulated phases wrapped on a sphere……….9
1.4 Outline of thesis………11
2 Pollen wall development imaging
13
2.1 Pollen development……….14
2.2 Growing plants and sample collection………...………...16
2.3 Electron microscopy………...…….17
2.3.1 Transmission electron microscopy…………...……….17
2.3.2 Scanning electron microscopy………18
2.3.3 Results………19
2.4 Primexine composition analysis……….22
2.4.1 Background………22
ix
2.4.3 Monosaccharide and linkages analysis of primexine………..…...24
2.4.4 Results………25
2.5 Conclusion……….29
3 Theoretical model for pollen pattern formation
31
3.1 Introduction………31
3.2 Microscopic model………32
3.2.1 Estimating
λ
from biological values………...………38
3.3 Phase diagram exploration……….41
3.3.1 Locating equilibrium states………...…………..41
3.3.2 Annealing schedule………..43
3.3.3 Reducing redundancies in free energy…………...………..44
3.3.4 1- and 2-mode approximation……….………45
3.3.5 Gradients and Hessians. ………...………….46
3.3.6 Comparing simulations to SEM images………48
3.4 Kinetic arrest states……….………51
3.4.1 Dynamics model……….……….……….52
3.4.2 Results……….……….……….54
3.5 More phase diagram exploration……….…………..……….…..55
3.5.1 Higher
ls
……….………...…….………...55
3.5.2 Adding more
l
modes to the summation in free energy…….……56
3.5.3 Relating flat sheet phase diagram to spherical case………..……59
4 Applications of the theory: Evolutionary trait reconstruction analysis
67
4.1 Background……….……….……….67
x
4.3 Results……….……….……….…72
5 Other biological systems
76
5.1 Butterfly wing scales……….……….………..76
5.1.1 Introduction……….……….………..78
5.1.2 Butterfly wing scale imaging……….…...………...79
5.1.3 Results……….……….……….81
5.2 Phaeodarians……….……….……….83
5.2.1 Introduction……….……….………..83
5.2.2 Sample collection and identification………..84
5.2.3 SEM of organic material……….………...………..85
5.2.4 X-ray-computed tomography……….……….…86
5.2.5 Conclusions……….……….……….88
6 Conclusion
90
Appendix
93
xi
LIST OF TABLES
Table 2. 1: Glycosyl composition analysis 1……….…….………...……..25
Table 2. 2: Glycosyl composition analysis 2………..……...….….26
Table 2. 3: Linkages analysis………...………...…..28
Table 3. 1:
,
values for species in Figure 3.5..……….…….….………51
Table 4. 1: Papers used to categorize pollen for evolutionary analysis…...…..70
Table 4. 2: Model rates and probabilities……….………...…………....75
xii
LIST OF FIGURES
Figure 1. 1: Patterns in nature……….……….…………..…….1
Figure 1. 2: Similar surface patterns on spherical cells span across taxa………4
Figure 1. 3: Figure shows stripes and bubble domains in 2D and 3D organic systems….8
Figure 2. 1: Pollen development schematic………...….14
Figure 2. 2: Plant anther growth…………...………...………...………...………...……...…16
Figure 2. 3: Callose wall removal SEM…………...………...………...………...………...…19
Figure 2. 4: Passiflora incarnata primexine phase separation…………...………...…..20
Figure 2. 5: Biochemical pathways that lead to cell wall development…………...22
Figure 2. 6: Pollen grains sent for monosaccharide and linkages analysis…………...…23
Figure 2. 7: Glycosyl composition analysis 1………...………...………...………...……27
Figure 2. 8: Glycosyl composition analysis 2…………...………...………...………...…27
Figure 2. 9: Primexine polysaccharide composition schematic…………...………...…29
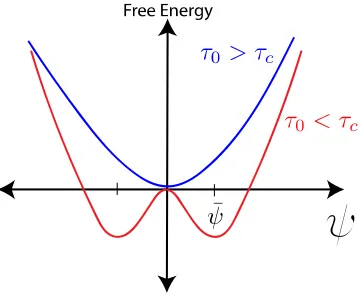
Figure 3. 1: Phase transition of with as the control parameter……..……...………..33
Figure 3. 2: Free energy minimization during simulated annealing…………...……….…43
xiii
Figure 3. 4: Phase diagram of simulations at equilibrium…………...………...………...47
Figure 3. 5: Equilibrium pollen patterns…………...………...………...………...………...50
Figure 3. 6: Kinetically arrested pollen patterns…………...………...………...………...54
Figure 3. 7: One- mode approximation,
3 < < 22
…………...………...………...……56
Figure 3. 8: Two-mode approximation,
3.5 < < 16.5
…………...………...………...….56
Figure 3. 9: Schematic of
………...………...………...………...………...….57
Figure 3. 10: Three-mode approximation…………...………...………...………...………...58
Figure 3. 11: Five-mode approximation…………...………...………...………...………...58
Figure 3. 12: Latitudinal stripes pollen comparison….………...………...………...……….59
Figure 3. 14: Flat case phase diagram with spherical case patterns….………...………..65
Figure 4. 1: Angiosperm Phylogenetic Tree with Character States….………...………....72
Figure 5. 1: Butterfly wing scales geometry…………...………...………...………...……...78
Figure 5. 2: Lamellae of butterfly wing scales…………...………...………...………...…...78
Figure 5. 3: Vanessa cardui wing scale development…………...………...………...82
Figure 5. 4: Covering of wing scale during development…………...………...………...…83
Figure 5. 5: Image of phaeodarian taken on R/V Hugh R. Sharp………85
Figure 5. 6: SEM of organic structure on phaeodarian surface…………...………...86
Figure 5. 7: Hollow silica tubes. …………...………...………...………...……...………...87
1
Chapter 1
Introduction
1.1 Pattern Formation
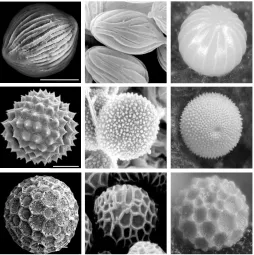
Figure 1. 1: Patterns in nature. (a) Scanning electron micrograph (SEM) of false-colored pollen grains showing intra-specific pattern stability and interspecific pattern variation. Clockwise from the top left, Spathiphyllum cannifolium, Passiflora incarnata, and Aster. (b) SEM of Vanessa cardui butterfly wing scales showing parallel ridges and perpendicular ribs. (c) X-ray-microcomputed tomography surface rendered image of Aulosphaera triodon Phaeodarian showing geodesic siliceous test.
2
creates patterned cells (Hohenberg and Swift, 1995). Patterns exist in both the physical world as, for example, ocean waves or the hexagonal rock formation of the Giant’s Causeway (Goehring, L and Morris SW, 2005), and in living systems; and the theories of pattern formation mechanisms that govern final patterned structures in both cases are vast and multidisciplinary. Usually we associate crystal-like symmetries, and the precision that accompanies them, with inanimate objects such as snowflakes or rock formations; however, many equally regular and geometric patterns arise in the biological world. For example, the minimal surfaces seen in soap films also exist as gyroids in some butterfly wing scales to produce the beautiful iridescent properties famous in Parides sesostris (Wilts et al., 2011). Moreover, looking through the vast array of
possible biological patterns, we start to discover that some patterns emerge over and over again in systems and under conditions that appear to have nothing in common. So we ask ourselves: how many patterns in the biological world arise due to cells’ transcriptomes directly encoding the construction of a structure block-by-block, and how many arise due to passive self-assembly by physical forces?
Studying pattern formation in living systems requires the insights and tools from many fields including molecular and developmental biology, material science, physics and mathematics. Fundamentally, biological systems are much more complex than non-living ones, and although there has been much progress in both the understanding of genetic pathways and the molecular and cellular biology required to build patterns from these blueprints, detailed mechanisms outlining how genes influence patterns are still elusive in many systems. Although it seems natural to assume that complexity in patterns requires a perfectly-tuned system in which
3
consequence of the physical laws that govern our universe? So, in this thesis, we broadly ask: Is there a way to simplify some biological patterns while capturing their key features to quantify their formation with an elegant, unifying theory; and does approaching these problems of
understanding the origin of form from a physical point of view allow us to better approach these problems of pattern formation and to better understand our systems?
In this thesis, we add to the growing body of biophysics by focusing on pattern formation within a fundamental unit of life: the cell. The surfaces of cells can be highly decorated with awe-inspiring patterns (Fig. 1.1 and 1.2). Typically these decorations are external to the cell, and many organisms use membranes as scaffolds for building these robust, protective, and sometimes beautifully patterned layers. In this work, we define three necessary components to form such rigid structures: the cell membrane; a soft, secreted material that undergoes phase separation; and a secondary layer of cross-linked material deposited after phase separation and according to the previously established pattern. Although the plasma membrane is often recognized in playing a role in surface patterning, in this thesis, we show that an ephemeral soft material is also an essential component in the pattern formation of ultimately hard surface structures in organisms spanning several kingdoms.
4
we introduce two additional systems, butterfly wings and phaeodarians, showing imaging evidence that they may generate patterns in a physically analogous manner.
It should also be highlighted that although living organisms are typically far from equilibrium, these surface structures form in the extracellular space, where they can reach equilibrium because there is little or no active metabolism. Thus, we can confidently apply the statistical physics field of phase transitions to equilibrium states to our systems. Furthermore, the micron-sized patterning on spherical surfaces is not unique to pollen grains only; similar patterns of stripes, spikes, and hexagons are found across taxa on fungal spore and insect egg surfaces (Fig. 1.2). The universality of these such patterns on biological cells further suggests that the pattern formation process may not be dependent on the unique biological properties of each individual system, but is rather a physical process that results as a consequence of the physical laws that govern the world around us.
Figure 1. 2: Similar surface patterns on spherical cells span across taxa. Row one shows stripes, row two shows spikes, and row three shows hexagonal holes. Column one are examples of pollen grains (Spathiphyllum cannifolium, Iva xanthiifolia (Halbritter, 2012), and Phlox drummondii
5
1.2 Landau-Ginzburg theory of phase transitions
Phase transitions are the phenomenon of substances or materials changing from one phase to another. They describe many types of changes, most commonly transitions between solid, liquid and gas states, but can also describe many other transitions that are commonly associated with breaking of symmetries. A microscopic description of a collection of interacting particles close to a phase transition point is excessively complicated and material dependent. Instead, a “coarse-grained”, phenomenological approach, developed by Landau to describe continuous phase transitions, is a more feasible method of encapsulating the changes of a system. This mean-field formalism is based on an order parameter, , that measures the degree of order across the phase transition boundaries, i.e. it is usually 1 in the “ordered” state and 0 in the “disordered” state. Furthermore, a conserved order parameter is one whose value averaged over the entire system does not change during a phase transition, which will be relevant in our dynamics model of the phase separation in section 3.4. In the vicinity of a critical point, the free energy can be written as a Taylor expansion in the order parameter:
, = + 2 !+"
3 #+$4 &+ ⋯ (1. 1)
Higher order terms can be included, but truncating at the fourth order term allows you to still retain the physics of the phase transition. The only stipulation is that the largest power must be even, and the coefficient in front of it positive to ensure positive-definiteness. If changes sign from positive to negative or below some critical value, the minimum energy changes from = 0 to ≠ 0 resulting in a phase transition. The Landau-Ginzburg model, inspired by Landau’s original model, has a similar formulation but includes contributions from derivatives of the order parameter, , (Goldenfeld, 1992). At this point, without loss of generality, we will focus on the type of phase transition that will be described in this thesis: phase transitions of biological
6
most commonly seen in the experimental system, a Langmuir trough, where the molecules are at the air/liquid interface. We do not neglect the internal degrees of freedom in our treatment of monolayers since we want to describe the global properties of the film that emerge from the internal phase transition of the monolayer itself. We do, however, neglect effects due to fluctuations, for the sake of simplicity. In the following paragraph, we review the canonical description of in-plane phase separation in 2D infinite sheets (e.g. Gebhart et al., 1977; Leibler and Andelman, 1987) as a basis for discussion of the properties of modulated phases, and to show how we can extend the theory to describing cell surface morphologies by wrapping these sheets on a sphere. We will eventually see (section 2.3.3) that pollen grain surface patterns form due to a phase separation of a transient material coupled to the underlying cell membrane, so this phenomenological description is particularly useful.
Consider a 2D sheet, which can represent a biological membrane, in which two types of incompatible molecules, A and B, fully cover the sheet; we assume they can diffuse in the plane but cannot be compressed. The ordered parameter in this case is characterized by the relative composition, ≡ + , where = 0 represents an equal mixture of A and B molecules ( > 0 would represent an excess of A molecules, for example, and < 0 would conversely represent an excess of B molecules). Because molecules A and B are incompatible, they will try to minimize their interactions by fully phase segregating into two coexisting domains, an A-rich domain and a B-rich domain. The boundary between these two domains has a line tension that represents the energy cost associated with forming boundaries which is related to the gradient of the order parameters, ∇ . It is this boundary that requires us to use the Landau-Ginzburg formalism. Near the critical demixing (phase transition) point, and assuming the order parameter and its gradients are small, the free energy of this mixture can be expressed as the Landau-Ginzburg free energy in powers of the order parameter and its gradient,
7
where , > 0 and is a temperature-like term that is quenched below some critical value during pattern formation. Note that odd terms are allowed, they explicitly break the symmetry and allow us to model the situation in which there is a greater concentration of one molecule; as long as the largest power of the expansion is even, this is allowed. The four phenomenological parameters,
, ,$, and , all emerge from coarse-graining the system; they are potentially complicated and unknown functions of the specific molecular and biochemical (in this case) properties of the system. Experiments can be used to identify the numerical values for these parameters by exploring the theoretical phase space and relating it to the behavior of physical systems that exhibit the described modulated phases. The first term in Eq. 1.2 represents the lowest order approximation to the energy cost associated with local variations of that occur at domain boundaries. Minimizing this energy while keeping , , > 0 results in the lowest energy configuration being the uniform field, = 0, which can be interpreted as the homogenous, well-mixed phase. If < 0, then the minimum energy state has two degenerate solutions, + =
±7 / , that represent A-rich regions and B-rich regions patterned in such a way that they will fully phase segregate to minimize the boundary between them.
1.3 Modulated Phases
1.3.1 Modulated phases on 2D flat, infinite sheets
8
for with a unifying mechanism where the patterned domains represent modulations of some order parameter that is tuned by changing the strengths of the competing forces.
Figure 1. 3: Figure shows stripes and bubble domains in 2D and 3D organic systems. (A and B) Monomolecular Langmuir films showing (A) stripe and (B) bubble phases with a wavelength of ~3.5 ;< and
~20 ;<, respectively. (C and D) Block copolymers exhibiting (C) stripes and (D) bubble phases with wavelengths of (C) ~0.4 ;< and (D) ~0.16 ;<. All images adapted from other sources, (A) (Weis and McConnell, 1984), (B) (Losche and Mohwald, 1984), (C) Thomas and Witten, 1990), (D) (Hasegawa and Hashimoto, 1992)
The above Landau-Ginzburg formulation does not describe modulated phases. So we now add to this model through the addition of another order parameter that is coupled to the original and that favors a different equilibrium state (although there are other ways to get modulated phases, we focus on the eventually physically relevant one for our biological systems). Physically, these two competing trends towards equilibrium will result in a modulated phase. In biological membrane systems, this second order parameter is simply the membrane height field characterized by its surface tension and bending rigidity that allow for distortion of the membrane. Once these two fields are coupled mathematically and their interactions accounted for, it is possible to develop a new model in which modulated phases can form due to competing
9
ℋ = 0 1!2 31
2 =|∇ℎ + |!+12 ?@∇!ℎ + A! 5 (1. 3)
where ℎ + represents the height of the membrane above a reference plane, = represents the surface tension, and ? represents the bending modulus. We next write down the coupling term between the fields:
ℋB = 0 1!2@Λ + ∇!ℎ + A (1. 4) where Λ measures the coupling strength. The total free energy is the sum of three terms, Eq. 1.2, 1.3, and 1.4, such that ℋ D = ℋ/+ ℋ + ℋB. The membrane terms can be integrated out, and after a Fourier transform, the effective free energy depends only on E:
ℋGG= 0 1!H IE EJ12 KL −Λ !
= N H!+Λ
!?
2=!H&O + 0 1!2 32| + |!+$3 | + |#+ 4| + |&5
(1. 5)
An interesting consequence of this effective free energy is that if the coupling constant, Λ, exceeds a critical value, Λ > L= P/!, then a curvature instability is developed that is correlated to a pattern of different composition domains with the wavenumber, H∗= 2R/ @ STU
VT / WL −S T
VW A
X T. Although this is one example of a mean-field treatment of modulated phases on 2D sheets based on the Landau-Ginzburg free energy functional, other models have been expanded upon that are similar and result in the same general conclusions. Phase diagrams for such systems have been calculated by comparing the mean field free energies of the uniform, striped, and hexagonal phases (Leibler and Andelman, 1987). These phases have also been studied experimentally in Langmuir films (Benvegnu and McConnel, 1992; Seul, 1993).
1.3.2 Modulated phases wrapped on a sphere
10
been demonstrated in fluorescence microscopy experiments of ternary lipid systems of giant unilamellar vesicles (GUVs). It has been shown that a decrease in temperature in these systems results in a phase transition from a uniform, mixed state to a phase-separated state with liquid-ordered (LO) and liquid-disordered (Ld) regions (Veatch and Keller, 2003). These experiments
have been confirmed with other techniques such as small-angle neutron scattering (Pencer et al., 2005; Pabst et al., 2010), infrared spectroscopy (Silvius et al., 1996), and Förster resonance energy transfer (Heberle et al., 2010). Furthermore, they have been seen with computer simulations (Sodt et al., 2014; Pantelopulos et al., 2017) and have been theoretically described (Radhakrishnan and McConnell, 2005; Almedia, 2009; Putzel and Schick, 2011; Svetlovics et al., 2012; Lingowood and Simons, 2010). The understanding of the behavior of lipid in-plane phase transitions in spherical membranes is fundamental for inferring how biological processes, such as cell signaling and other cooperative phenomena across the cell, occur.
The same kind of formalism has been used to describe the formation of virus capsids (Dharmavaram et al, 2016; 2017), which are also intricately patterned spherical objects, and block copolymer defect structures on spherical substrates (Zhang et al, 2014). Discretized versions of the equilibrium states of patterned spherical objects have also been computationally explored (Zhang et al, 2014; Sirgist and Matthews, 2011). More recently, a phase diagram of multicomponent lipid vesicles was computed using theoretical techniques and Monte Carlo simulations, and the effects of thermal fluctuations on the phase boundaries were explored (Luo and Maibaum, 2018).
11
patterns on spherical surfaces during the evolution of the patterns, as expected from the flat 2d case (Guttenburg et al., 2010).
1.4 Outline of thesis
The diversity and beauty of pollen grain surface patterns have intrigued scientists for decades, yet no unifying theory has emerged to explain either the pattern formation mechanism or the function of these surface features (Fig. 1.1). In chapter 2 we introduce the main system we developed to explore the theoretical ideas outlined above: pollen grains. We discuss the known steps of the development and pattern features on these plant cell surfaces, and highlight how the electron microscopy techniques we cultivated to image these features allowed us to determine that a material on the pollen surface was phase separating to template the final pattern. In chapter 3 we then develop a model to describe a phase transition to a modulated phase on a spherical surface, and quantify how the topology of a sphere leads to a much richer morphospace of possible patterns than the 2D flat case. We then apply our theory to extant pollen grain
morphologies, developing a theoretical pollen morphospace, and demonstrate that all biological morphologies can be described either as energy minimum or as kinetically arrested states of our theory. In chapter 4 we address the applications of this pollen pattern formation theory. First, we answer the question, has there been evolutionary selection for symmetric patterns, or are these patterns the result of evolutionary drift of a separate biochemical process? Next, we address an engineering application. If the complete relationships between developmental parameters, resulting shapes and function are determined then engineering problems can be solved by simply mimicking nature’s mechanisms.
There is a need for surface patterned particles in several engineering applications including drug delivery, in the development of catalysts and sensors, and for molecular
12
intensive top-down fabrication conditions that previously produce patterns lacking in versatility and variability. Finally, in chapter 5 we examine two additional systems: butterfly wing scales and phaeodarians, and suggest how a similar mechanism of pattern formation may apply to describe these surface patterns.
Our work has elucidated the answer to decades-posed questions about how pollen patterns form, the origin of such a diversity of patterns, and why these patterns exist. Our theory and simulations of pollen development describe a robust mechanism for patterning spherical surfaces that may also inform the development of micron-scale patterns in other taxa that have hardened extracellular matrices, such as insect cuticle and fungal spore wall. This theory also has the potential utility as a classification scheme since nearly all pollen patterns can be recapitulated by a unique set of parameters in the model. We also briefly describe an engineered system that may indicate how some of these parameters ultimately map to the biochemistry and timing of pollen development. More generally, the subject of pattern formation in biology and the idea of phase separation forming patterns is rapidly growing. However, this system is unique in that it is an example of a biological system that may go to equilibrium, unlike most living systems, because the extracellular region does not have metabolic, living processes that would keep it out of
13
Chapter 2
Pollen Wall Development Imaging
Pollen grains are the single-celled male gametophytes of seed-producing plants (including angiosperms, or flowering plants, and gymnosperms, which are mostly conifers). They develop through meiosis of a single mother cell that typically produces four daughter cells, each between
14
2.1 Pollen development
In mature pollen, the outermost layer of the extracellular material is highly patterned and called the exine (Fig. 2.1(a)). The exine is a chemically and physically robust outer wall made of sporopollenin, a complex, highly resistant chemical whose structure and composition are not fully described (Ariizumi and Toriyama, 2011). Apart from the structure of the exine itself, pollen can be patterned with a varying number and geometric arrangement of apertures, which are regions of the extracellular material that have a reduced or absent exine. They are the sites where the pollen tube emerges during germination (Blackmore and Crane, 1998), and they allow the pollen grain to reversibly fold during desiccation and rehydration (Katifori et al, 2010).
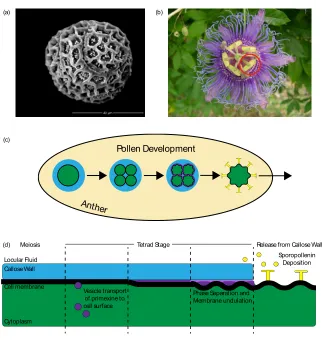
Figure 2. 1: Pollen development schematic. (a) An SEM image of a mature Passiflora incarnata pollen grain, the pollen we studied in this work. (b) A Passiflora incarnata flower with the anther circled indicating where pollen development occurs. (c) Schematic of the cross section of an anther and a single developing pollen
(a) (b)
(d)
Anther
Pollen Development
(c)
Callose Wall
Cytoplasm
Vesicle transport of primexine to cell surface
Phase Separation and Membrane undulation
Sporopollenin Deposition
Cell membrane
Meiosis Tetrad Stage Release from Callose Wall
15
grain indicating the four fundamental developmental steps of the pollen wall. First, the pollen grain starts as a mother cell that goes through meiosis to produce four daughter cells. Then, the transient primexine is deposited to the surface and the cell membrane begins to undulated. Finally, the cell is released from the callose wall through enzymatic digestion, and the sporopollenin is deposited on the surface. The colors represented are indicated in (d). (d) Schematic of a single pollen cell surface. The deposition of the primexine is further broken down into two steps indicating we found that the primexine is deposited to the surface initially as uniform matrix that then phase separates and causes the underlying cell membrane to undulate.
The general developmental steps that pollen cells of all plant species follow are well-characterized (Owen and Makaroff, 1995). Pollen development occurs in a liquid environment of the flower’s anther. During meiosis, the cell wall of the meiotic mother cell fails to completely divide, leaving the resulting daughter pollen cells encapsulated. As a result, the daughter cells are enclosed in a structure called the callose wall, and are isolated from the rest of the anther fluid. The callose wall has an unusual composition of β-1,3 glucan, which provides an experimental strategy for its selective degradation to access the developing pollen grains (Nishikawa et al, 2005). The developing pollen cells then secrete a material called the “primexine” to the cell surface; the primexine accumulates between the cell’s plasma membrane and the callose wall. Its composition is not well-characterized but is likely to be a high molecular weight polysaccharide (Heslop-Harrison, 1968). It has been established that the global pattern features of the mature pollen wall (exine) are somehow templated by the developing primexine layer during this enclosed “tetrad” stage (Blackmore et al, 2007; Skvarla and Larson, 1966; Godwin et al, 1967), though the physical mechanism driving this process remains undescribed. Following this global templating by the primexine, the callose wall dissolves and sporopollenin is secreted by adjacent tapetal cells and accumulates on the pollen cell surface, resulting in the patterned exine layer of mature pollen (Fig. 2.1(a)).
16
easy to identify, and we excluded them from our pattern analysis in evaluating possible pattern formation mechanisms via a primexine template. It is clear that there is no one unified cell developmental mechanism of aperture formation across plants (Rowley, 1975); therefore, we adopt the definition that apertures are simply thin regions of the exine material.
2.2 Growing plants and sample collection
We chose to study the development of pollen from Passiflora incarnata because the plant is a
prolific vine, making all flower developmental stages continuously accessible for imaging.
Passiflora incarnata plants were purchased from Shady Oak Butterfly Farm and grown at the
University of Pennsylvania Department of Biology greenhouse under a 16hour/day light cycle at a mean temperature of 770F. Fresh buds with pollen of the correct developmental stage were
identified by anther color (paler anthers did not have sporopollenin deposition yet); it was found that anther size was not a good determinate of pollen developmental stage (Fig. 2.2), similar to findings in other species (Browne et al., 2018). Developing anthers were immediately dissected out of the flower buds, and the pollen developmental stage in a given bud was determined by removing pollen from a single anther, pressing the anther between glass slides for examination with a brightfield optical microscope. Only pollen in the tetrad stage was kept for further analysis.
Figure 2. 2: Plant anther growth. (a) Variously sized buds at various stages of development. (b) Growth of anthers (inside buds), the last data point for each color represents a mature anther that has desiccated. It is obvious from this that anther length and stage of pollen development are not necessarily correlated, and we cannot use anther size as a metric for pollen development.
! ! "# $ $"# % %"# & &"# ! # $! $# %! ' ( )* + ,-./ 0+ -1 23
4-5/3 +-1678. 4
(a)
17
2.3 Electron Microscopy
2.3.1 Transmission electron microscopy
We performed transmission electron microscopy (TEM) to observe pollen cell wall development in
Passiflora incarnata. Pollen developmental images in the literature are obtained almost
exclusively using TEM because the micron size of the features requires electron microscopy. In our case, it was additionally necessary to see changes in the primexine and plasma membrane features so cross sections through the cell were particularly useful.
In preparation for TEM imaging, samples must first be chemically fixed so that the ultrastructure of cells embedded in a polymer medium and imaged in high vacuum is as similar to that of the living cell as possible. Typically, gluteraldehyde is used to quickly fix cells by cross-linking their proteins, which instantly arrests metabolic events and preserves spatial relationships in the cell. Gluteraldehyde preservation also allows us to subsequently stain the cell to highlight particular features without, again, ruining the spatial relationships within the cell. Polysaccharides, however, are often lost when samples are preserved solely with aldehydes, since they wash out of the tissue in downstream sample processing steps, to the point that adding formaldehyde to a sample is used as a screening test for the presence of polyaccharides that are collected as a gel at the bottom of the preservation vessel (Szirmai, 1962). Because they are in a highly hydrated state, polysaccharides preserved by alcohols are significantly shrunken and consequently structurally altered, so the imaged ultrastructure is a significant deviation from that of living cells. However, preservation of polysaccharides in much of the pollen literature has not been prioritized. Alcian blue has been identified as useful for the life-like fixation and staining of wall
polysaccharides and has been used for this purpose in more recent studies of pollen wall
development (Gabarayeva, 2002). It has the advantage of both better preserving polysaccharides and as a stain to highlight them better in TEM sections.
18
osmium tetroxide for 30 minutes to fix the lipids and aid visualization of the plasma membrane. Next, an ethanol dehydration was performed to remove water from the samples, and finally samples were embedded in Spurr’s resin. Transverse ultrathin sections of 70 nm were then cut with a Diatome diamond knife on a Reichert Ultracut-S microtome. Secondary staining was done with uranyl acetate and lead citrate to help enhance contrast in the images. Sections were placed on copper mesh grids and imaged with a JEOL JEM-1010 electron microscope.
2.3.2 Scanning electron microscopy
Scanning electron microscopy (SEM) has rarely been used to image pollen development. Part of the challenge is that the developing primexine is encased by a callose wall that keeps the primexine hidden from view when imaging the surface in SEM. Thus the callose wall needs to be removed to expose the primexine to be able to observe its development. To do this, we first separated pollen in the tetrad stage from anthers and then enzymatically removed the callose walls as follows (described in Kirkpatrick and Owen, 2013). The pollen grains from a single developing flower were placed in 1 mL of 0.3% w/v cellulase, pectolyase and cytohelicase, 1.5% sucrose, and 1% polyvinylpyrolidone for 1-2 hours (Sigma-Aldrich; Milwaukee, MI). We found that leaving pollen grains in the callose-wall-removal solution for one hour removed just the callose wall and left the underlying primexine intact; leaving pollen grains in the solution for two hours, however, lead to the digestion of some of the underlying primexine and allowed us to better visualize just the dense regions of primexine and the underlying undulating cell membrane (Fig. 2.3). If the samples that were left in this solution for more than 1 hour, the less dense regions of primexine were also digested away, leaving only the most dense regions of primexine exposed on the surface. We were also able to mechanically break open some of the pollen grains not treated with the callose wall-removal chemicals and found that the underlying surface was very similar that of the chemically treated one, confirming that the treatment did not fundamentally alter the underlying primexine structure. Next, the exposed pollen grains were fixed in 3%
19
minutes. They were then placed in handmade Nitex bags of about 1 cm2, and the bags were then
heat sealed. Samples were then submerged in 1x PBS for 5 minutes, followed by an ethanol dehydration series. Samples were initially dried with hexamethyldisilazane (HMDS), a chemical with a reduced surface tension compared to that of water that avoids the destructive action the surface tension of a meniscus during drying (Braet et al, 1996). While it has been proven to be a simpler, more cost-effective, and faster method than critical point drying that doesn’t require equipment and produces the same results as conventional critical point drying (Shively and Miller, 2009; Braet et al, 1996), its slightly corrosive properties prove to be too strong for the delicate primexine surface. So samples were instead critical-point dried in CO2 in a Tousimi
Autosamdri-850. After drying, pollen grains were removed from the bags, dusted onto SEM stubs and sputter coated with a ~10 nm thick layer of gold-palladium using an SPI Module Sputter Coater. The thickness was calculated to be thick enough to remove the charging effects during SEM imaging, but thin enough to not interfere with the primexine features and induce a change in the
primexine’s appearance. Finally, samples were imaged using a FEI Quanta FEG 250 in high vacuum.
Figure 2. 3: Callose wall removal SEM. The callose wall (pictured in the left SEM image) surrounding four daughter cells is intact during meiosis of Passiflora incarnata meiosis. After 1 hour of digestion with the callose-wall-removal solution, the callose wall was completely removed, exposing the underlying primexine of a single daughter cell (middle SEM image). After 2 hours of digestion with the callose-wall-removal solution, some of the primexine was also enzymatically digested away, leaving only the most dense primexine regions and exposing the undulating cell membrane surface underneath (right SEM image).
2.3.3 Results
20
from 3 anthers imaged out of the 50 or so that were processed in total. These observations further suggest that the pattern formation process happens quickly as a physical process
governed by thermodynamic forces rather than a deposition process dictated by the cytoskeleton.
Figure 2. 4: Passiflora incarnata primexine phase separation. We define five developmental steps of pattern formation occurring after meiosis and prior to callose wall dissolution; the sixth step represents mature pollen. Development proceeds left to right. The first row contains a schematic representation of each step. The second row shows TEM images, the third row shows SEM images with the callose wall enzymatically removed, and the fourth row shows SEM images where the callose wall was mechanically opened but not enzymatically removed. In general, the surface of developing pollen is similar whether the callose wall was removed enzymatically or mechanically. Arrowheads in columns 2 and 3 indicate the location of the primexine on the cell membrane surface. Arrowheads in columns 4 and 5 indicate the location of dense primexine that causes the cell membrane to locally curve. The circle in column 5 highlights initial formation of probacula/sites of sporopollenin deposition. Column 6 TEM is of mature Salix alba (Diethart, 2016). All not labeled scale bars represent 10 μm.
Based on our observations in electron microscopy, we divided the developmental trajectory of pollen in the tetrad state into six distinct stages. In the first stage, after meiosis but before primexine secretion, the plasma membrane did not undulate, there was little or no extracellular material present, and the cell surface was smooth over length scales of about a micron (Fig. 2.4, col. 1). In the second stage, we observed the primexine material appear on the cell surface (Fig. 2.4, col. 2, arrowhead). This material was initially uniform in electron density,
1 2 4 5
21
and the plasma membrane underneath became more irregular, apparently in response to the presence of the material on the cell surface, but there was not a characteristic wavelength in the membrane; the SEM of this developmental stage shows the appearance of a dough-like material on the surface of the cell (Fig. 2.4, col. 2). In the third stage, the primexine began developing heterogeneities in electron density, and the corresponding SEM showed clumping of the surface material into regions of ~0.5;< in width, but there was still no characteristic wavelength in the membrane undulation (Fig. 2.4, col. 3). In the fourth stage, the primexine heterogeneities became more pronounced and the plasma membrane began to undulate with a characteristic wavelength; the SEM at this stage shows distinct domains of separated primexine material on the cell surface with regions of positive curvature separating these domains (Fig. 2.4, col. 4).
In the fifth stage, the phase separation of primexine was complete, with two geometrically regular materials of distinctly different density in contact with the cell membrane. Electron-dense domains (condensed phase) were located on top of regions of negative membrane curvature, and were surrounded by a less electron-dense phase (dilute phase) associated with regions of
positive membrane curvature (Fig. 2.4, col. 5). After primexine phase separation was completed, probacula (sites of sporopollenin accumulation) began forming on the plasma membrane, between electron-dense regions of primexine material and on regions of positive membrane curvature (Fig. 2.4, col. 5, circled). A dilute phase of primexine can also be observed between the pools of the denser phase in an image of tetrad pollen with a broken callose wall but no
22
2.4 Primexine composition analysis
2.4.1 Background
Despite the predicted importance of the primexine in the pattern formation process of pollen grain cell walls, its composition and the genetic and biochemical pathways responsible for its formation have not been well-studied. Primexine is considered to be a transient plant cell wall, so it is reasonable that its composition is similar to that of other plant cell wall materials, i.e. contains celluloses, hemicelluloses, pectins, and some proteins. Heslop-Harrison hypothesized in 1968 that primexine is likely to be a mixture of high molecular weight polysaccharides based on staining and cellulase treatment studies that identified the presence of cellulose in the primexine (Heslop-Harrison, 1968). A recent study of Arabidposis thaliana genetic knockouts with abnormal pollen, IRREGULAR XYLEM9-LIKE (irx9l) and uneven pattern of exine (upex), similarly suggest
that the details of primexine biochemistry matter for pattern formation. The irx9l mutants lack xylan epitopes in the primexine, while upex mutants have irregular surface patterns due to a lack
of galactosylation of arabinogalactins in the primexine (Li et al, 2017).
Figure 2. 5: Biochemical pathways that lead to cell wall development. Figure adapted from (Jiang et al, 2012).
Sporopollenin biosynthesis
Met-GalUA, Met-RG II Methylesterified pectin,
PMC primart cell wall formation
GalUA, RG II Methylesterified pectin
pectin cleavage, PMC primary cell wall degradation
PMEs, EC 3.1.1.11
(QRT1)
PGs, EC 3.2.1.15
(QRT2, QRT3)
UDP-glucose callose synthases EC 2.4.1.34 (GSL1/CalS11, GSL2/CalS5, GSL5/CalS12/PMR4, GSL8/CalS10, GSL10/CalS9, KNS1, KNS11, KNS2/SPS) callase EC 3.2.1.39
(Osg1, BnA6, NtTag)
Callose wall formation
Callose wall degradation
Met-GalUA, Met-RG I, Met-RG II
GalUA, RG I, RG II
Intine formation TCA
cycle
Glucose-6-phosphate
glycosyltransferases
EC 2.4.1.x
Pyruvate Pyruvate dehydrogenase Acetyl-CoA Malonyl-CoA KAS III Malonyl-ACP ACP
S-CoA + CO2
KAS I
PMEs,
EC 3.1.1.11
PGs,
EC 3.2.1.15
(BcMF2BcMF9)
Other regulators
(MS1/HKM, MS33)
C12:0-ACP C12:0-CoA C12:0 7-OH-C12:0 16-OH-C16:0 18-OH-C18:n (n=0, 1, 2, 3)
16-OH-C16:0-CoA 18-OH-C18:n CoA (n=0, 1, 2, 3,)
Acyl-CoA Synthetase
EC 2.3.1.86
(ACOS5)
Acyl-CoA synthetase
EC 2.3.1.86
(ACOS5)
Fatty acid in-chain hydroxylases
EC 1.14.16.5 (CYP703A2) Fatty acid -hydroxylases (CYP704B1, OsCYPB2, BcCYP86MF?) Acyl-CoA Synthetase EC 2.3.1.86
(ACOS5) 7-OH-C12:0-CoA
C16:0, C18:n - ACP (n=0, 1, 2, 3,)
ACP reductase
EC 1.1.1.100
(MS2, OsDPW)
WDA1 ?
KAS IKASII
Polyketide synthases
EC 2.3.1.74
(PKSA/LAP6, PKSB/LAP5) C30:0 aldehydes 3-OH-CHS 4-OH-CHS CHS?
(LAP3?)
liquirtigen naringen
CHI
flavonoids
Thioesterase
EC 3.2.1.23
Tri ketide -pyrones, Tetraketide -pyrones
Tetratide -pyrone reductase
(TKPR1, TKPR2) Hydroxylated a-pyrone
phenolics Fatty alcohol
Acyl-CoA synthetase
(ACOS5) C16:0-CoA C18:n-CoA (n=0, 1, 2, 3)
Thioesterase
C16:0, C18:n (n=0, 1, 2, 3)
C29:0 alkanes (VLCFAs) CO2 Malonyl-CoA ABCG26/WBC27, OsC7, LeGPR92 Other enzymes
(FLP1, WAX2, CER3,YRE, CER4)
Sporopollenin transportation Exine formation
Pollen wall development
FAE
23
2.4.2 Sample preparation
Figure 2. 6: Pollen grains sent for monosaccharide and linkages analysis. a. Passiflora incarnata, b.
Spathiphyllum cannifolium
As described above, pollen grains at the tetrad stage were collected to analyze their primexine composition. In order to identify if different species have different primexine compositions, we analyzed samples from two distantly related species: Passiflora incarnata, a eudicot,and
Spathiphyllum cannifolium, a monocot (Fig. 2.6). Pollen from Passiflora incarnata was removed from anthers by simply cutting the anther end off and squeezing the pollen out of the anther tubes. Spathiphyllum cannifolium have a spadix that contains the anthers, so the anthers first had
to be carefully dissected out. Spathiphyllum cannifolium anthers are also particularly small (<1cm)
so we used a mortar and pestle to free pollen grains from the dissected-out anthers because cutting off the anther end and squeezing them out was destructive and time-consuming. Distilled water was added to the solution of anther skins and freed pollen grains and centrifuged and filtered through a 10µm nitex mesh to isolate the pollen grains from the anther skins. We then
enzymatically removed the callose walls using the method described in section 2.2.3, and whole pollen grains (without their callose walls) were frozen and shipped over dry ice to the Complex Carbohydrate Research Center at the University of Georgia (CCRC) for a glycosyl composition and linkages analysis. Approximately 25 anthers of Passiflora incarnata and 2 spadices of Spathiphyllum cannifolium were dissected to produce samples containing about 100 µg of
primexine.
24
2.4.3 Monosaccharide and linkages analysis of primexine
The CCRC performed the following protocol to determine the structure of the polysaccharides isolated from primexine material. The monosaccharide composition and linkages analyses were performed by combined gas chromatography/mass spectrometry (GC/MS) of the
per-O-trimethylsilyl (TMS) derivatives of the monosaccharide methyl glycosides produced from the sample by acidic methanolysis as described previously by Santander and colleagues (Santander et al, 2013). Briefly, the sample (300 ug) was heated with methanolic HCl in a sealed screw-top glass test tube for 17 h at 80 °C. After cooling and removal of the solvent under a stream of nitrogen, the sample was treated with a mixture of methanol, pyridine, and acetic anhydride for 30 minutes. The solvents were evaporated, and the sample was derivatized with Tri-Sil® (Pierce) at 80 °C for 30 min. GC/MS analysis of the TMS methyl glycosides was performed on an Agilent 7890A GC interfaced to a 5975C MSD, using an Supelco Equity-1 fused silica capillary column (30 m × 0.25 mm ID).
25
2.4.4 Results
Sample Glycosyl residue Mass (;g) Mol %
Spathiphyllum
cannifolium Arabinose (Ara) 0.4 0.4
Ribose(Rib) n.d. -
Rhamnose (Rha) 1.9 1.9
Fucose (Fuc) n.d. -
Xylose (Xyl) 0.4 0.4
Glucuronic Acid (GlcA) n.d. -
Galacturonic acid (GalA) n.d. -
Mannose (Man) 1.2 1.1
Galactose (Gal) 3.7 3.3
Glucose (Glc) 103.6 92.9
N-Acetyl Galactosamine (GalNAc) n.d. -
N-Acetyl Glucosamine (GlcNAc) n.d. -
N-Acetyl Mannosamine (ManNAc) n.d. -
SUM 111.1 100.0
Total Carbohydrate % by weight 37.0 %
Sample Glycosyl residue Mass (;g) Mol %
Passiflora
incarnata Arabinose (Ara) 1.1 2.3
Ribose(Rib) n.d. -
Rhamnose (Rha) 1.3 2.6
Fucose (Fuc) n.d. -
Xylose (Xyl) 0.5 1.1
Glucuronic Acid (GlcA) n.d. -
Galacturonic acid (GalA) n.d. -
Mannose (Man) 1.9 3.4
Galactose (Gal) 1.8 3.2
Glucose (Glc) 49.5 87.3
N-Acetyl Galactosamine (GalNAc) n.d. -
N-Acetyl Glucosamine (GlcNAc) n.d. -
N-Acetyl Mannosamine (ManNAc) n.d. -
SUM 56.2 99.9
Total Carbohydrate % by weight 18.7 %
26
Sample Glycosyl residue Mass (;g) Mol %
Spathiphyllum cannifolium
Ribose (Rib) n.d. -
Arabinose (Ara) 0.6 1.2
Rhamnose (Rha) 1.7 3.1
Fucose (Fuc) 0.3 0.5
Xylose (Xyl) 0.3 0.7
Glucuronic Acid (GlcA) n.d. -
Galacturonic acid (GalA) 1.3 2.0
Mannose (Man) 1.2 2.0
Galactose (Gal) 1.7 2.9
Glucose (Glc) 53.3 87.5
N-Acetyl Galactosamine (GalNAc) n.d. - N-Acetyl Glucosamine (GlcNAc) 0.2 0.2
N-Acetyl Manosamine (ManNAc) n.d. -
SUM 60.7
Sample Glycosyl residue Mass (;g) Mol %
Passiflora incarnata
Ribose (Rib) n.d. -
Arabinose (Ara) 0.2 0.2
Rhamnose (Rha) 0.7 0.7
Fucose (Fuc) 0.2 0.2
Xylose (Xyl) 0.4 0.4
Glucuronic Acid (GlcA) n.d. -
Galacturonic acid (GalA) 0.8 0.6
Mannose (Man) 1.5 1.3
Galactose (Gal) 1.4 1.2
Glucose (Glc) 106.9 95.2
N-Acetyl Galactosamine (GalNAc) n.d. - N-Acetyl Glucosamine (GlcNAc) 0.1 0.1
N-Acetyl Manosamine (ManNAc) n.d. -
SUM 112.2
27
Figure 2. 7: Glycosyl composition analysis 1. Spathiphyllum cannifolium (blue) and Passiflora incarnata (orange) normalized mole percent of glycosyl residues after glucose is removed.
Figure 2. 8: Glycosyl composition analysis 2. Spathiphyllum cannifolium (blue) and Passiflora incarnata (orange) normalized mole percent of glycosyl residues after glucose is removed.
The carbohydrate analyses informed us that there is both a difference in the monosaccharide content between species and in different samples of the same species (Table 2.1 and 2.2; Fig 2.7 and 2.8). Glucose (Glc) is the most abundant residue in both samples, but both contain many different monosaccharides in small amounts. Galactose (Gal), arabinose (Ara) and rhamnose (Rha) are found in pectin polysaccharides, whereas glucose (Glc), gluosamine (GlcNAc), xylene (Xyl), fucose (Fuc) and mannose (man) are found in hemicelluloses. We have all of these
60
50
40
30
20
10
0
Ara
Rha
Xyl
Man
Gal
m
ol
%
Spathipyllum cannifolium
Passif ora incarnata
30
25
20
15
10
5
0
m
ol
%
Ara
Rha
Fuc
Xyl
GalA Man
Gal
GlcNAc
28
monosaccharides in our composition analysis and nothing more. The results of the first composition analysis do not contain Fuc, GalA, or GlcNAc; however, there was some in both samples for the next analysis. There are enough inconsistencies in the data between the
compositional analyses that it really might be the case that our results are going to depend on the specific tetrad stage of our pollen samples or that were are too close to the resolution limit and so they are highly dependent on the sample preparation methods.
Peak Passiflora incarnata area % Spathiphyllum cannifolium area % Terminal Arabinofuranosyl residue (t-Araf) 0.4 0.2 2-linked Rhamnopyranosyl residue (2-Rha) 0.5 0.9 Terminal Mannopyranosyl residue (t-Man) 2.1 2.6 Terminal Glucopyranosyl residue (t-Glc) 66.5 79.6 Terminal Galactofuranosyl residue (t-Galf) 0.2 0.3 Terminal Glucofuranosyl residue (t-Glcf) 1.2 1.3 Terminal Galactopyranosyl residue (t-Gal) 1.2 1.4 4-linked Xylopyranosyl residue (4-Xyl) 0.1 - 3-linked Glucopyranosyl residue (3-Glc) 3.2 1.5
2-linked Mannopyranosyl residue (2-Man) 1.4 1.2 2-linked Glucopyranosyl residue (2-Glc) 1.0 0.6 3-linked Galactopyranosyl residue (3-Gal) - 0.2 6-linked Glucopyranosyl residue (6-Glc) 2.3 1.4 4-linked Galactopyranosyl residue (4-Gal) 0.5 - 4-linked Glucopyranosyl residue (4-Glc) 16.8 7.9 2,3-linked Mannopyranosyl residue (2,3-Man) 0.1 - 6-linked Galactopyranosyl residue (6-Gal) 0.1 - 3,4-linked Glucopyranosyl residue (3,4-Glc) 0.8 0.2
2,4-linked Mannopyranosyl residue (2,4-Man) 0.1 - 2,4-linked Glucopyranosyl residue (2,4-Glc) 0.2 - 2,6-linked Mannopyranosyl residue (2,6-Man) 0.3 - 4,6-linked Glucopyranosyl residue (4,6-Glc) 1.0 0.5
Table 2. 3: Linkages analysis. The percentage of each detected monosaccharide linkage in the two samples.
The most abundant linkages are terminal and 4-linked glucose, followed by 3-linked and then 6- linked glucose. The terminal linkages are mostly likely free monosaccharides in the cell
cytoplasm, not in the primexine. Spathiphyllum and Passiflora have comparable amounts of 4-,3-, and 6-linked glucose. Spathipyllum has fewer multi-linked residues that Passiflora, thus it is likely
29
2.5 Conclusion
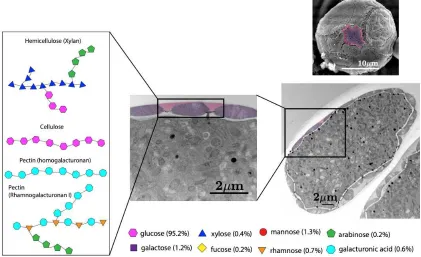
Figure 2. 9: Primexine polysaccharide composition schematic. Pollen SEM shows two types of polysaccharide on pollen surface, indicated by pink and purple false-colored regions. TEMs also show these two polysaccharide types whose composition may be a combination of hemicelluloses, cellulose, and pectins.
The glycosyl composition and linkages analysis of primexine material prepared from developing
Passiflora incarnata and Spathiphyllum cannifolium pollen showed a polysaccharide material
formed from linkages of a complex mixture of monosaccharides. Given that the small amount of material (112.2 µg) we were able to isolate is close to the technique’s detection limit, it was not
30
31
Chapter 3
Theoretical model for pollen pattern
formation
3.1 Introduction
Given our observations in electron microscopy, we treat the primexine as a phase-separating concentration field on a spherical surface. The phase separation introduces heterogeneities (e.g., a locally varying pressure or preferred curvature) and a local buckling of the plasma membrane. Such heterogeneities, when coupled to the elasticity of a membrane, are known to create spatially modulated structures (Leibler and Andelman, 1987). In pollen, a mechanical coupling between the polysaccharide matrix and membrane may be promoted by the presence of the outer callose wall that encapsulates extracellular polysaccharides near the cell membrane during pattern formation. Initial pattern formation could then occur via a phase transition of the
32
We show that the preponderance of extant pollen patterns can be explained through a phase transition of the primexine coupled to the plasma membrane during cell development. We also show novel experimental corroboration of a densification and pooling of primexine material leading to membrane undulations at the wavelength of the mature pollen pattern in Passiflora incarnata, a species whose exine is reticulate (foamy). This mechanism implies that evolutionary
pattern diversity is to be expected, given the general chemical composition and physical makeup of the pollen grain during development and that the spherical surface of pollen grains must accommodate spherical defects in the resulting pattern. Further, most of the ordered states observed in evolved pollen pattern diversity can be recapitulated with a unique set of parameters in our theory. Our theory is also able to account for patterns generated by this physical
mechanism that do not reach an energy minimum. A surprise in our results is that the majority of mature, extant pollen patterns do not exist at energy minima within this pattern formation
landscape; there apparently has been no strong evolutionary selection for symmetry via pattern equilibration in pollen. Finally, we propose a new way of characterizing pollen patterns motivated by this physical theory that is grounded in the physiology of pollen development.
3.2 Microscopic model
We treat the formation of the pollen surface patterns as a phase separation of the primexine mechanically coupled to the underlying plasma membrane and enclosed in the callose wall. It should be noted that we are not modeling any detailed material properties of the primexine, but we do assume that it is able to phase separate, similar to mixtures of other high molecular weight extracellular polysaccharides such as hemicellulose and pectin (Tolstoguzov, 2006; Agoda-Tandjawa et al., 2012; Domozych et al., 2014; MacDougall et al., 1997) . This model is described in more detail in a previous study where the effects of thermal fluctuations on patterned states were additionally considered (Lavrentovich et al., 2016). The present work focuses on a