371 | P a g e
A FOOD RECOGNITION SYSTEM FOR DIABETIC
PATIENTS USING SVM CLASSIFIER
K.Ganesh Prabu
M.E Student, Raja College of Engineering and Technology, Madurai, TamilNadu, (India
)
ABSTRACT
Computer vision-based food recognition could be used to estimate a meal’s carbohydrate content for diabetic patients. This study proposes a methodology for automatic food recognition, based on the bag-of-features (BoF) model,GLCM and LBP features. Moreover, the enhancement of the visual dataset with more images will improve the classification rates, especially for the classes with high diversity. The final system will additionally include a food segmentation stage before applying the proposed recognition module, so that images with multiple food types can also be addressed. The optimized system computes dense local features, using the scale-invariant feature transform on the HSV color space and texture features and these extracted features are trained and classified using SVM classifier. The system achieved classification accuracy of the order of 90%, thus proving the feasibility of the proposed approach in a very challenging image dataset.
Keywords: Diabetic Patients, Recognition Module, Optimized System, Texture Features
I. INTRODUCTION
The treatment of Type 1 diabetic (T1D) patients involves exogenous insulin administration on a daily basis. A
prandial insulin dose is delivered in order to compensate for the effect of a meal [1]. The estimation of the
prandial dose is a complex and time-consuming task, dependent on many factors, with carbohydrate (CHO)
counting being a key element.Clinical studies have shown that, in children and adolescents on intensive insulin
therapy, an inaccuracy of ±10 g in CHO counting does not impair postprandial control [2], while a±20 g variation significantly impacts postprandial glycaemia [3]. There is also evidence that even well-trained T1D
patients find it difficult to estimate CHO precisely [4]–[6]. In [4], 184 adult patients on intensive insulin were
surveyed with respect to the CHO content of their meals. On average, respondents overestimated the CHO
contained in their breakfast by 8.5% and underestimated CHO for lunch by 28%, for dinner by 23%, and for
snacks by 5%. In [5], only 23% of adolescent T1D patients estimated daily CHO within 10 g of the true amount,
despite the selection of common meals.
The increased number of diabetic patients worldwide, together with their proven inability to assess their diet
accurately raised the need to develop systems that will support T1D patients during CHO counting. So far, a
broad spectrum of mobile phone applications have been proposed in the literature, ranging from interactive
diaries [7] to dietary monitoring based on on-body sensors [8]. The increasing processing power of the mobile
devices, as well as the recent advances made in computer vision, permitted the introduction of image/video
analysis-based applications for diet management [9]–[14]. In a typical scenario, the user acquires an image of
372 | P a g e
side—in order to extract a series of features describing its visual properties. The extracted features are fed to aclassifier to recognize the various food types of the acquired image, which will then be used for the CHO
estimation. A food recognition application was introduced by Shroffet al. [9] for the classification of fast-food images into four classes. For each segmented food item, a vector of color (normalized RGB values), size, texture
(local entropy, standard deviation, range), shape, and context-based features is computed and fed to a
feed-forward artificial neural network (ANN), resulting in recognition accuracy of the order of 95%, 80%, 90%, and
90% for hamburgers, fries, chicken nuggets, and apple pies, respectively. A set of color (pixel intensities and
color components) and texture (Gabor filter responses) features was used by Zhu et al. [10], together with a support vector machine (SVM) classifier, for the recognition of 19 food classes, leading to a recognition rate of
the order of 94% for food replicas and 58% for real food items.Kong and Tan [11] proposed the use of scale
invariant feature transform (SIFT) features clustered into visual words and fed to a simple Bayesian probabilistic
classifier that matches the food items to a food database containing images of fast-food, homemade food, and
fruits. A recognition performance of 92% was reported given that the number of references per food class in the
database is larger than 50 and the number of food items to be recognized is less than six.
II. RELATED WORK
Puriet al. [14] proposed a pairwise classification framework that takes advantage of the user’s speech input to
enhance the food recognition process. Recognition is based on the combined use of colorneighborhood and
maximum response features in a texton histogram model, feature selection using Adaboost, and SVM classifiers.
Texton histograms resemble BoF models, using though simpler descriptors, such that histograms of all possible
feature vectors can be used. In this way, the feature vector clustering procedure can be omitted; however, less
information is considered by the model which might not be able to deal with high visual variation. Moreover,
the proposed system requires a colored checker-board captured within the image in order to deal with varying
lighting conditions. In an independently collected dataset, the system achieved accuracies from 95% to 80%, as
the number of food categories increases from 2 to 20.
A database of fast-food images and videos was created and used by Chen et al. [15] for benchmarking of the food recognition problem. Two image description methods were comparatively evaluated based on color
histograms and bag of SIFT features for a seven fast-food classes problem. The mean classification accuracy
using an SVM classifier was 47% for the color histogram based approach and 56% for the SIFT-based
approach. However, the used patches are sampled with the SIFT detector which is generally not a good choice
for image classification problems, and described by the standard grayscale SIFT that ignores any color
information.
The combined use of bag of SIFT, Gabor filter responses, and color histograms features in a multiple kernel
learning (MKL) approach was proposed by Joutouet al. [16] for the recognition of Japanese food images. However, the employed BoF model uses the conventional scheme of fixed-size SIFT features clustered with
standard k-means, while the additional color and texture features are global and are not included into the BoF architecture. For the 50 food classes problem, a mean recognition rate of 61% was reported. The present study
373 | P a g e
images was created, reflecting the nutritional habits in central Europe [17]. The foods appearing in the imageshave been organized into 11 classes of high intravariability. Based on the aforementioned dataset, we conducted
an extensive investigation for the optimal components and parameters within the BoF architecture.
III. PROPOSED METHOD
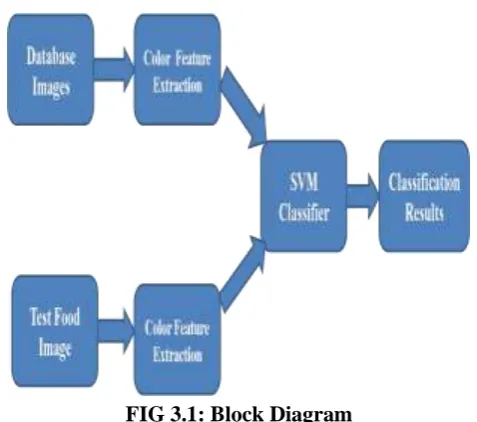
FIG 3.1: Block Diagram
3.1 Food Image Description
In order to describe the appearance of the different food classes, the BoF model was adopted, due to its proven
ability to deal with high visual diversity and the absence of typical spatial arrangement within each class. BoF
consists of four basic steps: 1) key point extraction, 2) local feature description, 3) learning the visual dictionary,
and 4) descriptor quantization. All the steps, as presented in Fig. 1, are involved in both training and testing,
except for the learning of the dictionary, which is performed only once, during the training phase. 1) Key Point Extraction: Key points are selected points on an image that define the centers of local patches where descriptors will be applied. In the current study, three different key point extraction methods were tested: interest point
detectors, random sampling, and dense sampling. Interest point detectors, such as SIFT [18], are considered as
the best choice for image matching problems where a small number of samples is required, as it provides
stability under local and global image perturbations. SIFT estimates the key points by computing the maxima
and minima of the difference of Gaussians (DoG), applied at different scales of the image.
3.2 Local Feature Description
After the key point extraction, a local image descriptor is applied to a rectangular area around each key point to
produce a feature vector. Identifying the appropriate descriptor size and type for a recognition problem is a
challenging task that involves a number of experiments. For the determination of the optimal descriptor size, the
size of the object to be recognized should be considered. Although the SIFT interest point detector provides the
position of the key points together with their scale, it is rarely used for image classification, as already
explained. Hence, the size of the descriptor must be specified somehow after the dense or random key point
374 | P a g e
sufficient information for the description. However, the use of larger sizes or combination of sizes can oftengive better results by resembling the multiscale image description of the SIFT detector. It should be noted that
food images are scaled to a standard size, so differences in food items scale should not be extreme.
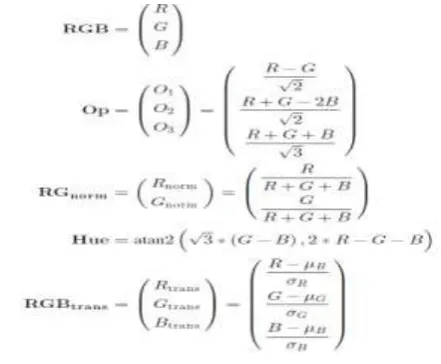
3.3. Color Histograms
Color histograms are probably the most common color descriptors. They represent the color distribution of an
image in a certain color space and—despite their simplicity—they have been successfully used in various object
recognition applications [20]. For the proposed system, five color histograms were considered covering different
combinations of invariants: HistRGB, HistOp, HistRGnorm, HistHue, and HistRGBtrans calculated in the RGB color space (1), the opponent color space (2), the RG normalized channels (3), the Hue channel (4), and the
transformed RGB color space (5), respectively:
3.4. SVM
SVMs are a set of related supervised learning methods that analyze data and recognize patterns, used for
classification and regression analysis. The standard SVM takes a set of input data, and predicts, for each given
input, which of two possible classes the input is a member of, which makes the SVM a non-probabilistic binary
linear classifier. Since an SVM is a classifier, then given a set of training examples, each marked as belonging to
one of two categories, an SVM training algorithm builds a model that predicts whether a new example falls into
one category or the other.
375 | P a g e
Fig. 3.3 (a)-(c) High Calorie food images
Fig 3.3.(a)-(c) Low Calorie food images
IV. SIMULATION RESULT
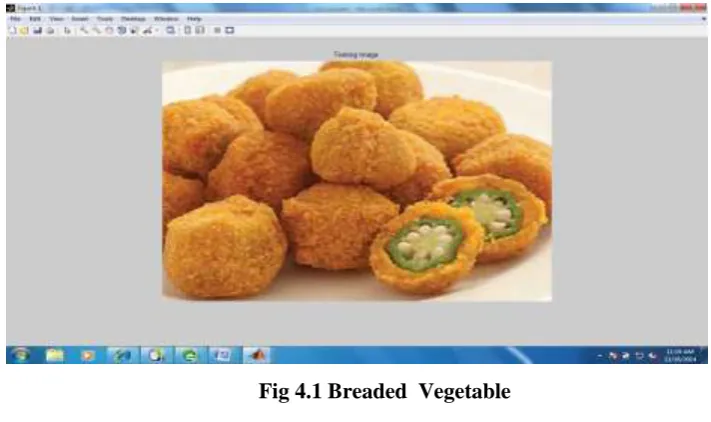
4.1 High Calorie Food Image
376 | P a g e
Fig 4.1 Breaded Vegetable
4.2 Local Binary Pattern Features
Fig 4.2 Local Binary Pattern
4.3 Gray Level Co-Occrrence Matrix Feature
377 | P a g e
High Calorie FoodContrast = 147.1183
Correlation = 0.9709
Energy = 0.0008
Homogeneity = 0.2983
V.CONCLUSION
I
n this paper, we propose a BoF-based system for food image classification, as a first step toward thedevelopment of a portable application, providing dietary advice to diabetic patients through automatic CHO
counting. The final system will additionally include a food segmentation stage before applying the proposed
recognition module, so that images with multiple food types can also be addressed.
REFERENCES
[1] American Diabetes Association, ―Standards of medical care in diabetes- 2010,‖ Diabetes Care, vol. 33, no.
1, pp. S11–S61, 2010.
[2] C. E. Smart, K. Ross, J. A. Edge, C. E. Collins, K. Colyvas, and B. R. King, ―Children and adolescents on intensive insulin therapy maintain postprandial glycaemic control without precise carbohydrate counting,‖
Diabetic Med., vol. 26, no. 3, pp. 279–285, 2009.
[3] C. E. Smart, B. R. King, P. McElduff, and C. E. Collins, ―In children using intensive insulin therapy, a 20-g
variation in carbohydrate amount significantly impacts on postprandial glycaemia,‖ Diabetic Med., vol. 29,
no. 7, pp. e21–e24, Jul. 2012.
[4] M. Graff, T. Gross, S. Juth, and J. Charlson, ―How well are individuals on intensive insulin therapy counting carbohydrates?‖ Diabetes Res. Clinical Practice, vol. 50, suppl. 1, pp. 238–239, 2000.
[5] F. K. Bishop, D. M. Maahs, G. Spiegel, D. Owen, G. J. Klingensmith, A. Bortsov, J. Thomas, and E. J.
Mayer-Davis, ―The carbohydrate counting in adolescents with type 1 diabetes (CCAT) study,‖ Diabetes Spectr., vol. 22, no. 1, pp. 56–62, 2009.
[6] C. E. Smart, K. Ross, J. A. Edge, B. R. King, P. McElduff, and C. E. Collins, ―Can children with type 1
diabetes and their caregivers estimate the carbohydrate content of meals and snacks?‖ Diabetic Med., vol. 27, pp. 348–353, 2010.
[7] M. C. Rossi, A. Nicolucci, P. D. Bartolo, D. Bruttomesso, A. Girelli, F. Ampudia, D. Kerr, A. Ceriello,
L.Mayor, F. Pellegrini, D. Horwitz, and G. , ―Diabetes interactive diary:Anewtelemedicine system enabling
flexible diet and insulin therapy while improving quality of life: An open-label, international, multicenter,
randomized study,‖ Diabetes Care, vol. 33, no. 1, pp. 109–115, 2010.
[8] O. Amft and G. Tr¨oster, ―Recognition of dietary activity events using on-body sensors,‖ Artif.Intell.Med.,
378 | P a g e
[9] G. Shroff, A. Smailagic, and D. P. Siewiorek, ―Wearable context-aware food recognition for caloriemonitoring,‖ in Proc. 12th IEEE Int. Symp. Wearable Comput., 2008, pp. 119–120.
[10] F. Zhu, M. Bosch, I. Woo, S. Y. Kim, C. J. Boushey, D. S. Ebert, and E. J. Delp, ―The use of mobile devices in aiding dietary assessment and evaluation,‖ IEEE J. Sel. Topics Signal Process., vol. 4, no. 4, pp.
756–766, Aug. 2010.
[11] F. Kong and J. Tan, ―DietCam: Automatic dietary assessment with mobile camera phones,‖ Pervasive
Mobile Comput., vol. 8, pp. 147–163, Feb. 2012.
[12] L. Fei-Fei and P. Perona, ―A bayesian hierarchical model for learning natural scene categories,‖ in Proc. IEEE Comput. Soc. Conf. Comput. Vis. Pattern Recog., 2005, vol. 2, pp. 524–531.
[13] T. Joachims, ―Text categorization with support vector machines: Learning with many relevant features,‖ in
Proc.10th Eur. Conf. Mach. Learning, 1998, pp. 137–142.
[14] M. Puri, Z. Zhu, Q. Yu, A. Divakaran, and H. Sawhney, ―Recognition and volume estimation of food intake using a mobile device,‖ in Proc. Workshop Appl. Comput. Vis., 2009, pp. 1–8.
[15] M. Chen,K.Dhingra,W.Wu, L.Yang, R. Sukthankar, and J.Yang, ―PFID: Pittsburgh fast-food image
dataset,‖ in Proc. 16th IEEE Int. Conf. Image Process., 2009, pp. 289–292.