doi:10.4236/am.2011.28133 Published Online August 2011 (http://www.SciRP.org/journal/am)
Spectral Dependence of the Degree of Localization in a 1D
Disordered System with a Complex Structural Unit
Gleb G. Kozlov
Institute of Physics, Saint-Petersburg State University, Saint-Petersburg, Russia E-mail: [email protected]
ReceivedApril 28, 2011; revised May 19, 2011; accepted May 26, 2011
Abstract
We analyze the spectral distribution of localisation in a 1D diagonally disordered chain of fragments each of which consist of coupled two-level systems. The calculations performed by means of developed pertur-bation theory for joint statistics of advanced and retarded Green’s functions. We show that this distribution is rather inhomogeneous and reveals spectral regions of weakly localized states with sharp peaks of the local-ization degree in the centers of these regions.
m
Keywords:Anderson Localization, Spectral Distribution, Green’s Function, 1D Disordered Chain
1. Introduction
The 1D models were traditionally studied in the theory of solid state for obtaining qualitative data, which were then used to analyze more realistic 3D models. For example, the exactly solvable Kronig-Penny model, which demon- strates the most important qualitative properties of the translationally symmetric systems, such as the band type of the energy spectrum and possibility of the wave- vector-based classification of states, provided a basis for the modern theory of crystalline media. As the second (and far from the last) example may serve the Ising model in the theory of phase transitions, in which the exact analysis of the 1D model has shown a decisive role of dimentionality of the system for observation of its critical behavior. These examples, pertaining to the time when the solid state physics was at the stage of accumulation of knowledge show that analysis of even abstract 1D models (which do not correspond to any real physical system) may give an important qualitative information.
Note that, at present, there are all grounds to believe that the 1D models appear to be also important in other respects. Up-to-date technologies of material production and experimental techniques make it possible to create and study objects (quantum superlattices, quantum wires, J-aggregates, optical waveguiding fibers, etc.) that can be described quantitatively using such models. Still, the heuristic significance of the 1D models can be consi- dered, nowadays, as the most important.
Among models of the physics of disordered systems, which, at present is also at the stage of accumulation of information, the 1D models occupy a particularly impor- tant place. At this stage, a consistent mathematical analysis of even an abstract model, capable of giving reliable and non-trivial results, is of interest. As examples of such an analysis may serve publications [1-4].
As is known [5,6], an important property of the homogeneously disordered systems is the appearance of localized states in their single-particle spectrum. Since these states play a decisive role in calculations of the charge transfer in disordered systems, any information about them is considered to be valuable. For getting information of this kind, in [7], a consistent perturbation theory for joint statistics of the advanced and retarded Green’s functions was proposed. This theory allows one to calculate distribution of the degree of localization of states (in the sense of the Anderson criterion [5,6]) as a function of their energy (called, hereafter, spectral dependence of the degree of localization). The calcu- lation presented in [7] refers to the classical case of a disordered chain with a simplest structural unit, namely, a two-level system. The goal of this paper is, first, to generalize the method proposed in [7] to the case of a disordered chain with a more complicated structural unit —a segment comprised of coupled two-level systems, and, second, to calculate spectral dependence of the degree of localization in such a system. The main quanti- tative result of the paper is derivation of an analytical
formula for the above degree of localization. The for- mula thus derived shows that distribution of the degree of localization over the energy spectrum, for the model with , is essentially inhomogeneous and is charac- terized by appearance of energy points in which the states are virtually delocalized. This result provides grounds for the following qualitative conclusion: Spec- tral distribution of the degree of localization, in the 1D systems, may be essentially inhomogeneous and may reveal strongly pronounced maxima and minima. This behavior of the degree of localization qualitatively differs from that for the case of considered in [7].
> 1 m
1 m
m
= 1 m
The fact that such a model with can exhibit unusual behaviour was described in [8] where for a binary disordered chain of dimers the indications of delocalization were founded.
= 2 m
The above model with complex structural unit can also be used as a simplest one describing the correlated disorder with parameter playing the role of corre- lation length. The optical properties of similar random system were studied in [9] and it was shown that so called factor of optical amplification for such system display nonmonotonic dependance on correlation length. The important role of correlations was pointed out in [10] where the authors put forward arguments in favor of appearance of delocalized states in the case of spectral density of correlation function having the form
1 S k k .Note that, in our opinion, the model of disordered chain with a complex structural unit, considered below, is, at any rate, not more abstract than the classical model with , whereas, in qualitative respect, it is, perhaps, even closer to real systems than the classical model.
= 1 m
2. Formulation of the Problem, and the Main
Results
Let us pass to quantitative formulation of the problem. Consider a 1D chain of two-level atoms consisted of fragments with the length . We assume that splittings of all the atoms within a fragment are the same, while the disorder is provided by randomness of the splittings from fragment to fragment. The splittings corresponding to different fragments will be considered as independent random quantities with a known distribution function . Such a system differs from the standard one by that the structural unit is a fragment of coupled two-level systems, rather than a single two-level system. Thus, the Hamiltonian matrix
m
P
m
H, in the studied model, will have a usual form
, = , , 1 , 1, ,
r r r r r r r r r = 1, ,
H r r N (1)
where the diagonal elements r correspond to the
fragments described above. If, for example, m= 2, then
1= 2 3= 4 5= 6
, ,
and the elements
1 3 5
P
are the random independent quantities with the distribution function
. The off-diagonal ele- ments equal to unity determine the energy scale. In what follows, we will imply the thermodynamic limit.
N
D t
0
For this model, we consider the following problem. Let the edge atom is excited at , and we have to find the probability that this atom remains in the excited state at . Methematically, it means that the initial state of the system is described by the wave function (vector-column) with the components
= 0
t
0 = ,r r N
, and we have to find D= N
t
2N
(the angle brackets indicate averaging over realizations of the random splitting r, =r 1,, ). Time depen- dence of the wave function is given by the formula
t = exp
iHt 0
D
. It follows herefrom that the quantity , we are interested in, can be expressed in terms of eigenvectors and eigenvalues
, = 1, , E N
of matrix (1) as follows
2
2 2
N N
4
=
=lim exp
=
N
t
N
D t
i E E t
(2)
The quantity is known to be crucial in the theory of Anderson localization [5-7], according to which the nonzero indicates presence of localized eigenfunctions (in the sense of Anderson criterion) among those of Hamiltonian (1). To judge about the degree of locali- zation of the eigenvectors of (1) in the spectral range
D
D
U U, dU
, we have introduced, in [7], the par- ticipation function W U
, defined by the relationship
4[ , EU
]d = N
U dU
W U U (3)
Obviously, D=
W
U dU. It was shown in [7] that, when all the states, within the interval
U U, dU
, are delocalized, then W U
= 0. Otherwise, W U
is nonzero. One may easily check, that the function W U
has also the sense of average squared module of the frequency spectrum of oscillations of the wave function at the edge site1. In the presence of localization, these
oscillations do not decay, which corresponds to nonzero value of W U
.As was already mentioned, the physics of disordered systems is, at present, at the initial stage of its evolution, when testing theoretical results in a real experiment cannot look convincing. For this reason, as an especially important property of the discrete models described by the Hamiltonian of type (1), should be considered possibility of their simple numerical analysis. Fantastic capabilities of the contemporary computers allow one to diagonalize matrices of type (1) for a reasonable time and to observe, in such a numerical experiment, the quantities (2) and (3) at and more, checking, in this way, the appropriate theoretical predictions with a high degree of reliability. The main result of this paper is the following formulas for the participation function
and the quantity , which are applicable to the 1D random chain with the complex structural unit described above:
1000
N
D
W U
2 2 2
2
3 2
2
3 2
2 =
4
4
arctg ,
sin
= 2
U M
W U
m U
U
m O
U
M
D O
m
(4)
Here, the quantity is the parameter of the site energy distribution function, which we take in the form
=
,
P x p x p x > 0,
22
d = 1, d = 0, d =
p x x p x x x p x x x M
It follows from Equation (4) that, for the energies defined by the condition
2
2
4
arctg = , = 2 1,
< 2,
n
n n
n
E n n
E tg
E m m
E n integer
(5)
the participation function W E
n vanishes to within the terms , i.e., the states in these energy points appear to be, in the considered approximation, delocalized. This result looks strange because it is considered proven [5] that, in a 1D homogeneous random system, all the states are localized. In this connection, we performed analysis of the next term in expansion of the function3
W U in powers of . The analysis has shown that this term diverges at
(5). Due to this counter-directed behavior of contributions of different orders, Equation (4), at small disorder (i.e., at small ), should work well at any energy except for small regions in the vicinity of . In
these points (where the correction (4) vanishes), narrow peaks of the participation function
= n
U E
n
E
2
W U ,
corresponding to divergence of the next correction, should be observed. The numerical experiment described in the last section of the paper completely confirms this conclusion.
3. Green’s Function Statistics
It can be easily shown that the mean square of the wave
function module at the edge site N
t 2 (which is connected with quantity (2) we are interested in by therelation D= N
2 ) can be calculated in the following way:
2
1 2 1 2
0 1,2
1 1 2 2
1
= lim d d exp
4
N
V
t U U U t
U iV U iV
i U 2 (6) where
is the edge Green’s function (EGF) for Hamiltonian (1):
2
N
E
(7)To calculate the mean value of the product of fwo Green’s functions entering Equation (6) at different complex energies 1=U1iV1 and 2 2 2,
one has to know their joint distribution function (statis- =U iV
tics)
1 1 2 2
1 1 2 2
d 1d 1d 2d 2 is the probability that Re
i
i, idi
and Im
i
i, i d i
, i= 1, 2). We will usually write down the function as a function of two complex variables zi=iii, = 1, 2i :
1 1 2 2
=
z z1 2
. We derive equation for this function using the method of [7,11].Consider the chain described in Introduction, whose structural unit is a fragment consisting of two-level systems. Let be the number of the edge two-level system of the edge fragment and
m N
N
—the EGF of such a chain. If we add to this chain one more fragment consisted of m sites with the splitting , then the EGF
, corresponding to the edge site of this new chain can be expressed through :
1
=R
(8)
The explicit form of the function 1
R
= 1
m
entering this equation, for an arbitrary , will be given below, and now, we remind that, for the case ,
m
1
=1
|m = 1
allows us to express statistics of the edge Green’s functions of the chain with the added fragment (
x y x y1, 1, 2, 2 ) through the function
1 1 2 2
1
2
i
i
N
of the initial chain as follows
1 1 2 2
1 1 2
= d d d d
x y x y
x ReR
x ReR
2 1 1 2 2
1 1
1 1 1 1 1 1
1 1
2 2 2 2 2 2
d P
i y ImR
i y ImR
1
2
(9) It is clear that, in the thermodynamic limit ,
should coincide with . By calculating the integrals with -functions in (9), we obtain the following equation for the steady-state joint distribution function of EGF:
1 2
1 2
1 2
d d
d
d d
,
R R
P
R R
2 2
1 2
1 2
1, 2 =
(10) In this equation, symbol denotes transformation inverse to (8), and the joint statistics
R
is written as a function of two complex arguments.
The fact that the Green’s functions entering Equation (6) have vanishingly small imaginary parts of the energy arguments can be used to reduce the problem to analysis of the equation much simpler than (10) [7]. The average product of the two Green’s functions, entering Equation (6), can be written in the form of the sum of four terms:
1 1 2 2
1 1 2 2 1 1 2 2 1 2 1 2 1 2 2 1 1 2 1 2 1 2 1 2
= d d d d
U iV U iV
x y x y x y x y x x y y i x y x y
x x y y i x y i y x
(11) It was shown, in [7], that it suffices to calculate the term x y1 2 and to multiply the result by 4. Using Equation (10), we can write the quantity x y1 2 , we are interested in, in the form
1 2 1 1 2 2 1 2 1 1 2 2
2 2
1 2
1 2
1 2
1 1 1 1 2 2 2 2
1 1 2 2
1 2 1 1 2 2
= d d d d
d d
= d
d d
, , ,
d d d d d
x y x y x y x y x y x y
R R
P
u x y v x y u x y v x y
x y x y x y
(12)
where the real functions u
x y,
and v
x y, and the Jacobians entering Equations (10) and (12) are determined by the relations
,
,
u x y iv x y R xiy
(13)
2 2 2d
= =
d
=
i i
i i i
i i
i i i i
i i
i i i
u u
R x y u
v v x x
x y
x iy
i
i
v
(14)
( = 1, 2)i . In Equation (14), we used the Cauchy-Riman relations. In integral (12), we change the variables:
1 1 1 1 1 1 1 2 2 2 2 2 2
= , =
= , =
x u x y y v x y
1 2 2
,
x u x y y v x y
(15)
Since Jacobians of these transforms coincide with (14), for x y1 2 we have:
1 2 1 1 2 2 1 1 2 2
1 1 1 2 2 2
= d d d d d
x y x y x y P x y x
x x y y x y
y
(16)
with the form of x x y1
1 1
and y2
x y 2 2
being deter- mined by the function R1
(8):
1 1
1= 1 1 1 , 2= 2 2 2
x Re R x iy y Im R x iy
(17) As shown in [7], to calculate x y1 2 at vanishingly small imaginary parts of the energy arguments (i.e., at
), we may replace, in (16),
0 i
V by its limiting
value 0, which corresponds to pure real energies
i Ui
, whereas in (17), one has to take into account imaginary parts Vi of the energy arguments
(taking advantage, when possible, of their smallness). The reasoning similar to that presented in [7] shows that the function
( = 1, 2)i
0
can be represented in the form:
0 1 1 2 2 1 1 2 2 = 1,2 1,2
1 2 1 2
1 2
=
U
U U
x y x y x y x y
x x y y
(18)
where the function U U1 2
x x1, 2
controls statistics ofthe real Green’s functions and meets the equation that is much simpler than (10):
1 2 1 2
1 2 1 2 1 2
1 2
1 2
1 2
, = d ,
d d
d d
U U U U U U
U U
x x P R x R x
R x R x
x x
Thus, in Equations (16) and (17), we may set 1,2 ,
since Equation (18) for 0
= 0
y
contains the relevant
-functions. Since transformation (8) for real and gives real result, we may write, for
x1:
1 1= U1 1
x R x (20) An essentially different situation takes place for the quantity 2 from Equation (17), which, with allowance
for the above remarks, has the form
y
1 2= U iV y ImR x
1 2
R
2
2 2 . The imaginary part of this
expression, in the general case, tends to zero, because the transform is real at . The exceptions are peculiarities of the transform
2 0
V
1 2
R , i.e., the values of its argument x0 at which U2 0 .
2
At this stage of the calculation, we need the explicit form of the transformation
1
R x
1
R x [12]:
1 sin sin 1
=
sin 1 sin
m m x a b x
R x
c g x
m m x
(21)
where
2 4 = arctg The peculiarity z0= c g 0 i0 of the
function
1
R z corresponds to zero denominator in (21), and, in the limit Im , we are interested in, its imaginary part tends to zero. Bearing this in mind and using the same reasoning as in Footnote, one may make sure that Equation (17), for , can be rewritten in the form: 0 2 y
1 2 2 0 2 0 2 22 2 2 = lim = V V
U U U U U
U U
y Im R x
a g b c c
x g g U U
(22)
From Equations (20) and (21), we obtain the following expression for x1:
1 1 0= , =
U U
V
U U
a b x
x U
c g x
By replacing, in (16),
1 1 2 2
1 2
1 2 1 2 1 2U U x y x y U U x x y y
(Equation (18)) and by substituting in to it Equations (22) and (23) for y2 and x1, we obtain
21 2 1 2
2
2 2 2 2 1 1
2
1 1
2
= d d U U , U
U
U U U U U U
U U
U
c
x y xP x
g
a g b c a b x
c g g x
(24)To further simplify this expression, we introduce a new variable:
1 1 1
1
1 1
= U = U U
U U
a b
z R x
c g x x Then
1
1
d
= , d =
d
U U
R z
d
x R z x
z
z (25) Then, Equation (24) can be transformed into the form
1 1 2
2 2 2 2 2 2
1 2 1
2 2
d
= d d
d
,
U
U U U U U
U U U
U U
R z
x y z z P
z
c a g b c
R z g g
(26) It follows from Equation (19) that
2 1 2
1 2 1 2 2
1 2
, lim
=lim d ,
d d
d d
U U a
U U U U
a
U U
a z a
P R z R
R z R a
a z a
a (27)From (21), one can easily obtain
2= U U , d d = U U U U
U U
U U U U
a c z b c a g
R z R z z
g z b g z b
(28)
1
U
(23) and calculate the limits entering Equation (27)
2 2 2 22 2 2 2
2 2 = , lim d = lim d U U a U
U U U U
a
U
c
R a
g
R a b c a g
a a g 2 U
(29)
2This can be clarified by the following example. Let, e.g.,
1
= 1 [ ]
R , where, in the general case, =UiV and =x iy
. For real and , this transformation is real and has a singularity at
(V=y= 0)
0=
x U. If V0, then an imaginary part, located in this singularity (at small V), arises: Im
2
1 2
=
R x V xU By comparing (27) and (26), we eventually have
V
x U
. In our case, the
trans-formation 1
R is more complicated, but its imaginary part arises like in this simple example.
2 1 2 = lim U U1 2
a
, d
x y a x a
4. Calculating the <x
1y
2> Contribution
Let us change variables in Equation (6):
2 1, = 1
U U U U
. Then, with allowance for the remark given after Equation (11) and Equation (30), we may write the following expression for the quantity D:
2
1 2 2
0, 1,2
2 , ,
=
= lim e d d
= lim e , d d
N
i t
V t
i t U U
a t
D t
i
x y U
i
a x a x x
dU(31)
Note that, as was shown in [7], the participation function W U
can be obtained from (31) by omitting in it the integration over U
2
, ,
= lim ei t U U , d
a t
i
W U a x a x xd
(32)Following methodology of [7], we can represent the distribution function of the site energies P
in the form
11
= , 0, d
d 0
n n
P p p x p x x
p x x x M M
1,
0
(33)
In the case of an ordered chain, and, as a result, . The perturbative approach to solution of the equation similar to Equation (19), proposed in [7], represents expantion in powers of
0
= =
D W U
, with the first nonzero correction being of the order of
. It was also shown in [7] that, for calculation of the quantities and , it suffices to have only the singular in
2
D W U
part of solution of the equation for joint statistics of the Green’s functions (Equation (19)), with the singularity being of the pole type. Therefore, if we denote this singular part by the symbol “sing,” then we may present it in the form
2
31 2 = 1 2
U U
sing x x F x x O
(34)
Using Equation (30), we obtain the following formula for the sought function W U
:
2 2
3= lim U , d
a
W U a F x a x x O
(35)In the next section, we describe the perturbation theory for solving Equation (19) and derive explicit expression for the function FU
x x1 2
.5. Perturbative Approach to Equation (19)
Assuming that the parameter is small, we can present the sought function
1 2
1 2U U
1 2
1 2
1 2
=0
= , n
U U n
n
x x Q x x
(36) Let us expand the function
1
1 2
21 2
1 2 1 2
1 2
d d
,
d d
U U
U U U U
R x R x
R x R x
x x
under the integral sign, in the right-hand side of Equation (19), into power series in . Then, Equation (19) yields:
1 2 =0
1 2
1 2
, =0
1 2
1 2
1 2
=0
,
= ,
!
d d
d d
n n
n
n l n n
l U U
n n l
U U
Q x x
M
Q R x R x
n
R x R x
x x
(37) By equating the coefficients of the same powers of in the left- and right-hand sides of (37), we obtain the recurrent relation for the functions Qn:
0
0 1 2 0 1 1 2 2
1 2
1 2
1 2
: ,
d d
= 0
d d
U U
U U
Q x x Q R x R x
R x R x
x x
(38)
Since the first moment of the function P
is zero, we have Q x x1
1 2
= 0.
2
2 1 2 2 1 1 2 2
1 2
1 2
1 2
2 2
2 0 1 1 2 1 1 2 2
1 2 =0
: ,
d d
d d
= 2 ,
d d d d
U U
U U
U U
U U
Q x x Q R x R x
R x R x
x x
2
M Q R x R x
R x x R x x
(39)
Now, we define the linear operator Hm that acts upon an arbitrary function f x
as follows:
dR
dm U
U U
H f x f R x
x
(40)
Here, RU
x is the transformation inverse to (21). In [12], there has been solved the spectral problem for the operator H f x1
= f U
1 x
x2( ), and it was shown that, at
= 1 m < 2
U , its eigenvalues n and
eigenfunctions Un
x are given by the expressions:
2 2
= ,
4
= , = 1
4
n
n U n
U U U U
U n
n n
R x
x L x L x G x
R x
U i U
U i U
(41)
x x
where
4 2 2= , = , =
2
U
U U U
U
R x U i U U i U
G x R R
R x
4 2
and Lorentzian LU
x is defined as:
2 24 1 1 1 1
= =
2 1 2
U
U U
U
L x
i x R
x Ux x R
(42) Remind [12] that an arbitrary function f x
may be presented in the form of the series
=
= n , where =
n U n n
n U
f x d
f x A x A
G x
x (43)One can easily make sure that the functions Un
xm
are also the eigenfunctions for the operator H (40), and the eigenvalues are given by m-th power of eigenvalues (41): HmUn
x = nm Un
m
x . The func- tional operator H enters Equations (38) and (39). Taking into account its properties described above, we can immediately write the expression for Q0
x x1 2
:
0 1 2 = U1 1 U2 2
Q x x L x L x
(44)
To solve the functional Equation (39), let us write the sought function in the form of expansion over eigenfunctions of operator (40):
2 1 2
Q x x
2 1 2 1 1 2 2
| | | | 0
= n l
nl U U
n l
Q x x C x x
(45)By substituting this series into the left-hand side of Equation (39) and expanding its right-hand side using (43), we obtain, for the coefficients (45), the following formulas:
nl C
2 2
1 2
2 =0
1 2
1 =
2 1
nl m m n l
n l
M
C J U J
U U U
(46)
where Jn
U are given by
1
d
= d =
U U U
n n
U
U
n n
U U
L R x R x
J U
G x
L z
z J U
G R z
x
(47)
To expand the righ-hand side of (39), we used Equation (44) for the function Q0
x x1 2
.As was said above, we are interested only in the part of Q2
x x1 2
singular in =U2U1. To extract thispart, we have to retain in Equation (45) only the terms with [7], because only for these terms the
denominator
=
n l
11nm U lm U = 0
2 , in Equation (46),
vanishes at . The calculations identical to those performed in [7] lead to the following expression for the function FU
x x1 2
entering Equation (34):
2
2 2
2 =0
0
1 2
= 4
U n
n
n n
U U
F x U J U
x x
n
2 1 2
4 iM x
m
(48)
Here are the explicit expressions for integrals (47):
= 1, n
n GU R
0
1
1
= U U = , n
J U
J U R J U n
> 0 (49)
These expressions are obtained by integrating (47) over residues. When calculating the derivatives entering (48), the quantity can be considered so small that the arrangement of the poles of the integrants with respect to the real axis does not depend on .
Using properties of the function GU
x (41) pre- sented in [12], we can obtain the following relationship
1
1
1nm
z
1 1
= =
n
mn U
n n
U U
U U
R z
G z R z
G R
(50)
which shows that Jn
U, 0 = 0
at and that, in the general case, the expansion of0
n
1 1
R
U U
G R U in
powers of starts from the first power of
and may be written in the form:
2
31
= , =
U U U U
G 1 R 1 RU J U K T O
(51)
By substituting this expression into (49), we see that, in Equation (48), only the terms containing J1
U survive, for which the second derivative of their module squared is nonzero at = 0. Thus, Equation (48) for the function FU
x x1 2
may be transformed to the form:
2 2 2
1 2
1 1 1 1
1 2 1 2
= 4
2
( )
U U
U U U U
iM
F x x U K
m
x x x x
(52)
The direct algebraic calculation with the use of explicit expressions (41) and (21) for the function
U
G x and transformation , respectively, shows that
1
U R x
21
2
2 2
sin
= , = 4
4 4
m
m m
U
U U U U
R m
K R R K
U U
(53)
Finally, using the expressions for the moments and limiting values of the function Un
x , presented in [7]
2 2
4 2d = 4 , lim =
2 2
n n
U U
a
i n U
x x x U a a
n
with the aid of Equation (35), we obtain, for the participation function and the quantity , formula (4).
W U D
6. Delocalization Points
As was mentioned in Introduction, the appearance of the delocalization points (5) predicted in Equation (4) looks curious, taking into account the known assertion that all states in a 1D random system are localized [5]. The fact that the character of the states of Hamiltonian (1) (localized/delocalized), calculated in the second per- turbation order, appears to be, in these energy points, the same as in the totally ordered system, indicates that, for studying the states with energies (5), one has to analyze statistics of Green’s functions to within the terms of the order higher than . Complete analysis of this kind is rather cumbersome and lies outside the scope of this paper. Still, with the aid of reasoning presented below, it is exactly in the vicinity of the points n (5) where the
behavior of the participation function can be predicted.
2
E
W U
Assume that the odd moments of the site energy distribution function P
(33) are zeros ( ) and consider the fourth-order correction 4 in ex-pansion (36) of the joint statistics of Green’s functions. The functional equation for this correction is derived in the same way as Equation (39) for and has the form:
2n1= 0
M
Q
2
Q
4
4 1 2 4 1 1 2 2
1 2
1 2
1 2
2
1
2 1
2 1 2
2 1 2
1
4 2
2 4
0 1
4 1 2
2
=0
1 2
1 2
1 2
=0
: ,
d d
d d
d
= ,
2 d
d
,
d 4!
d d
d d
U U
U U
U
U U
U
U U
U U
Q x x Q R x R x
R x R x
x x
R x
M
Q R x R x
x
R x M
Q R x R x
x
R x R x
x x
2
(55)
The right-hand side of this equation is a sum of contributions, so that, if dependence of any of them on energy arguments U1,2 has a peculiarity, then such a
peculiarity will be displayed by the function Q4
x x1 2
. We will now show that some terms of series (45), for function Q2
x x1 2
U
, diverge at the values of their energy arguments 1,2 equal to n (5).
Using Equations (46), (49), and (51), one can make sure that, among the coefficients (46), nonzero are
E
nl C
only C11=C1, 1,C1, 1=C1,1
0, 2
,C
, C1,0=C1,0,C0,1=C0, 1,
2,0
C . Let us present expression, e.g., for . Equation (46) yields:
1,0
C
2 1 1,0
1 1
= 1
U
m M T C
U
(56)
where
1 is determined by Equation (51). It can be easily shown that (41) and
U
T
1 = 1
m n E
0
En
T (51). It is this fact that gives rise to the above divergence of
x2
4 1
Q x at , which, in turn, leads to divergence of the correction to the participation function
1= n
U E
4
W U . The terms of expansion (45) proportional to and also diverge at (5), with no compensation for the divergence.
2 1
Q x
0,
C
2
x
1
1,0, 0,1
C C
1,2=
U En
Spectral behavior of other terms of the expansion at
1,2 (5) is essentially different. For instance, the
coefficient defined by the relationship
= n
U E
1,1
C
1 21,1 2
1 1 1 2
= 1
U U
m m
K K
C M
U U
(57)
tends to zero at 1,2 (5) because the product
1 2
= n
U E
U U
K K tends to zero faster than 1 1
1 1 2m U m U
.
Appearance of divergence is also possible in the points other than Equation (5), where the corresponding peculiarities of the function
n E
W U are, however, not so noticeable, because the function calculated in the second order in
W U
is nonzero.
The divergence described above should look as a strong deviation of the participation function W U
, at= n
U E
n
E
(5), from that described by Equation (4). The size of the spectral regions, in the vicinity of the points (5), where the correction begins to exceed the correction
4 2
(4), calculated in this paper, will decrease with decreasing . Since the correction 2 of the function W U
turns to zero at (5), the diverging corrections of higher orders should give rise to narrow (at small= n
U E
) peaks in these spectral points. Quantitative description of the amplitude and shape of these peaks lies outside the scope of this paper.
7. Numerical Experiment
All the results obtained above refer to the case of an
The qualitative picture of the excitation dynamics studied in this paper is that this excitation, being initially located at the edge site N, remains localized near this site at . In this case, the appropriate wave function proves to be essentially nonzero only at some finite number of sites in the vicinity of the edge site. The
t
L
quantity D= N
t
2 calculated in this paperand the normalization condition of the wave function provide opportunity to evaluate the number L as 1 D
and to introduce the following natural definition for the
mean localization radius L :
2 2
1 2
= m
L
D M
(58)
It is evident that, in the numerical experiments, the matrix dimension N should substantially exceed L .
The participation function calculated in this paper, allows one to judge about spectral dependence of the localization radius. For, instance, if the function
, for some energy U , is by a factor of k
smaller than its mean value (equal to
W U
W U
0
D V , where
0 is the width of the matrix (1) spectrum), then, we
may say that the localization radius of the states with the energy U is by a factor of larger than
4
V
l U k
L . It means that the function , obtained numerically, may strongly deviate from Equation (4) near the points of delocalization (5), because the localization radius of the states with the energies close to n (5) substantially exceeds the mean one and
may become greater than the matrix dimension used in the numerical experiment.
W U
=En
U
E
N
The above reasoning shows the reasons why the smallest matrix dimension that can be used for the testing
decreases with increasing degree of disorder . On the other hand, evidently, it is possible to neglect the terms of the order higher than second, in Equation (4), only when , which is the case only at small
1
D . For
this reason, the degree of disorder and the matrix dimension , in the numerical testing, should, at least, meet the following condition:
N
2 2
1
1 2 M
N m
(59)
Our numerous computer experiments with matrices (1) of different dimension and with the different degree of diagonal disorder support the above qualitative conclusions. To obtain statistics of site energies (33), in the numerical testing, we used the function
N
=
0.5
0.5 ,
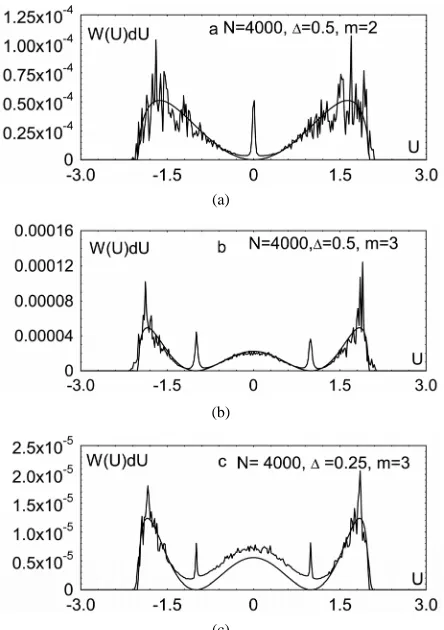
2 = 1 [image:9.595.313.535.76.391.2]p x x x M 12
Figure 1 shows spectral dependences of the function obtained numerically using Equation (3)
W U dU
(a)
(b)
(c)
Figure 1. Distribution of the degree of localization of the states in 1D disordered chains with a complex structural unit. Noisy plots are obtained by computer simulation, and smooth curves, using Equation (4). Dimension of the random matrices, in all cases, is 4000. The values of other parameters are: (a) = 0.5,m= 2, (b) = 0.5,m= 3, (c)
m
= 0.25, = 3. In all cases, dU =1 50.
(noisy plots) and the results of calculations using Equation (4) (smooth curves). The calculations were performed at = 0.5 , dU = 1 50 , (Figure 1(a)) and (Figure 1(b)). The matrix dimension was , and averaging over 100 realization was made. One can see from Figures 1(a) and (b) that the numerical and theoretical dependences well agree with each other, with the points of delocalization (5) distinctly seen in both figures. The narrow peaks of the numerical plot in these points correspond to qualitative predictions made in the previous section.
= 2 m = 3
m 4000 = N
Figure 1(c) shows the results of similar calculations for the disordered chain with m= 3. In this case,
= 1152
L , and at , condition (59) is satis- fied relatively weak. One can see from Figure 1(c) that, in the spectral regions near the points of delocalization, where the localization radius of the states exceeds
= 4000 N
L
(58) and becomes comparable with , the discrepancy between the results of numerical experiments and theo-
retical curve is more noticeable than far away from these points. The calculations were performed with no fitting.
8. Conclusions
In this paper, we have analyzed spectral dependence of the degree of localization of the states in a 1D disordered chain with a complex structural unit in the form of a segment consisted of two-level atoms. It is shown that distribution of the degree of localization, for such a model, qualitatively differs from that for the chain with a simple structural unit and is essentially inhomogeneous. This distribution is characterized by appearance of spectral regions in which the states are, to a considerable extent, delocalized, with exception of central points of these regions, where the degree of localization exhibits sharp peaks. The calculations are performed using the developed perturbative approach for the joint statistics of the advanced and retarded Green’s functions.
m
The work was supported by the Analytical Depart- mental Targeted Program “Development of Scientific Potential of Higher School” of 2009-2010 (project no. 2.1.1/1792).
9. References
[1] V. L. Berezinsky, “Kinetics of a Quantum Particle in a One-Dimensional Random Potential,” Journal of Ex-perimental and Theoretical Physics, Vol. 65, 1973, pp. 1251-1266.
[2] A. A. Gogolin, V. I. Mel’nikov, E. I. Rashba, “Conduc-tivity in a Disordered One-Dimensional System Induced by Electron-Phonon Interaction,” Journal of Experimen-tal and Theoretical Physics, Vol. 69, 1975, pp. 327-349. [3] A. A. Gogolin, V. I. Mel’nikov, E. I. Rashba, “Effect of
Dispersionless Phonons on the Kinetics of Electrons in a
One-Dimensional Conductors,” Journal of Experimental and Theoretical Physics, Vol. 72, 1977, pp. 629-645. [4] Y. A. Bychkov, “Absence of Sound in One-Dimensional
Disordered Crystals,” Journal of Experimental and Theo-retical Physics, Vol. 67, 1974, pp. 2323-2325.
[5] I. M. Lifshits, S. A. Gredeskul and L. A. Pastur, “Intro-duction to the Theory of Disordered Systems,” English Translation, Wiley, New York, 1988.
[6] P. W. Anderson, “Absence of Diffusion in Certain Ran-dom Lattices,” Physical Review, Vol. 109, No. 5, 1958, pp. 1492-1505. doi:10.1103/PhysRev.109.1492
[7] G. G. Kozlov, “Computation of Localisation Degree in the Sence of the Anderson Criterion for a One-Dimen- sional Diagonally Disordered System,” Theoretical and Mathematical Physics, Vol. 162, No. 2, 2010, pp. 238- 253. doi:10.1007/s11232-010-0019-1
[8] D. H. Danlap, H.-L. Wu and P. W. Phillips, “Absence of Localization in a Random-Dimer Model,” Physical Re-view Letters, Vol. 65, No. 1, 1990, pp. 88-91.
doi:10.1103/PhysRevLett.65.88
[9] V. A. Malyshev, A. Rodriguez and F. Dominguez-Adame, “Linear Optical Properties of One-Dimensional Frenkel Exciton Systems with Intersite Energy Correlations,”
Physical Review B, Vol. 60, No. 20, 1999, pp. 14140- 14146. doi:10.1103/PhysRevB.60.14140
[10] F. A. B. F. de Moura and Marcelo L. Lyra, “Delocaliza-tion in the 1D Anderson Model with Long- Range Corre-lated Disorder,” Physical Review Letters, Vol. 81, No. 17, 1998, pp. 3735-3738. doi:10.1103/PhysRevLett.81.3735 [11] F. J. Dyson, “The Dynamics of a Disordered Linear
Chain,” Physical Review, Vol. 92, No. 6, 1953, pp. 1331- 1338. doi:10.1103/PhysRev.92.1331
[12] G. G. Kozlov, “Spectrum and Eigen Functions of the Operator
21 U