759 | P a g e
STUDY ON RESPONSE REDUCTION FACTOR OF
CONCENTRICALLY BRACED STEEL FRAMES
Chaitanya CVK
1, Pavan Kumar Ch
2, V.Venkatesh
31,2,3Assistant Professor,Department of Civil Engineering, Sphoorthy Engineering College,
Hyderabad, Telangana (India)
ABSTRACT
The present study deals with the effect of different aspect ratios on the value of response reduction factor evaluated for different braced and without braced Steel frame models. Aspect ratio is the ratio of total height of the building frame to base width of the building frame whereas, total height of the building frame is varied and base width is kept constant. So, three bay frames are considered for all structural models and the response reduction factor values are evaluated for two dimensional steel frame models containing without bracing, middle bay bracing and external bay bracing of different brace configurations following different aspect ratios ranging from one to five. For this analytical study, SAP2000 software is used and static nonlinear push over analysis has been performed to evaluate response reduction factor (R) values by evaluating the components of R-factor including over strength factor and ductility reduction factor which can be obtained by extracting values from static push over curve and finally R values are presented and compared for different structural models of different aspect ratios.
Key words: Aspect ratio, concentric bracings, ductility factor, over strength factor, response
reduction factor.
I. INTRODUCTION
Response reduction factor (R) is a value that indicates the reduced response of a structure from linear elastic
response spectra to the inelastic one. Response reduction factor (R) primarily depends upon two factors which
are ductility reduction factor (Rμ) and over strength factor (Rs). During strong earthquakes, structures are
expected to undergo large nonlinear deformations as they do not remain elastic. By considering the fact that the
structures contain significant reserve strength (Over strength) and Energy dissipating capacity (Ductility), which
are included in structural design through a response reduction factor, many design codes allow reduction in
design loads . It is known that, different seismic codal provisions have assigned different values of ‘R’ for a particular type of structural system. For example, from IS 1893:2002 (Part-1), R-factor for Steel concentric
braced frame is 4, whereas from ASCE-7, it is 3.5 and from Iranian code (Standard 2800), it is 6 for the same
steel concentric braced frame. Likewise, based on pure technical Engineering judgment, R values are assigned
and these assigned values to the R-factor will be affected by any change or improvement in the reliability of the
modern earthquake resistant buildings. Therefore, systematic evaluation of response reduction factor is needed
760 | P a g e
From the previous studies, Whittaker. A et.al presented a draft formulation which represents the responsereduction factor as a product of over strength, ductility and redundancy [1]. They have conducted various
analytical and experimental studies on over strength and ductility and have presented pertinent data on them.
Also, they have discussed about the studies that proposed the formulation of R which is expressed as the product
of three factors.
Where, Rs is a period-dependent strength factor
Rμ is a period-dependent ductility factor and
RR is a redundancy factor
After that, Mahmoudi. M and Zaree. M evaluated response reduction factors for CBFs and BRBFs by
conducting static non linear push over analysis for different building frame models (Chevron V, invert V and
X-bracing) of single and double bracing bays with various storey heights and concluded that the number of bracing
bays and height of the buildings had greater effect on response reduction factors [2]. They have evaluated and
studied R-factors of the above mentioned frames by using the expression of R which is determined as,
Where, Rμ is a reduction factor due to ductility and
Rsis the over strength factor
Among several proposals made for the expression of Rμ, from the simple version ofthe N2 method proposed by
Fajfar [8], Rμ can be written as,
()
Where, T is fundamental period
Tc is characteristic of ground motion and
μ is the structural ductility factor which can be written as,
Where, ∆max is the maximum displacement in a structure for the first life safety performance ∆y is the observed yield displacement there
Now, the over strength factor is given as,
Where, Rsd is the design over strength factor and is defined as,
Where, Vu is ultimate base shear in relevance to the first life safety performance
Vd is the design base shear in the building
R1is the difference between actual and nominal yield strengths and its value may be put as 1.05 based on the
statistical data for the structural steel and
R2 is a parameter used to know the yield stress under stain rate effect during an earthquake phenomena and its
value could be used as 1.1 (an increase of 10%), to account for the strain rate effect.
Before this, in 2003, Mahmoud R.M. and Akbari R. evaluated the seismic behavior factor i.e. response reduction
factor (R) for X-braced and knee braced RC buildings and concluded that there are some parameters including
the height of the building frame, share of the bracing system and type of the bracings had significant effect on
the seismic behavior factor [3]. Recently, Kamath. K et.al, have studied on the effect of different aspect ratios
i.e. H/B ratio on steel CBFs and the seismic performance of those CBFs were compared [4]. The present study
focuses on the evaluation of response reduction factors by evaluating the ductility and over strength factors
using static non linear push over analysis on different steel CBFs (Without bracing, X-bracing, V-bracing,
761 | P a g e
i.e. H/B ratio rangingfrom 1 to 5 fora high seismic prone zone (Zone-V) and finally based on the comparativestudies, the best suitable steel CBF is suggested.
II. MODELING AND ANALYSIS
1.1.Modeling of steel frames:
The modeling of steel frames has been carried out based on the aspect ratio i.e. H/B ratio, where, H is the total
height of the structural frame and B is the total base width of the structure. Here, aspect ratio will be varied by
keeping the base width as constant and varying the height of the structure by increasing the number of storeys.
The dimensions of the structural members are assigned only after proper design of the entire structure which is
allowed to resist different types of load cases along with load combinations considered according to the Indian
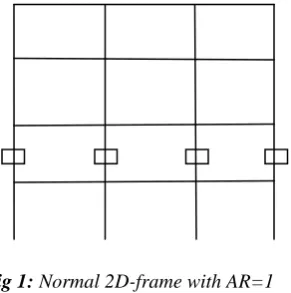
standards. A normal two dimensional modeled frame without bracings will be looks like as follows:
Fig 1: Normal 2D-frame with AR=1
Aspect ratio as mentioned above refers to the ratio of total height of the structure to the base width of the
structure i.e. H/B ratio. For example, take the above modeled frame and it has G+3 with 3 bays in which each
storey height is 3m and each bay width is 4m. Therefore, total height (H) of the structure is 12m and base width
(B) of the structure is also 12m which gives the aspect ratio (H/B) is equal to 1. Like this, aspect ratios of 1, 2, 3,
4, and 5 have been considered for the steel frames of without bracings and with different types of bracings. The
figures representing differenttypes of bracings considered with aspect ratio of 1 are shown as follows.
Fig 2:Steel frames models with different types of bracings
A Tabular column drawn below shows the dimensional properties of the steel structural members of X-braced
762 | P a g e
Table 1: Dimensional propertiesSteel frames with X-bracings (Middle bay
braced)
Aspect
ratio
Beam Column Brace
1 ISMB350 ISHB450-2 ISMB200
2 ISMB350 ISHB450-2 ISMB200
3 ISMB350 ISHB450-2 ISMB200
4 ISMB350 ISHB450-3 ISMB200
5 ISMB350 ISHB450-3 ISMB200
2.2 Analysis:
Static nonlinear analysis (Pushover analysis), has been produced over the previous years and has turned into a
helpful analysis methodology for outline and execution assessment purposes. The function of the pushover
analysis is to assess the normal execution of a structural system by evaluating its strength and deformation
demands in earthquake design by means of a static inelastic analysis, and contrasting these demands with
accessible limits. With the recent publication of the FEMA-273, FEMA-356 and FEMA-440 archives which
incorporate broad suggestions for the load-deformation modeling of individual components and for worthy
estimations of force and deformation parameters for execution assessment, the non-linear structural analysis
technique has been made one stride further. This static nonlinear push over analysis methodology should be
possible by utilizing structural analysis programming device called CSI SAP2000. In the pushover analysis,
selecting a proper lateral load distribution is a vital step. The analysis was directed by utilizing life safety
structural performance level and additionally the nonlinear behavior of braces as proposed by FEMA-356
appeared in the fig beneath.
Fig 3: Generalized force-deformation relation for steel braced elements
In the above Fig. Q, Qy and ∆ are the generalized component load, expected strength and component
displacement, respectively.
The hinges defined and assigned for a nonlinear analysis have been taken from the tables of FEMA 356 which
are of auto hinge property. The steel beams will be assigned with the Primary component type with the degrees
of freedom M3 whereas the steel columns will be assigned with the primary component type with the degrees of
freedom P-M3 and also the steel braces will be assigned with the same Primary component type with the
763 | P a g e
II. RESULTS
1.2.Evaluation of response reduction factor:
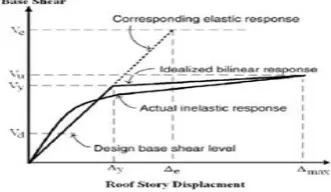
Fig 4: General Structure Response [7]
The calculation of Rμ, Rs&R can be done by using the formulas stated in the study done by the authors named
Mahmoudi. M and Zaree. M mentioned above in the introduction. The values thus obtained were entered in the
tabular column shown below.
1.3.Effect of aspect ratio:
Table 2: Seismic parameters values Seismic
Parameter
Aspect ratio
WB XMB XEB VMB VEB ΛMB ΛEB DBMB DBEB
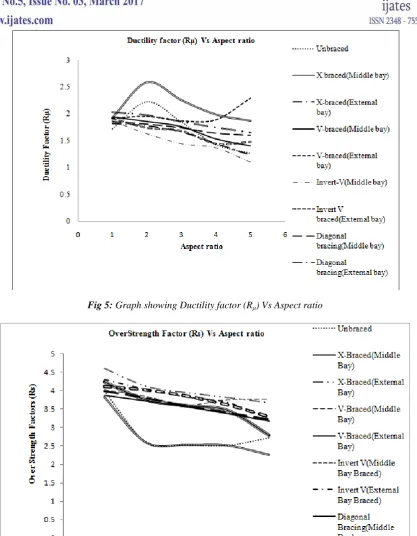
Rμ Rs R 1 2 3 4 5 1 2 3 4 5 1 2 3 4 5 1.721 2.222 1.847 1.729 1.271 3.977 2.617 2.536 2.522 2.723 6.848 5.817 4.685 3.606 3.462 1.921 2.585 2.256 1.987 1.871 3.836 2.605 2.535 2.517 2.257 7.372 6.738 6.227 5.002 4.224 1.815 1.775 1.659 1.445 1.230 4.602 4.116 3.941 3.804 3.667 8.355 7.309 6.542 5.500 4.513 1.942 1.853 1.760 1.531 1.402 4.032 3.851 3.605 3.753 3.766 7.832 7.139 6.345 5.746 5.283 1.909 1.952 1.866 1.885 2.291 4.246 3.763 3.597 3.466 2.797 8.108 7.349 6.714 6.538 6.411 1.875 1.634 1.449 1.372 1.105 4.120 4.029 3.859 3.613 3.287 7.727 6.587 5.594 4.960 3.634 1.921 1.743 1.685 1.445 1.481 4.303 4.041 3.829 3.678 3.230 8.267 7.045 6.455 5.318 4.784 1.856 1.811 1.742 1.642 1.602 3.868 3.720 3.559 3.379 3.181 7.182 6.740 6.200 5.549 5.097 2.032 1.977 1.853 1.746 1.652 3.979 3.795 3.580 3.400 3.220 8.087 7.505 6.636 5.941 5.321
764 | P a g e
Fig 5: Graph showing Ductility factor (Rμ) Vs Aspect ratio765 | P a g e
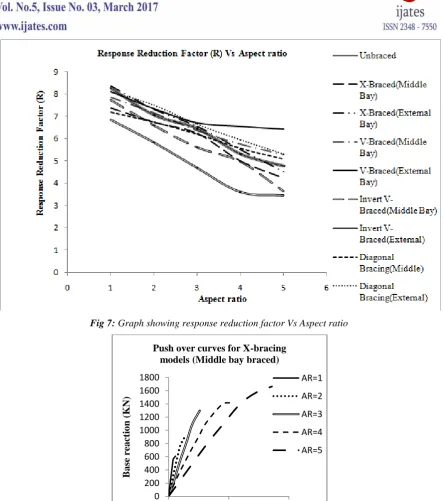
Fig 7: Graph showing response reduction factor Vs Aspect ratioFig 8: Graph showing Push over curves for X-braced steel frames (Middle bay braced) with aspect ratios ranging from 1 to 5
III. CONCLUSIONS
This paper has assessed the variables, for example, over strength, ductility reduction, and the response
modification factors of around 40 conventional CBFs considering life safety structural performance levels. As
such, a static nonlinear (pushover) analysis was performed on the model structures with single (Middle bay) and
double (external bay) bracing bays, with different aspect ratios running from 1 to 5 and different concentric
0 200 400 600 800 1000 1200 1400 1600 1800
0 0.1 0.2
B
a
se
re
a
ct
io
n (
K
N)
Displacement (m) Push over curves for X-bracing
models (Middle bay braced)
AR=1
AR=2
AR=3
AR=4
766 | P a g e
brace configurations. The beam column connections were thought to be pinned so that the seismic force wasresisted principally by braces.
The results obtained from this study can be summarized as follows:
i. With increase in the height of the structure, the ductility reduction factor and over strength factor value
decreases for most of the structural models.
ii. As the response reduction factor (R) is directly proportional to the ductility reduction and over strength
factors, R-factor also decreases with an increase in the height of the structure which can be concluded from
the obtained results and graphs drawn.
iii. Hence, response reduction factor (R) is heavily dependent on height of the structure (aspect ratio) and on
type of the bracings installed in the steel frame which states that the R-value cannot be taken as a standard
value for all steel concentrically braced frames.
iv. Steel framed structures with Concentric X-bracings are possessing higher ductility reduction, higher over
strength and higher response reduction capacities against the seismic forces when compared to Unbraced,
V, Invert-V & diagonal concentrically braced steel frame models.
v. Hence, Steel framed structures with concentric X-bracings are suggestible at higher earthquake prone areas
when compared to other V, invert-V & diagonal braced frames.
REFERENCES
[1] A. Whittaker, G. Hart, “Seismic response modification factors”, Journal of Structural Engineering, ASCE, Vol.
125, No. 4, April, 1999, pp. 438-444.
[2] M. Mahmoudi, M. Zaree, “Evaluating response modification factors of concentrically braced frames”, Journal of
constructional steel research, 66, 2010, pp. 1196-1204.
[3] M. R. Maheri, R. Akbari, “Seismic behavior factor, R, for steel X-braced and Knee braced RC buildings”,
Engineering Structures, 2003, pp. 1505-1513.
[4] K. Kamath, Shruthi, S. K. Rao, “Comparative study on concentric steel braced frame structure due to effect of
aspect ratio using push over analysis”, International Journal of Scientific Research Engineering & Technology,
Vol. 4, 2015, pp. 247-252.
[5] M. Mahmoudi, M. G. Abdi, “Evaluating response modification factors of TADAS frames”, Journal of
Constructional Steel Research, 2012, pp. 162-170.
[6] M. Izadinia, M. A. Rahgozar, O. Mohammadrezaei, “ Response modification factor for steel moment-resisting
frames by different pushover analysis methods”, Journal of Constructional Steel Research, 2012, pp. 83-90.
[7] J. Kim, H. Choi, “Response modification factors of Chevron-braced frames”, Journal of Engineering Structures,
2005, 27(2), pp. 285-300.
[8] P. Fajfar, “Structural analysis in earthquake engineering-a breakthrough of simplified non-linear methods”, 12th
European conference on earthquake engineering, 2002.
[9] B. Asgarian, H. R. Shokrgozar, “BRBF response modification factor”, Journal of Constructional Steel Research,
2009, 65(2), pp. 290-298.
[10]M. I. Khan, K. N. Khan, “Seismic analysis of steel frame with bracings using pushover analysis”, International
![Fig 4: General Structure Response [7]](https://thumb-us.123doks.com/thumbv2/123dok_us/9260869.1464469/5.595.67.524.370.633/fig-general-structure-response.webp)