169
Journal of Membrane Science & Research
H I G H L I G H T S
A R T I C L E I N F O
G R A P H I C A L A B S T R A C T
A B S T R A C T
Application of Salt Additives and Response Surface Methodology for Optimization of PVDF
Hollow Fiber Membrane in DCMD and AGMD Processes
Tohid Vazirnejad
1, Javad Karimi-Sabet
2,*, Abolfazl Dastbaz
1, Mohammad Ali Moosavian
1, Sohrab Ali Ghorbanian
1* Corresponding author at: Phone: +982177797714; fax: +982177121843 Received 2015-07-15
Revised 2016-02-05 Accepted 2016-02-08 Available online 2016-02-08
In this study, the influence of the salts as an additive on the performance of the membrane was investigated and an extensive work was performed to optimize PVDF hollow fiber membranes through a response surface methodology (RSM). The prepared membranes were characterized by SEM, contact angle and LEP measurement. Then, the RSM was used for the optimization of surface pore size, porosity and hydrophobicity of the synthesized hollow fiber at different conditions (polymer concentration, salt concentrations, and air gap). Under MD conditions (feed concentration, 100 mg/l; feed temperature 80 °C, and cooling temperature 15 °C), the optimum membrane was compared with the virgin one in the same condition. In addition, the influence of distillate flux at different feed concentrations and temperatures was evaluated. The results show that the optimum hollow fiber membrane was fabricated in the polymer concentration of 22 %w/w, BaCl2 concentration of 2.9 %w/w and an air gap of 34.5 cm. Consequently, the optimum fiber was examined for the desalination of water with 35, 50 and 70 g/l salt concentration by DC and AG membrane distillation. Our findings show that the distillate flux with the salt rejection of 99.9% was increased to 46% and 31% for DCMD and AGMD, respectively.
Desalination
Membrane distillation (MD) Hollow fiber
Salt additive Box-Behnken design
journal homepage: www.msrjournal.com
1 Department of Chemical Engineering, University of Tehran, Tehran, Iran 2 NFCRS, Nuclear Science and Technology Research Institute, Tehran, Iran
K E Y W O R D S
Research Paper
© 2016 MPRL. All rights reserved.
E-mail address: [email protected]; [email protected] (J. Karimi-Sabet) • Polymer membranes modified with salt additives were prepared and characterized. • BaCl2 exhibit the best performance among other salts.
• Optimal mixing mass percentage of salt/PVDF was 2.9%. • DCMD and AGMD flux was compared.
• Salt rejection was 99.9% for both DCMD and AGMD.
side. The distillate flux is driven by a vapor pressure difference across the membrane resulting from the temperature and solution composition gradients between two sides of the membrane. Due to surface tension forces, the hydrophobic nature of the membrane prevents the penetration of the aqueous solution into the pores unless a hydrostatic pressure exceeds the liquid entry pressure of water (LEPw) [3-5]. Therefore, an efficient MD membrane should contain various characteristics such as hydrophobic surface, high bulk and surface porosity, appropriate pore size, enough LEP, low thermal conductivity, good thermal stability and excellent chemical resistance [6-8]. Generally, membranes are prepared in two shapes: flat sheet or hollow fiber. In comparison to the flat sheet membranes, the hollow fiber membrane module presents sophisticated characteristics such as high packing efficiency (high productivity), self-supporting, good flexibility, low fouling and facile
1. Introduction
T. Vazirnejad et al. / Journal of Membrane Science and Research 2 (2016) 169-178
assembling, scale-up and maintenance in MD applications [7,9]. Most studies focused on the preparation of hollow fiber membranes by the dry/wet spinning or the wet spinning techniques [10-16]. Although the production of fibers is more complex, it involves more controlling parameters including the nature and concentration of the polymer, additives in polymer solution, temperature of internal and external coagulants, spinneret dimensions, injection rate of the polymer solution, internal coagulant, air gap length and take-up speed [17-22]. The proper design of statistical experiments shows that we can study more parameters at the same time and gain maximum information from the limited experimental data contrary to the conventional spinning approach based on trial and error [23-27].
In this study, various porous PVDF hollow fiber membranes with different structures and permeation properties are prepared. First, the best salt additive between several chloride salts (NaCl, KCl, CaCl2, and BaCl2) is determined to optimize surface pore size, contact angle, and porosity. Then, Response Surface Methodology based on Box-Behnken design was applied to investigate the effects of spinning conditions such as polymer concentration, salt concentration and air gap length on the membrane morphology and performance. Optimum fiber introduced by the Box-Behnken design experiment was examined for the desalination at different feed concentrations and temperatures in DCMD and AGMD methods. Finally, the performance of synthesized fiber under optimum conditions was compared with the fiber produced in the same condition without any salt additives.
2. Materials and methods
2.1. Materials
In this study, all materials containing Polyvinylidene fluoride powder (grade: Kynar 761), NaCl (MW=58.44, >99%, mesh +80), KCl (MW=74.55, >99.99%, mesh -10), CaCl2 (MW=110.98, >93%, particle size >7mm) and BaCl2 (MW=208.23, >99%, mesh -10) powders were purchased from Sigma-Aldrich Chemical Co. (USA). N-dimethylacetamide (DMAC, >99%, Merck, Germany) and tap water were used as a solvent and the internal/external coagulants, respectively.
2.2. Synthesis PVDF hollow fiber membrane
PVDF hollow fibers were prepared by the dry/wet spinning process by using the spinning system as shown schematically and experimentally in
Figure 1-a and b, respectively. Initially, a solution of Salt/DMAC was prepared by a predetermined amount of salt. As all salt powders crushed in a mortar are passed across the mesh500, and the maximum size of particles decreased to 20 µm. Then, the salt particles were added to DMAC and decreased their size by low power sonication (ultrasonic homogenizer, 40 kHz, maximum output 180 W) for 1 hr. After sonication, the size distribution of the additives in the solvent was measured by a Dynamic Light Scattering (DLS) test. In the next step, PVDF pellets were dissolved in the Salt/DMAC mixture at a temperature of 60 °C and simultaneously stirred for about 24 hr to ensure the complete dissolution of the polymer. Before the spinning process, the prepared solution was degassed at 60 °C (under vacuum pressure) to remove the trapped gas bubbles.
(1)
(2)
(3)
(4)
(5)
(6) (3)
(2) (2)
(7)
(8)
P P
(1)
Fig. 1. Hollow fiber spinning process; (a: left side) schematically (1: Nitrogen tank; 2: regulating pressure valve; 3: pressure gauge; 4: bore liquid tank; 5: dope liquid tank; 6: spinneret; 7: fiber through air gap; 8: external coagulant tank); and (b: right side) experimental setup.
The polymer solution was loaded into a reservoir, and pressurized nitrogen was used to extrude the solution through the spinneret as shown in
Figure 1. The inner and outer diameters of the spinneret are 0.68 and 1.1 mm, respectively. As pressurized nitrogen was injected in the central tube of the spinneret, the internal coagulant was ejected and formed the internal surface of the membrane. After passing the certain air gap, the extruded polymer enters into a coagulation bath. The flow rate of polymer and bore fluid was measured by a graduated cylinder with ±0.2 ml accuracy. The spun product was stored in a water bath for at least a week to remove the residual solvent and salt particles from the pores. Finally, the fibers were dried in the air at room temperature (25 °C) before analysis is performed.
For salt selection, hollow fibers were spun according to Table 1
conditions. Then, the concentrations of polymer, salt and air gap length were optimized with the Box-Behnken experimental design.
Table 1
Spinning conditions of fabricating PVDF hollow fiber membrane.
Parameter Operating condition
Inner and outer diameter of the spinneret di = 0.7 mm/ de = 1.5 mm
Dope composition (PVDF / salt / DMAC) 16 / 2 / 82, w/w/w
Bore fluid tap water, 0.32 m/s, 37.5 °C
Dope flow rate 0.12 m/s
External coagulant tap water, 37.5 °C
Air gap length 34.5 cm
Take-up speed 6-8 m/min (free falling)
Relative humidity 40%
2.3. DLS measurements
DLS tests were performed to measure the particles size and size distribution of salt additive by using a Zetasizer Nano ZS system equipped with a red laser (532 nm) (Malvern Instruments Ltd., England). For each sample, a separate DLS measurement was performed with a fix run time of 60 second at a temperature of 25 °C. A Noninvasive Back Scatter (NIBS) technology was used for the size measurement and all sizes of our examinations were based on the intensity average.
2.4. Hollow fiber membrane characterization
Viscometer (BROOK FIELD Co., Model DV2T, USA) is used to measure the viscosity of the polymer solutions. In addition, Scanning Electron Microscopy (SEM) (VEGA3, Model LM, TESCAN Co., China) was applied to observe the outer surface and cross-section morphologies of hollow fiber. After the fiber was immersed in liquid nitrogen, the frozen fiber was quickly fractured. The membrane sample was then positioned on a metal holder and coated with sputtering gold operated under a vacuum condition. Finally, the SEM pictures were taken at various magnifications, and the inner and outer diameters of the fibers and the pore size of the surface (pore radius) were measured by means of Image Tool picture analysis software (version 3, USA) for SEM picture analysis. The pore size (rpore) was calculated as follows:
π
.
n
s
r
pore=
(1)where S and n represent the total pore area and total number of pores on the SEM picture of the fiber outer surface, respectively. The porosity of the membrane was measured by determining its swelling in the kerosene, according to Eq. (2) [28]:
ρ
.
.
1 2
L
s
w
w
Porosity
=
−
(2)where W1 and W2 are the weights of the dry and wet membranes, respectively; S is the fiber cross section area; L is the length of the sample and ρ is the density of isobutanol at room temperature.
The contact angle was measured with a contact angle goniometer (JYSP360, united test Co., China). Deionized water was dropped into the sample (in hollow shape) through a needle on a micro-syringe during the test. A picture was captured after the drop was set in the middle of the sample. The contact angle could be calculated by the software to analyze the shape of the drop. The contact angle was the average of 5 measured values in different locations of the samples.
2.5. Experimental design
RSM is a collection of mathematical and statistical techniques that are used for modeling and analyzing the applications where a response of interest is influenced by several variables. In fact, the main aim of this technique is to optimize these responses. Previous studies show that the hollow fiber spinning processes were affected by numerous parameters such as air gap and coagulant. These factors increase the occurrence of over fitting when a model is excessively complex. Therefore, it is necessary to select the parameters that had major effects on the responses [29]. Since the selectivity and permeability are the crucial features in the performance of membranes, variables must be determined to improve these features. Surface hydrophobicity and pore size are the two important parameters that influence the selectivity via controlling the amount of LEPw. As mentioned before, high LEPw only allows vapor molecules to pass through the pores and then to condense on the cold side. The relation between the membrane parameters and the MD flux can be written as follows [30]:
τ
δ
ε
α mr
N
≈
(3)where N is the molar flux, r is the membrane pore size, α is a constant factor that is 1 for the Knudsen diffusion and 2 for viscous flow, ε is the membrane porosity, δm is the membrane thickness, and τ is the membrane tortuosity.
According to Eq. (3), a membrane with high porosity is favorable for mass transfer as it diminishes the resistance for the transport of water vapor. As mentioned before, polymer concentration, additive concentration and air gap length may have significant influences on contact angle, porosity, and pore size [27,31]. The levels of the effective parameters are presented in Table 2.
Table 2
The level of variables chosen for the Box-Behnken design.
Variable Symbol
Coded variable level
Low Center High
-1 0 +1
Polymer concentration (%w/w) X1 10 16 22
Salt concentration (%w/w) X2 0 2 4
Air gap length (cm) X3 0 20 40
The behavior of the system was determined by the following second-order polynomial equation:
ε
β
β
β
β
+
+
+
+
=
∑
∑
∑∑
− = = = = j i k i k j ij i k i ii i k ii
x
x
x
x
Y
1 1 2 2 1 10 (4)
where Y is the predicted response (Y1 = surface pore size, Y2 = porosity, Y3 =
contact angle) and Eq. (5) is obtained for three independent variables:
(5)
where x1, x2, and x3 are input variables; β0 is constant; β1, β2, and β3 are linear
coefficients; β11, β22 and β33 are quadratic coefficients; β12, β13 and β23 are
interaction coefficients and ε is noise or error.
In this study, a Box-Behnken statistical design with three factors and three levels was employed to fit the second order polynomial model. Therefore, 15 experiments were required for this procedure (see Table 4). The Design-Expert software (version 9, Stat-Ease Inc., Minneapolis, USA) was used for the regression of the model.
2.6. MD experiment
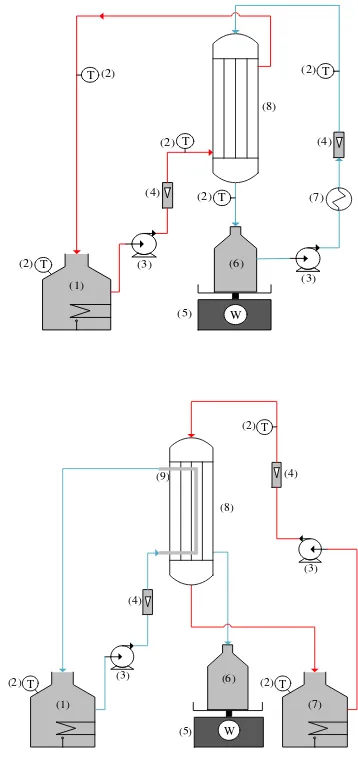
DCMD and AGMD experimental setups (see Figure 2) were used to evaluate the desalination performance of the fabricated membranes. A tubular PVDF hollow fiber membrane module was fabricated. Three hollow fiber membranes were cut and packed in a plastic shell-and-tube module using epoxy resin at both ends. Each module was made up of 3 hollow fibers with 20 cm length. The modules were vertically mounted on the MD installation to eliminate the effects of free convection to remove air bubbles [16]. In the DCMD module, the hot salt solution flowed through the shell side, whereas the cold water flowed through the lumen side by means of a variable speed
double head peristaltic pump (BT100S, Hangzhou Cheng Technology Co., China) at a constant flow rate of 0.43 m/s. The hot feed solution and cold water counter-currents simultaneously flowed through the module. The inlet temperature of the cold water was kept constant at 25 °C.
In the AGMD module, the hot saline feed flowed through the lumen side and cold water at 25 °C circulated in a stainless steel tube at a flow rate of 0.43 m/s. This tube was used as a condenser passed through the fibers in the module. In both methods, hot feed solution and cold water temperatures were controlled by water baths, and the stream temperatures were measured with thermocouples with accuracies of ±0.1 °C. The inlet temperature of the feed solution inside the modules was maintained at three different degrees (60, 70 and 80 °C) for three different feed concentrations (35, 50 and 65 g/l) in both methods. For each feed temperature and concentration, the distillate weight was measured by a balance over the predetermined time (1 hr) after the outlet temperatures had reached the steady state.
(2) (3) (4) (5) (7) (8) (4) T T T T T W (1) (3) (2) (2) (2) (2) (6) (2) (3) (4) (5) (8) (9) T (4) W T T (1) (2) (2) (3) (6) (7)
Fig. 2. A schematic diagram of DCMD (upside) and AGMD (downside) experimental set-up (1: water heater and hot feed tank; 2: thermocouple; 3: peristaltic pump; 4: flow meter; 5: balance; 6: permeate tank; 7: water cooler; 8: DCMD and AGMD modules; 9: condenser tube)
The permeation flux of the membranes was calculated by the following equation:
t
A
w
J
.
=
(6)where J is the pure water flux (kg/m2•hr), W is the permeation mass (kg), A is the effective membrane areas (m2) based on the fiber’s outer diameter, t is the sampling time (hr).
ε β β β β β β β β β β + + + + + + + + + +
= 12 12 131 3 23 2 3
2 3 33 2 2 22 2 1 11 3 3 2 2 1 1
0 x x x x x x xx xx xx
T. Vazirnejad et al. / Journal of Membrane Science and Research 2 (2016) 169-178
outer
d
L
n
A
=
∗
∗
π
∗
(7)where n, L, and douter are the number of fibers, the length of PVDF hollow
fiber membrane and the outer diameter of the PVDF membrane, respectively. The effective filtration area (A) of the self-made hollow fiber filtration module was about 22.7 cm2. In the hollow fiber membranes, each module contained 3 hollow fiber membranes (averagely, OD: 1.2 mm, ID: 0.9 mm) housed inside a stainless steel tube (OD: 20 mm, ID: 15 mm) and sealed with the epoxy resin.
The following equation led to the salt rejection (R) of the hollow fiber membrane:
%
100
)
1
(
2 1
×
−
=
c
c
R
(8)where c1 and c2 are the salt concentration of permeate and feed solution,
respectively. They are measured by the water quality meter (Model 900, BANTE Co., China).
3. Results and discussions
3.1. Selection of the best salt additive
First, four experiments were performed to determine the best salt among the four chloride salts (NaCl, KCl, CaCl2 and BaCl2) as a non-solvent additive under specific conditions (see Table 1). The particle size distribution of salts was measured by DLS test.
Table 3 shows that the average pore size decreases as the salt particles size declined. SEM images of the cross-section and outer surface of both the membrane and the contact angle of the fibers are presented in the Figure 3.
Table3
Characteristics of PVDF hollow fiber membranes prepared by different salt additives.
Salt additive
Dope viscosity
(cP)
Inner/Outer
Diameter (µm) Contact angle (°)
Porosity (%)
surface pore size
(µm)
LEP (kPa)
NaCl 1236 692.33/976.24 90.04 89.66 0.77 104.7
KCl 1440 832.62/1112.78 81.32 87.8 0.64 106.2
CaCl2 1958 614.6/954.02 89.56 62.53 0.21 101.1
BaCl2 2216 672.26/991.42 93.8 85 0.29 117.5
Previous works showed that the presence of non-solvent additives in the polymer dopes generally increases the viscosity of polymer dopes and generates a spongy membrane with a finger-like structure [32,33]. As reported in Table 3, the solution containing the salt with a heavier molecular weight (BaCl2 or CaCl2) presents higher viscosity in comparison to solutions with lower molecular weights (NaCl and KCl). Generally, two types of pores are formed in the fiber structure when the salt particles do not dissolve in the polymer solution. In the first type, the pores are caused by removing the solvent from the membrane body through the air gap inside the external coagulant bath and in the second one, the pores are formed by dissolving the salt particles in coagulant fluids. Since salt particles with lower molecular weight dissolve more easily in water, it was observed that many large pores were formed in the fibers containing NaCl and KCl additives through the air gap length. These pores stretch through the air gap and increase the surface pore size.
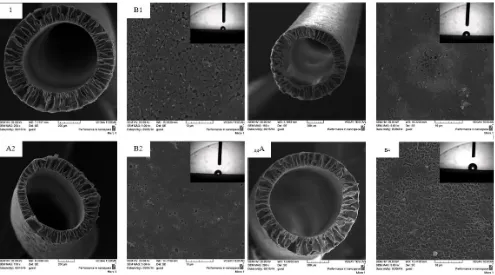
Fig. 3. SEM pictures of; (A) cross section, and (B) outer surface, and contact angle of fibers with salts additive: (1) NaCl, (2) KCl, (3) CaCl2, (4) BaCl2 (salt concentration are fixed to 2% based on polymer concentration).
The addition of salts to the spinning solution increases the rate of precipitation in the phase inversion step, and a more open structure of the membrane is formed. In fact, the rapid precipitation of the polymer was associated with the high miscibility of the salts with water in the interaction of a salt-solvent and salt-PVDF [34, 35]. In addition, the high rate of polymer precipitation leads to the formation of cavities and macro-voids in the membrane [7]. Figure 4 shows a cross section containing a finger-like structure across the whole thickness of the membrane without any obvious difference detectable between the inner and outer surfaces of the fibers. Based
on the previous works [36], the addition of salt additives to the spinning solution has an equally effective impact on the polymer precipitation rate on both the inner and outer surfaces of the fibers.
3.2. Mathematical model and optimization of hollow fiber spinning conditions
Fifteen experiments were performed to investigate the effects of various parameters such as a polymer concentration (x1), salt concentration (x2), air
gap length (x3) and their interactions on the responses [Y1: surface pore size, Y2: porosity(OP), Y3: contact angle(CA)]. All of the results are presented in Table 4. The values of surface pore size in Table 4 have a good agreement
with Table 3. It should be stated that all experiments were done under the spinning conditions of Table 1 except polymer concentrations, salt concentrations and air gap length which varied according to Table 4.
The analysis of variance (ANOVA) for the responses (Y1, Y2, and Y3) is
given in Table 5. The significance of each coefficient was determined by P -value. A P-value less than 0.05 indicate that the specific parameter is significant.
Table 4
Box-Behnken design with actual values for three size fractions and results.
Run Number Actual level of variability
X1 (w/w%) X2 (w/w %) X3 (cm)
Experimental responses
Y1 (µm) Y2 (%) Y3 (°)
1 22 0 20 0.26 73.29 93.04
2 16 0 0 0.18 60.9 80.6
3 10 2 40 0.79 88.68 88.06
4 22 4 20 0.31 81.87 100.08
5 16 2 20 0.34 85.85 92.32
6 22 2 0 0.17 70.2 93.32
7 16 4 0 0.31 78.34 70.05
8 16 2 20 0.35 86.2 90.12
9 10 0 20 0.3 75.47 85.2
10 16 0 40 0.44 65.32 79.76
11 10 4 20 0.38 87.21 89.28
12 16 2 20 0.34 84.13 91.22
13 10 2 0 0.16 74.1 92.4
14 16 4 40 0.54 89.12 86.96
15 22 2 40 0.26 87.46 110
Table 5
Analysis of variance (ANOVA) for response models.
Source surface pore size (µm)
Regression coefficients P-value
Porosity (%)
Regression coefficients P-value
Contact angle (°)
Regression coefficients P-value
Intercept
0.34 - 85.39 - 91.22 -
X1
-0.079 0.0099 -1.58 0.3464 5.19 0.0022
X2
0.045 0.0908 7.69 0.0039 0.97 0.3309
X3
0.15 0.0002 5.88 0.0118 3.55 0.011
X1X2
-0.0075 0.8264 -0.79 0.7284 0.74 0.5871
X1X3
-0.14 0.0035 0.67 0.7679 5.26 0.0092
X2X3
-0.0075 0.8264 1.59 0.4929 4.44 0.0177
X12
- - 0.38 0.8724 8.64 0.0013
X22
- - -6.31 0.0371 -7.96 0.0019
X3 2
- - -5.66 0.0526 -3.92 0.0319
Table 6
Reduced models for surface pore size, porosity and contact angle responses.
Reduced model (model name) Eq. P-value F-value R2 R
adj2
Y1 = 0.34 – 0.079x1 + 0.045x2 + 0.15x3 – 0.0075x1x2 – 0.14x1x3 – 0.0075x2x3 (two factor interaction model) (8) 0.0012 12.25 0.9018 0.8282
Y2 = 85.39 – 1.58x1 + 7.69x2 + 5.88x3 + 0.38x12 – 6.31x22 – 5.66x32– 0.79x1x2 + 0.67x1x3 + 1.59x2x3 (quadratic
model) (9) 0.029 6.23 0.9181 0.7707
Y3 = 91.22 + 5.19x1 + 0.97x2 + 3.55x3 + 8.64x12 – 7.96x22 – 3.92x32+ 0.74x1x2 + 5.26x1x3 + 4.44x2x3 (quadratic
model) (10) 0.0023 19.21 0.9719 0.9213
The Box-Behnken design (BBD) generated the regression equations according to Table 6, which represents an empirical relationship between the responses and the tested variables.
In the interval of our experimental design, the responses of different conditions could be calculated from Eqs. 8–10. The coefficients of determination (R2) and adjusted determination (Radj2) show that the model has good agreement with experimental data. It should be stated that the other factors were kept at zero level in all the presented figures.
3.2.1. The main effect of independent variables
3.2.1.1. Effect of polymer concentration
Table 5 (ANOVA) reports the polymer concentration that has a significant influence on surface pore size and contact angle (P-value < 0.05) except for the porosity (P-value > 0.05).
As shown in Figure4-a, the surface pore size decreases with increasing the polymer concentration. Also, an increase of polymer concentration greatly decreases the porosity to a small value (see Figure 4-b). In fact, by increasing the polymer concentration, the dope solution viscosity increases and forms more compact and spongy structures [14, 37].
T. Vazirnejad et al. / Journal of Membrane Science and Research 2 (2016) 169-178
occurs in the polymer concentration, the surface pore size decreases and reduces the surface roughness [38]. Khulbe and co-workers revealed that the contact angle of outer surface was directly related to the surface roughness
[39]. Moreover, Tang and co-workers observed a similar decrease in the contact angle by an increase in PVDF concentration from 13 to 17 %wt in
fibers containing PEG and LiCl additives [37]. As the polymer concentration is further increased, the contact angle would increase due to the filling of the surface pores with more hydrophobic polymer particles. Hence, the surface structure becomes more compact, thick and hydrophobic (see Figure 5).
Fig. 4. Effect of polymer concentration on; (a) surface pore size; (b) porosity; (c) contact angle
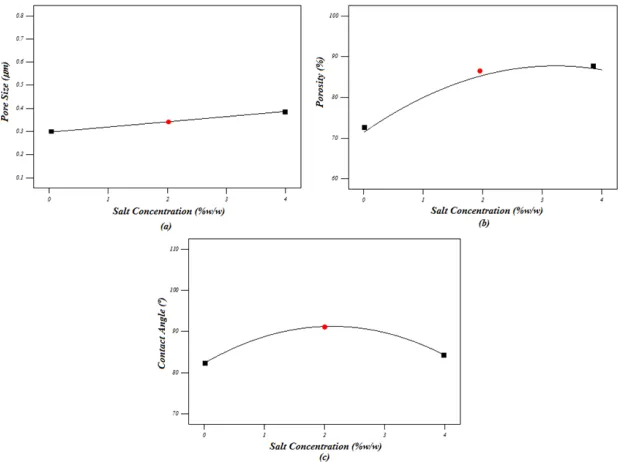
3.2.1.2. Effects of salt concentration
According to Table 5, salt concentration has significant effects on the porosity (P-value < 0.05) with an insignificant effect on the surface pore size and contact angle (CA) (P-value > 0.05).
As shown in Fig. 6-a, a partial increase is observed in the pore size by elevation of salt concentration due to stickiness of the salt particles. Figure 6 -b shows that the porosity increases -by a rise in the salt concentration. Many researchers have reported similar results for several additives [38,40-42]. This observation can be explained by the following reasons.
Fig. 5. Effect of polymer concentration on outer surface structure (polymer concentration varied from 10% to 22%).
The porosity of fibers increases because of an increase in the number of pores by dissolving the salt particles in water and removing them from the fiber structure. Moreover, the high salt concentration in the dope solution increases the dope solution viscosity and sponge-like voids are formed, which do not allow a further increase in porosity [32, 42-44].
The result of ANOVA denoted that the salt concentration (x2) has an
insignificant effect on the contact angle (P-value > 0.05). The contact angle increases (see Figure 7-c) when the surface roughness increases by raising of the pore size [38,39]. Consequently, a decrease in response could be the result of a very large increase in pore size, and the liquid drops diffuse through the very large pores [36,45]. Garcı´a-Payo and co-workers reported that the water contact angle is independent of membrane pore size in the flat sheet membrane [46]. However, Tang and co-workers found that the growth of the salt concentration decreases the contact angle. The effect of an increase in the
salt concentration on the outer surface structure of the fibers is shown in
Figure 6. As could be seen, the pore size of the membrane was increased by a rise in salt concentration. Furthermore, Figure 7 illustrates the effect of salt concentration on the outer surface structure. Thus, it is clear that the pore-size becomes larger as well as salt concentration being increased.
3.2.1.3. Effect of air gap length
The result of ANOVA (see Table 5) indicated that the air gap length has a significant influence on all of the responses (P-value < 0.05). Figure 8 and
Table 5 show that the surface pore size is enhanced by increasing the air gap length. Indeed, the gravity force has a significant impact on the fiber through the air gap length and stretching of the pores. Tang and co-workers found similar results for pore size by increasing the air gap [37]. Also, an extension of air gap length and pore size could generally develop the porosity. In very long air gaps, the sponge-like voids formed and avoided a further increase in the porosity. By increasing the air gap length, the contact angle primarily increased. By a further extension of the air gap length, the roughness of the outer surface and contact angle reduced [39].
3.2.2. The interaction between the variables
The plots of two- and three-dimensional RSM graphically represent the regression of the model. Figures 9 and 10 show that the surface pore size is small when polymer concentration and air gap length are high and salt concentration is low. These results have good agreement with the experimental findings.
As shown in Figures 11 and 12, the porosity of the prepared fibers reaches the highest level in the condition of low polymer concentration, the salt concentration of 2%wt and air gap length of 20 cm.
Figures 13 to 15 show that the maximum contact angle occurs at a very high concentration of polymer, the salt concentration (2-3 %wt) and air gap length in the range of 20 to 30 cm.
3.2.3. Validation of the model
The optimum values of the variables were determined by the Design Expert software. This software is used to obtain the maximum contact angle and minimum surface pore size. In fact, it evaluates the LEPw and maximum overall porosity to raise the MD flux. The optimum condition of fiber production is the polymer concentration of 22 wt%; salt concentration of 2.9 wt% and air gap of 34.5 cm with the responses of Y1 = 0.29 µm, Y2 = 88.3%
and Y3 = 110°. In order to validate the equations of the model, a verification
pore size, 0.22 µm; porosity, 86.7%; contact angle, 113° and inner/outer diameter, 665.11/945.34 µm was obtained from the experiments. The experimental and calculated response values were close to each other and
demonstrated the validation of the Box-Behnken model. SEM pictures illustrate the cross section (A, B), an outer surface and contact angle (C) of this fiber (see Figure 16).
Fig. 6. The effect of salt concentration on; (a) surface pore size; (b) porosity; and (c) contact angle.
Fig. 7. Effect of salt concentration on outer surface structure (salt concentration varied from 0 to 4% base on polymer weight).
Fig. 8. Effect of air gap length on the outer surface structure (the air gap length varied from 0 to 40 cm).
T. Vazirnejad et al. / Journal of Membrane Science and Research 2 (2016) 169-178
Fig. 10. The effects of polymer concentration (x1) and air gap (x3) on the surface pore size: (a) 2D and (b) 3D plots.
Fig. 11. The effects of polymer concentration (x1) and air gap (x3) on the porosity: (a) 2D and (b) 3D plots.
Fig. 12. The effects of salt concentration (x2) and air gap (x3) on the porosity: (a) 2D and (b) 3D plots.
Fig. 13. The effects of polymer concentration (x1) and salt concentration (x2) on the contact angle: (a) 2D and (b) 3D plots.
Fig. 15. The effects of salt concentration (x2) and air gap (x3) on the contact angle: (a) 2D and (b) 3D plots.
Fig. 16. SEM pictures; (A, B) cross section, (C) outer surface and thecontact angle of hollow fiber fabricated under optimum condition (salt additive BaCl2 concentration 2.9%, air gap 34.5 cm, polymer concentration 22 %).
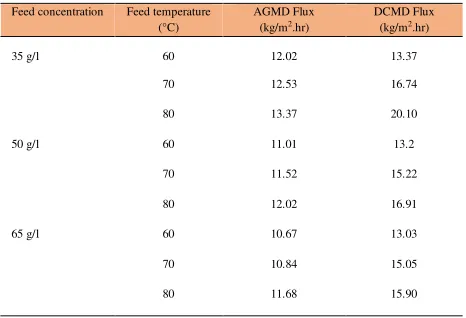
3.3. MD experiments
The hollow fiber membrane prepared at the optimum condition was applied for the desalination by DCMD and AGMD methods. The distillate flux of the fiber in three different feed concentrations (35, 50 and 65 g/l) and three different feed temperatures (60, 70 and 80 °C) in DCMD and AGMD processes are presented in Table 7. During the DCMD and AGMD processes, all salt rejections were always greater than 99.9%. Also, this work has been compared to other works with respect to results of porosity and flux (see
Table8).
Table 7
Effect of feed temperature on flux permeation for DCMD and AGMD at feed concentration.
Feed concentration Feed temperature (°C)
AGMD Flux (kg/m2.hr)
DCMD Flux (kg/m2.hr)
35 g/l 60 12.02 13.37
70 12.53 16.74
80 13.37 20.10
50 g/l 60 11.01 13.2
70 11.52 15.22
80 12.02 16.91
65 g/l 60 10.67 13.03
70 10.84 15.05
80 11.68 15.90
The effect of the feed temperature on the distillate flux has been investigated for different DCMD modules and systems [6,30,47]. The distillate flux was increased exponentially as the feed temperature rises at the same permeate temperature. This trend is due to the exponential increase of the vapor pressure of the feed solution with rising temperature, which enhances the driving force [7]. In this study, the distillate flux in DCMD is higher than AGMD at all feed concentrations and temperatures. Since the feed temperature increases at any feed concentration, the distillate flux in the two methods increases and the difference between the distillate fluxes in AGMD is slight for several temperatures. The high amount of the non-volatile solute concentration in the feed solution reduces the distillate flux. This behavior is attributed to the decrease of the water vapor pressure and driving
force by decreasing the water activity in the feed solution. Furthermore, there is also the contribution of the concentration polarization effect; however, this contribution is in the infinitesimal contrary to the temperature polarization effect [7]. For all constant feed temperatures, AGMD and DCMD distillate flux decreases with increasing the feed concentration.
Finally, a fiber under the same optimum spinning conditions with/without salt additive (BaCl2) (22%wt PVDF and 78%wt DMAC) was prepared. DCMD and AGMD modules were assembled by this fiber and tested at the feed concentration of 100 mg/l and feed temperature of 80 °C. Indeed, this is the best MD condition in our study. MD test results show that distillate fluxes (in salt rejection (>99.9%),) improved from 13.75 kg/m2.hr to 20.10 and 10.22 to 13.37 kg/m2.hr for DCMD and AGMD methods, respectively.
Table 8
Comparison between this work and the other related works.
Membranes NaCl conc. in
feed (gr/L)
Flux (kg/m2.hr)
Porosity (%)
Salt rejection
(%)
Reference
PVDF membrane
flat sheet
35 18.9 78 99.8 [2]
PVDF-CTFE
hollow fiber 35 62.5 86 99.9 [3]
PVDF-PTFE
hollow fiber 35 40.4 86 99.8 [5]
Dual layer PVDF hollow
fiber
35 67 65 99.9 [19]
PVDF-BaCl2 35 20.1 87 99.9 This work
4. Conclusion
PVDF hollow fiber membranes were prepared by four chloride salts (NaCl, KCl, CaCl2 and BaCl2) as an additive in a dry/wet phase inversion. After the best salt additive (BaCl2) is determined, the Box-Behnken method was used to optimize the polymer concentration, salt concentration and air gap length variables. The fabricated membranes were characterized by SEM, contact angle test and porosity measurements for each hollow fiber membrane. The following conclusions have been obtained:
T. Vazirnejad et al. / Journal of Membrane Science and Research 2 (2016) 169-178
increases the viscosity of the solution and tends to make more porous membranes with high surface hydrophobicity and low surface pore size.
(2) As the polymer concentration increases, the contact angle initially decreases and then increases. However, this response initially increases and then decreases by enhancing the salt concentration and air gap length.
(3) The porosity of the fibers decreases when the polymer concentration in dope solution is increased. The development of salt content and air gap length in the spinning process generally increases the porosity of the fiber from 60.9% to 89.1%.
(4) The variation of surface pore size are similar to those of the porosity. As the polymer concentration increases, the porosity decreases and enhances by increasing the salt concentration and air gap length.
(5) DCMD and AGMD methods were tested for desalination by the hollow fiber membrane produced in optimum conditions (polymer concentration, 22%wt; BaCl2 concentration, 2.9%wt; air gap length, 34.5 cm) at different feed temperatures (60, 70 and 80 °C) and concentrations (35, 50 and 65 g/l). It was observed that MD fluxes were the highest at minimum feed concentration (100 mg/l) and maximum feed temperature (80 °C).
(6) The distillate fluxes of the fabricated hollow fiber with/without the salt additive (BaCl2) are compared. The findings show that the salt additive significantly improved distillate flux to 46% and 31% for DCMD and AGMD, respectively.
References
[1] G. Zakrzewski-Trznadel, A.G. Chmielewski, N.R. Miljevic, Separation of protium/deuterium and oxygen-16/oxygen-18 by membrane distillation, J. Membr. Sci. 113 (1996) 337-342.
[2] H. Fan, Y. Peng, Application of PVDF membranes in desalination and comparison of the VMD and DCMD processes, Chem. Eng. Sci. 79 (2012) 94-102.
[3] J. Wang, L. Zheng, Z. Wu, Y. Zhang, X. Zhang, Fabrication of hydrophobic flat sheet and hollow fiber membranes from PVDF and PVDF-CTFE for membrane distillation, J Membr. Sci. 497 (2016) 183–193.
[4] X. Li, Y. Chen, X. Hu, Y. Zhang, L. Hu, Desalination of dye solution utilizing
PVA/PVDF hollow fiber composite membrane modified with TiO2
nanoparticles, J. Membr. Sci. 471 (2014) 118–129.
[5] M.M. Teoh, T.S. Chung, Membrane distillation with hydrophobic macrovoid-free PVDF – PTFE hollow fiber membranes, Sep. Purif. Technol. 66 (2009) 229–236.
[6] M.S. El-Bourawi, Z. Ding, R. Ma, M. Khayet, A framework for better understanding membrane distillation separation process, J. Membr. Sci. 285 (2006) 4-29.
[7] M. Khayet, T. Matsuura, Membrane separation principles and applications, Elsevier, Netherland (2011).
[8] F. Liu, N.A. Hashim, Y. Liu, M.R.M. Abed, K. Li, Progress in the production and modification of PVDF membranes, J. Membr. Sci. 375(2011) 1–27. [9] N. Awanis-Hashim, Y. Liu, Stability of PVDF hollow fiber membranes in a
sodium hydroxide aqueous solution, Chem. Eng. Sci. 66 (2011) 1565–1575. [10] A. C. Sun, W. Kosar, Y. Zhang, X. Feng, Vacuum membrane distillation for
desalination of water using hollow fiber membranes ” J. Membr. Sci. 455 (2014) 131–142.
[11] X. Li, Y. Chen, X. Hu, Y. Zhang, L. Hu, Selectivity and characteristics of direct contact membrane distillation type experiment: Part II. Membrane treatment and selectivity increase, J. Membr. Sci. 471 (1992) 118–129. [12] B. Wu, X. Tan, W.K. Teo, K. Li, Removal of benzene/toluene from water by
vacuum membrane distillation in a PVDF hollow fiber membrane module.” Sep. Sci. and Technol. 40 (2005) 2679-2695.
[13] B. Wu, X. Tan, K. Li, W.K. Teo, Removal of 1,1,1-trichloroethane from water using a poly(vinylidene fluoride) hollow fiber membrane module: Vacuum membrane distillation operation, Sep. Purif. Technol. 52 (2006) 301-309. [14] B. Wu, K. Li, W.K. Teo, Preparation and characterization of poly(vinylidene
fluoride) hollow fiber membranes for vacuum membrane distillation, J. Appl. Polymer Sci. 106 (2007) 1482-1495
[15] S. Bonyadi, T.S. Chung, Flux enhancement in membrane distillation by fabrication of dual layer hydrophilic-hydrophobic hollow fiber membranes, J. Membr. Sci. 306 (2007) 134-146
[16] K. Y. Wang, T. S. Chung, M. Gryta, Hydrophobic PVDF hollow fiber membranes with narrow pore size distribution and ultra-thin skin for the fresh water production through membrane distillation, Chem. Eng. Sci. 63 (2008) 2587–2594.
[17] A.S. Noor Adila, M.Y. Noordin, K.Y. Wong, S. Izman, Modeling of spinning process for efficient production of hollow fiber membranes used in wastewater treatment, Proceedia CIRP 26 (2015) 775–780.
[18] L. Lin, H. Geng, Y. An, P. Li, Heying Chang, Preparation and properties of PVDF hollow fiber membrane for desalination using air gap membrane distillation, Desalination 367 (2015) 145–153.
[19] S. Bonyadi, T.-S.Chung, Highly porous and macrovoid-free PVDF hollow fiber membranes for membrane distillation by a solvent-dope solution
co-extrusion approach, J. Membr. Sci. 331 (2009) 66–74.
[20] D. Wang, K. Li, W.K. Teo, Porous PVDF asymmetric hollow fiber membranes prepared with the use of small molecular additives, J. Membr. Sci. 178 (2000) 13–23.
[21] J. Zhang, J. D. Li, M. Duke, Z. Xie, S. Gray, Performance of asymmetric hollow fibre membranes in membrane distillation under various configurations and vacuum enhancement, J. Membr. Sci. 362 (2010) 517–528.
[22] K.Y. Wang, T. Matsuura, T.S. Chunga, W.F. Guo, The effects of flow angle and shear rate within the spinneret on the separation performance of poly (ethersulfone) (PES) ultrafiltration hollow fiber membranes. J. Membr. Sci. 240 (2004) 67–79.
[23] F. Ismail, P.Y. Lai, Development of defect-free asymmetric polysulfone membranes for gas separation using response surface methodology, Sep. Purif. Technol. 40 (2004) 191–207.
[24] M. Khayet, C. Cojocaru, M.C. García-Payo, Application of response surface methodology and experimental design in direct contact membrane distillation, Ind. Eng. Chem. Res. 46 (2007) 5673–5685.
[25] M. Khayet, C. Cojocaru, M.C. García-Payo, Experimental design and optimization of asymmetric flat-sheet membranes prepared for direct contact membrane distillation, J. Membr. Sci. 351 (2010) 234–245.
[26] M. Khayet, C. Cojocaru, M. Essalhi, M.C. Payo, P. Arribas, L. García-Fernández, Hollow fiber spinning experimental design and analysis of defects for fabrication of optimized membranes for membrane distillation, Desalination 287 (2012) 146–158.
[27] Z.W. Song, L.Y. Jiang, Optimization of morphology and performance of PVDF hollow fiber for direct contact membrane distillation using an experimental design, Chem. Eng. Sci. 101 (2013) 130-143.
[28] X.F. Zeng, E. Ruckenstein, Supported chitosan-dye affinity membranes and their protein adsorption, J. Membr. Sci. 117 (1996) 271-278.
[29] J. Karimi-Sabet, C. Ghotbi, F. Dorkoosh, Application of response surface methodology for optimization of paracetamol particles formation by RESS method, J. Nanomat.Article ID 340379 (2012) 15 pages.
[30] A. Alkhudhiria, N. Darwish, N. Hilal, Membrane distillation: A comprehensive review, Desalination.287 (2012) 2–18.
[31] M. Khayet, The effects of air gap length on the internal and external morphology of hollow fiber membranes, J. Chem. Eng. Sci. 58 (2003) 3091-3104.
[32] A. Mansourizadeh, A.F. Ismail, Effect of LiCl concentration in the polymer dope on the structure and performance of hydrophobic PVDF hollow fiber membranes for CO2 absorption, J. Chem. Eng. Sci. 165 (2010) 980–988. [33] A. Mansourizadeh, A.F. Ismail, A developed asymmetric PVDF hollow fiber
membrane structure for CO2 absorption, Int. J. Greenhouse Gas Control 5 (2011) 374–380.
[34] J. Ren, T.S. Chung, D. Li, R. Wang, Y. Liu, Development of asymmetric 6FDA-2, 6 DAT hollow fi ber membranes for CO2/CH 4 separation: 1. The influence of dope composition and rheology on membrane morphology and separation performance, J. Membr. Sci. 207 (2002) 227–240.
[35] A. Ismail, P. Lai, Effects of phase inversion and rheological factors on the formation of defect-free and ultrathin-skinned asymmetric polysulfone membranes for gas separation, Sep. Purif. Technol 33 (2003) 127–14 3. [36] C. Feng, B. Shi, G. Li, Y. Wu, Preparation and properties of the microporous
membrane from poly(vinylidene fluoride-co-tetrafluoroethylene) (F2.4) for membrane distillation, J. Membr. Sci. 237 (2004) 15-24.
[37] Y. Tang, N. Li, A. Liu, S. Ding, C. Yi, H. Liu, Effect of spinning conditions on the structure and performance of hydrophobic PVDF hollow fiber membranes for membrane distillation, Desalination 287 (2012) 326–339. [38] M. Khayet, C.Y. Feng, K.C. Khulbe, T. Matsuura, Preparation and
characterization of polyvinylidene fluoride hollow fiber membranes for ultrafiltration, Polymer 43 (2002) 3879–3890.
[39] K.C. Khulbe, C. Feng, T. Matsuura, G.C. Kapantaidakis, M. Wessling, G.H. Koops, Characterization of polyethersulfone-polyimide hollow fiber membranes by atomic force microscopy and contact angle goniometry, J. Membr. Sci. 226 (2003) 63–73.
[40] E. Curcio, E. Fontananova, G.D. Profio, Influence of the structural properties of poly(vinylidene fluoride) membranes on the heterogeneous nucleation rate of protein crystals, J. Physic. Chem. B 110 (2006) 12438–12445.
[41] S.P. Deshmuck, K. Li, Effect of ethanol composition in water coagulation bath on morphology of PVDF hollow fiber membranes, J. Membr. Sci. 150 (1998) 75–85.
[42] E. Fontananova, J.C. Jansen, A. Cristiano, E. Curcio, E. Drioli, Effect of additives in the casting solution on the formation of PVDF membranes, Desalination 192 (2006) 190–197.
[43] S. Atchariyawut, C. Feng, R. Wang, R. Jiraratananon, D.T. Liang, Effect of membrane structure on mass-transfer in the membrane gas–liquid contacting process using microporous PVDF hollow fibers, J. Membr. Sci. 285 (2006) 272–281.
[44] S. Wongchitphimona, R. Wang, R. Jiraratananona, L. Shi, C.H. Loh, Effect of polyethylene glycol (PEG) as an additive on the fabrication of polyvinylidene fluoride-co-hexafluoropropylene (PVDF-HFP) asymmetric microporous hollow fiber membranes, J. Membr. Sci. 369 (2011) 329–338.
[45] C. Feng, B. Shi, G. Li, Y. Wu, Preliminary research on microporous membrane from F2.4 for membrane distillation, Sep. Purif. Technol. 39 (2004) 221-228.
[46] M.C. Garcı´a-Payo, M.A. Izquierdo-Gil, C. Fernandez-Pineda, Wetting study of hydrophobic membranes via liquid entry pressure measurements with aqueous alcohol solutions, J. Colloid Interface Sci. 230 (2000) 420-431. [47] M. Khayet, C. Cojocaru, G. Zakrzewski-Trznadel, Response surface modeling
and optimization in pervaporation, J. Membr. Sci. 321 (2008) 272–283.