Cross Mark
Pak. J. Anal. Environ. Chem. Vol. 20, No. 2 (2019) 115 – 126
http://doi.org/10.21743/pjaec/2019.12.15
Modeling and Optimization of Electrocoagulation Process
for the Removal of Yellow145 dye Based on Central
Composite Design
Abdul Rauf Shah, Hajira Tahir
*and Sonia Sadiq
Department of Chemistry, University of Karachi-75270, Karachi, Pakistan. *Corresponding Author Email: [email protected]
Received 06 February 2019, Revised 06 November 2019, Accepted 10 November 2019
---Abstract
In this study, Central Composite Design (CCD) approach of Response Surface Methodology (RSM) was applied to develop a mathematical model and to optimize the parameters of electrocoagulation process (EC) for the removal of Yellow145 (Y145) dye. The EC process was studied by using coupled electrodes of Fe-Fe and Al-Al, separately. The operational parameters of the process such as dye concentration, pH, electrolysis time and amount of NaCl were studied to obtain their desired levels for getting the high value of the removal of the dye. The values of correlation coefficient (R2) of the model were found to be 81.71%, 56.93% for Fe-Fe and Al-Al, respectively. Analysis of variance (ANOVA) helped in finding the significant variables of the process. The response surface plots were plotted to observe the interaction between the levels of the factors on the response of the process.
Keywords: Electrocoagulation process, Response surface methodology, Central composite
design, Yellow145, FTIR, Cost analysis.
---Introduction
The textile industrial sector consumes large volume of water during dyeing and finishing operations. This sector also discharges large portion of effluent into the natural resources of water. The textile effluent contains many dyes which cause environmental and health problems. Azo dyes are used in the textile, paint, ink and plastic industries. These dyes show stability against bio-degradation [1-4]. Electrochemical-based systems are controlled and rapid process. They need only electrons to treat wastewater. They do not require chemicals and micro-organisms [5, 6]. Among the electrochemical techniques, (EC) process has a wide applications for the treatment of industrial effluents.
The theory of EC and chemical
coagulation is almost similar. In EC, the coagulant
of Al3+, Fe3+ ions are supplied by applying an electric current to the metal anodes kept in a EC reactor [7, 8]. Firstly, the metal anode is oxidized as follows:
M(S) M(aq)
n+
+ ne- (1)
Additionally, the electrolysis of water takes place at the cathode and anode as follows:
2H2O(l)+ 2e
-H2 (g)+ 2OH
-at c-athode (2)
2H2O(l) 4H
+
+O2(g)+4e
-at anode (3)
floatation process to remove the flocculated particles out of the water.
Furthermore, the hydroxide ions formed at the cathode increase the pH of the EC system and induce the formation of precipitates of metal ions with the hydroxides as follows:
M(aq)n+ + nOH- M(OH)n(s) (4)
Eventually, the destabilized particles in the EC system undergo aggregation to form flocs [9].
In case of using iron electrodes, the following two mechanisms have been proposed for the formation of the metal hydroxide [10]:
Mechanism-1
The reactions at anode: 4Fe(S)+ 8 e
-4Fe+2(aq) (5)
4Fe+2+ 10H2O + O2 4Fe(OH)3(S)+8H+ (6)
The reactions at cathode:
8H++ 8e- 4H2(g) (7)
Overall reactions:
4Fe(S)+10H2O + O2 4Fe(OH)3(S)+ 4H2(g) (8)
nFe(OH)3(S) Fen(OH)3n(s) (9)
Mechanism-2
The reaction at anode: Fe(S)– 2 e
-Fe+2(aq) (10)
Fe+2(aq)+ 2OH
-Fe(OH)2 (11)
The reaction at cathode: 2H2O + 2 e
-2OH- + 4H2(g) (12)
Overall reactions:
Fe(S)+ 2H2O Fe(OH)2 + H2(g) (13)
nFe(OH)2(S) Fen(OH)2n(s) (14)
The way of removing dye from wastewater.
Precipitation:
Dye+[Monomeric Fe ] [Dye -Monomeric Fe ](15)
Dye + Polymeric-Fe [Dye -Polymeric Fe] (16)
Adsorption:
Dye + Fen(OH)n Sludge(s) (17)
[Dye -Polymeric Fe ] + Fen(OH)n Sludge(s) (18)
The main reactions at the electrodes in case of Al-Al electrodes combination are:
Al Al+3at anode (19)
3H2O + 3e- 3/2H2+ 3OH- at cathode (20)
At high pH, the formation of hydrogen gas at the cathode generates OH−ions [11].
2Al + 6H2O + 2OH
-2Al(OH)4
-+3H2 (21)
The formed aluminium and hydroxide ions react to form various monomeric species which are finally changed into Al(OH)3according to complex
precipitation kinetics. The following interaction mechanisms are possible between the molecules of a dye and hydrolysis by-products [12, 13].
Precipitation:
Dye + [Monomeric Al] [Dye -Monomeric
Al]s, pH = 4-5 (22)
Dye+PolymericAl [Dye-Polymeric Al]s,
pH=5-6 (23)
Adsorption:
Dye + Al(OH)3 Particle (24)
[Dye -Polymeric Al]s + Al(OH)3(s) Particle (25)
These flocs polymerise as :
nAl(OH)3 Aln(OH)3n (26)
In EC process the excessive amount of coagulants is not added owing to their direct generation by electro-oxidation of a sacrificial anode. EC equipment is simple and easy to operate and also require short reaction time and low sludge production [14].
design under RSM, is an efficient method. It provides more detailed information regarding the data obtained from a treatment process in fewer number of experiments. This article present the results of the laboratory scale studies on the removal of Y145 dye from simulated wastewater using coupled iron-iron (Fe-Fe) and aluminium-aluminium (Al-Al) electrodes by EC process. The study will provide guidance in operating and designing reactors for the treatment of large volume of wastewater.
Materials and Methods
Experimental Setup and Procedure
A laboratory-scale glass EC setup was used. For each test, a 1000 mL of Y145 dye sample was used. Before each run, acetone was used to wash the electrodes and the impurities were removed by dipping in a solution of HCl solution [16]. All the chemicals used to be of
analytical-reagent grade. The EC experiments were
conducted by applying a voltage of 15V by means of a DC power supply (Yaxun 1502DD; 15V, 2A). At the end of each run, the sample was collected and filtered to remove floated and precipitated materials. After that, the filtrate was analyzed with T80 UV/VIS spectrophotometer. The dye and the obtained sludge were characterized by FTIR model NICOLET 6700 [17].
Figure 1. The structure of Y145 dye
Experimental Design and Model Development
The optimum levels of the factors of EC process were found in three analytical steps; adequacy of various model tests (sequential model sum of squares and model summary statistics), ANOVA, and the response surface plotting for the removal of Y145 from simulated wastewater. The data were analyzed with the Minitab Software 17. A total of 31 experiments were conducted in this study. The levels of the variables are given in Table 1. Table 2 is representing the treatments and corresponding the removal of Y145 by using two
separate electrodes systems. The linear, quadratic, and combined effects of the operational parameters on the removal of the dye were described by a second-order polynomial as given below:
2 i ii 4
1 i j i ij 4
1 j 4
1 i i i 4
1 i
o x xx x
Y
(27)Table 1. The levels of the factors of EC process.
Independent Variables
-œ -1 0 +1 +œ
[A] [dye] (mg/L)
100 150 200 250 300
[B] NaCl (g/L) 1 1.25 1.5 1.75 2
[C] pH 3 5 7 9 11
[D] Electrolysis Time (min)
10 15 20 25 30
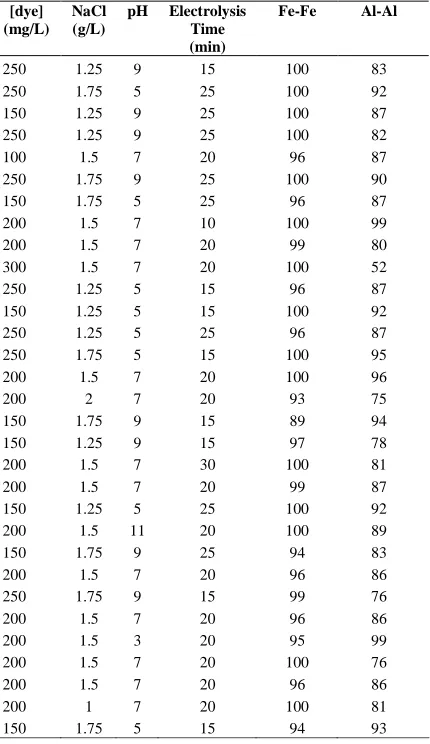
Table 2.The full-factorial design used for the removal of Y145 dye
using EC.
[dye] (mg/L)
NaCl (g/L)
pH Electrolysis Time (min)
Fe-Fe Al-Al
250 1.25 9 15 100 83
250 1.75 5 25 100 92
150 1.25 9 25 100 87
250 1.25 9 25 100 82
100 1.5 7 20 96 87
250 1.75 9 25 100 90
150 1.75 5 25 96 87
200 1.5 7 10 100 99
200 1.5 7 20 99 80
300 1.5 7 20 100 52
250 1.25 5 15 96 87
150 1.25 5 15 100 92
250 1.25 5 25 96 87
250 1.75 5 15 100 95
200 1.5 7 20 100 96
200 2 7 20 93 75
150 1.75 9 15 89 94
150 1.25 9 15 97 78
200 1.5 7 30 100 81
200 1.5 7 20 99 87
150 1.25 5 25 100 92
200 1.5 11 20 100 89
150 1.75 9 25 94 83
200 1.5 7 20 96 86
250 1.75 9 15 99 76
200 1.5 7 20 96 86
200 1.5 3 20 95 99
200 1.5 7 20 100 76
200 1.5 7 20 96 86
200 1 7 20 100 81
Where Y is the predicted response and considered as a dependent variable. The Xiand Xj
show the independent variables. While, β
0 is the
constant coefficient, and β
i, βijand βii are the
coefficients of linear, interaction and quadratic terms, respectively [18].
Results and Discussion
Statistical Analysis and Optimization
EC process using Fe-Fe and Al-Al electrodes
The experimental results obtained by CCD were fitted to the second-order (quadratic) polynomial response surface model. The following regression equations with the coded variables were obtained using Fe-Fe and Al-Al electrodes for the removal of Y145 dye:
Fe-Fe=134.1- 0.2260A- 8.3 B+ 0.28C - 0.823 D- 0.000029 AA- 7.17BB - 0.0495 CC+0.0171 DD+ 0.1550 AB+ 0.01062AC - 0.00225AD –
1.625 BC+ 0.250BD+ 0.0437 CD (28)
Al-Al = 112 + 0.341 A + 57.6 B - 14.00 C –
4.09D - 0.001279 AA - 17.1 BB + 0.732 CC+ 0.0771 DD+ 0.030AB - 0.0050 AC + 0.00450AD + 0.50 BC - 0.70BD
+ 0.125 CD (29)
The synergistic effect of the factors is shown by the positive sign of the coefficients in equation (28, 29), whereas the negative sign suggests antagonistic effect [18].
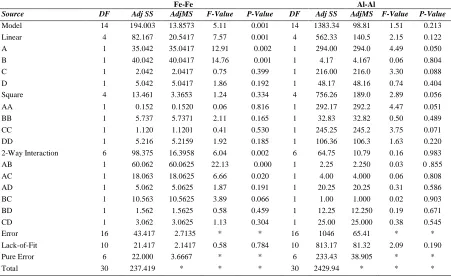
Statistical testing of the model was evaluated by the ANOVA. The data are tabulated in Table 3. It can be noted that the regression model was significant for Fe-Fe electrodes, while insignificant for Al-Al electrodes. The significance of the parameters is given in Table 4. It was also encountered that the concentration of the dye (A), and amount of electrolyte (B) were showing linearly and combined effects on the removal of the dye in Fe-Fe electrodes system. In the second electrode system, the concentration of the dye (A) has a linear and quadratic effect on the removal of the dye. The significance of the model can be analyzed in Table 5 [19-24].
Table 3. ANOVA for the removal of Y145 dye using Fe-Fe and Al-Al electrode combinations.
Fe-Fe Al-Al
Source DF Adj SS AdjMS F-Value P-Value DF Adj SS AdjMS F-Value P-Value
Model 14 194.003 13.8573 5.11 0.001 14 1383.34 98.81 1.51 0.213
Linear 4 82.167 20.5417 7.57 0.001 4 562.33 140.5 2.15 0.122
A 1 35.042 35.0417 12.91 0.002 1 294.00 294.0 4.49 0.050
B 1 40.042 40.0417 14.76 0.001 1 4.17 4.167 0.06 0.804
C 1 2.042 2.0417 0.75 0.399 1 216.00 216.0 3.30 0.088
D 1 5.042 5.0417 1.86 0.192 1 48.17 48.16 0.74 0.404
Square 4 13.461 3.3653 1.24 0.334 4 756.26 189.0 2.89 0.056
AA 1 0.152 0.1520 0.06 0.816 1 292.17 292.2 4.47 0.051
BB 1 5.737 5.7371 2.11 0.165 1 32.83 32.82 0.50 0.489
CC 1 1.120 1.1201 0.41 0.530 1 245.25 245.2 3.75 0.071
DD 1 5.216 5.2159 1.92 0.185 1 106.36 106.3 1.63 0.220
2-Way Interaction 6 98.375 16.3958 6.04 0.002 6 64.75 10.79 0.16 0.983
AB 1 60.062 60.0625 22.13 0.000 1 2.25 2.250 0.03 0 .855
AC 1 18.063 18.0625 6.66 0.020 1 4.00 4.000 0.06 0.808
AD 1 5.062 5.0625 1.87 0.191 1 20.25 20.25 0.31 0.586
BC 1 10.563 10.5625 3.89 0.066 1 1.00 1.000 0.02 0.903
BD 1 1.562 1.5625 0.58 0.459 1 12.25 12.250 0.19 0.671
CD 1 3.062 3.0625 1.13 0.304 1 25.00 25.000 0.38 0.545
Error 16 43.417 2.7135 * * 16 1046 65.41 * *
Lack-of-Fit 10 21.417 2.1417 0.58 0.784 10 813.17 81.32 2.09 0.190
Pure Error 6 22.000 3.6667 * * 6 233.43 38.905 * *
30 28 26 24 22 20 18 16 14 12 10 8 6 4 2 2
1
0
-1
-2
Observation Order
R
es
id
ua
l
Versus Order (response is Fe-Fe)
2 1
0 -1
-2 7
6
5
4
3
2
1
0
Residual
Fr
eq
ue
nc
y
Histogram (response is Fe-Fe)
102 100 98 96 94 92 90 2
1
0
-1
-2
Fitted Value
Re
sid
ua
l
Versus Fits (response is Fe-Fe)
Table 4.Student t and p-values for the removal of Y145 dye using Fe-Fe and Al-Al electrode combinations.
Fe-Fe Al-Al
Term Effect Coef SECoef T-Value P-Value VIF Effect Coef SECoef T-Value P-Value VIF
Constant 98.00 0.623 157.40 0.000 85.29 3.06 27.90 0.000
A 2.417 1.208 0.336 3.590 0.002 1.00 -7.00 -3.50 1.65 -2.12 0.050 1.00
B -2.583 -1.292 0.336 -3.840 0.001 1.00 0.83 0.42 1.65 0.25 0.804 1.00
C 0.583 0.292 0.336 0.870 0.399 1.00 -6.00 -3.00 1.65 -1.82 0.088 1.00
D 0.917 0.458 0.336 1.360 0.192 1.00 -2.83 -1.42 1.65 -0.86 0.404 1.00
AA -0.146 -0.073 0.308 -0.240 0.816 1.03 -6.39 -3.20 1.51 -2.11 0.051 1.03
BB -0.896 -0.448 0.308 -1.450 0.165 1.03 -2.14 -1.07 1.51 -0.71 0.489 1.03
CC -0.396 -0.198 0.308 -0.640 0.530 1.03 5.86 2.93 1.51 1.94 0.071 1.03
DD 0.854 0.427 0.308 1.390 0.185 1.03 3.86 1.93 1.51 1.28 0.220 1.03
AB 3.875 1.937 0.412 4.700 0.000 1.00 0.75 0.37 2.02 0.19 0.855 1.00
AC 2.125 1.062 0.412 2.580 0.020 1.00 -1.00 -0.50 2.02 -0.25 0.808 1.00
AD -1.125 -0.562 0.412 -1.370 0.191 1.00 2.25 1.12 2.02 0.56 0.586 1.00
BC -1.625 -0.812 0.412 -1.970 0.066 1 .00 0.50 0.25 2.02 0.12 0.903 1.00
BD 0.625 0.313 0.412 0.760 0.459 1.00 -1.75 -0.87 2.02 -0.43 0.671 1.00
CD 0.875 0.437 0.412 1.060 0.304 1.00 2.50 1.25 2.02 0.62 0.545 1.00
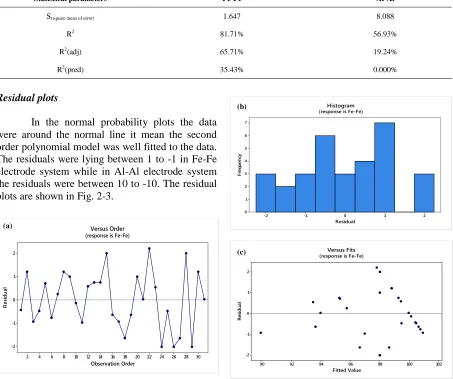
Table 5.Model summary of EC process for the removal of Y145 dye.
Statistical parameters Fe-Fe Al-Al
S(square mean of error) 1.647 8.088
R2 81.71% 56.93%
R2(adj) 65.71% 19.24%
R2(pred) 35.43% 0.000%
Residual plots
In the normal probability plots the data were around the normal line it mean the second order polynomial model was well fitted to the data. The residuals were lying between 1 to -1 in Fe-Fe electrode system while in Al-Al electrode system the residuals were between 10 to -10. The residual plots are shown in Fig. 2-3.
(a)
(b)
3 2 1 0 -1 -2 -3 99 95 90 80 70 60 50 40 30 20 10 5 1 Residual Pe rc en t
Normal Probability Plot (response is Fe-Fe)
30 28 26 24 22 20 18 16 14 12 10 8 6 4 2 10 5 0 -5 -10 -15 Observation Order R es id ua l Versus Order (response is Al-Al)
10 5 0 -5 -10 7 6 5 4 3 2 1 0 Residual Fr eq ue nc y Histogram (response is Al-Al)
100 90 80 70 60 10 5 0 -5 -10 -15 Fitted Value R es id ua l Versus Fits (response is Al-Al)
15 10 5 0 -5 -10 -15 99 95 90 80 70 60 50 40 30 20 10 5 1 Residual Pe rc en t
Normal Probability Plot (response is Al-Al)
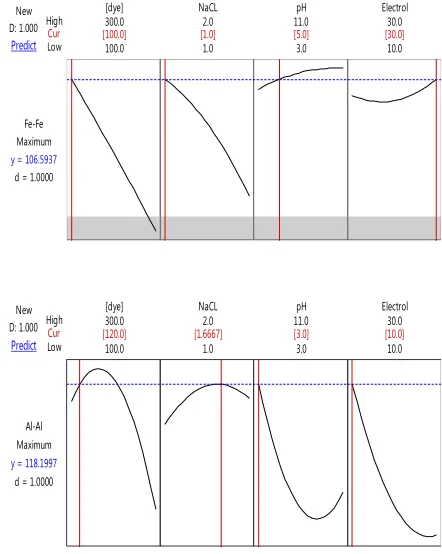
Cur High Low D: 1.000 New Predict
d = 1.0000 Maximum Fe-Fe
y = 106.5937
10.0 30.0 3.0 11.0 1.0 2.0 100.0
300.0 NaCL pH Electrol
[dye]
[100.0] [1.0] [5.0] [30.0]
Cur High Low D: 1.000 New Predict
d = 1.0000 Maximum Al-Al
y = 118.1997
10.0 30.0 3.0 11.0 1.0 2.0 100.0
300.0 NaCL pH Electrol
[dye]
[120.0] [1.6667] [3.0] [10.0]
Figure 2. Residual plots for the removal of Y145 dye using Fe-Fe
electrodes Figure 3.electrodesResidual plots for the removal of Y145 dye using Al-Al
The desired levels of the variables of the process are given in Fig. 4.
Figure 4.Optimum operating conditions of the process
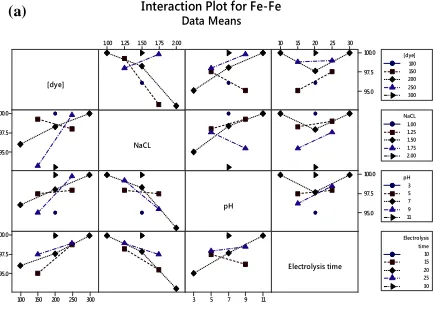
Main interaction plots
300 250 200 150 100 100 99 98 97 96 95 94 93 2.00 1.75 1.50 1.25
1.00 3 5 7 9 11 10 15 20 25 30
[dye]
M
ea
n
NaCL pH Electrolysis time
Main Effects Plot for Fe-Fe Data Means 300 250 200 150 100 100 90 80 70 60 50 2.00 1.75 1.50 1.25
1.00 3 5 7 9 11 10 15 20 25 30
[dye]
M
ea
n
NaCL pH Electrolysis time
Main Effects Plot for Al-Al Data Means
2.00 1.75 1.50 1.25
1.00 10 15 20 25 30
100 75 50 100 75 50 100 75 50 300 250 200 150 100 100 75 50 11 9 7 5 3 [dye] NaCL pH Electrolysis time 100 150 200 250 300 [dye] 1.00 1.25 1.50 1.75 2.00 NaCL 3 5 7 9 11 pH 10 15 20 25 30 time Electrolysis
Interaction Plot for Al-Al
Data Means
2.00 1.75 1.50 1.25
1.00 10 15 20 25 30
100.0 97.5 95.0 100.0 97.5 95.0 100.0 97.5 95.0 300 250 200 150 100 100.0 97.5 95.0 11 9 7 5 3 [dye] NaCL pH Electrolysis time 100 150 200 250 300 [dye] 1.00 1.25 1.50 1.75 2.00 NaCL 3 5 7 9 11 pH 10 15 20 25 30 time Electrolysis Interaction Plot for Fe-Fe
Data Means
Figure 5.Main effect plots
Full interaction plots
The lines in the full interaction plots were not parallel to both X-axis and Y-axis. This indicated that the levels of the factors were varying the removal of Y145 dye during the EC process using Fe-Fe and Al-Al electrodes systems as shown in Fig. 6a-b.
Figure 6.Interaction Plots
The effect of factors on the percent removal of Y145 dye using Fe-Fe and Al-Al electrode combinations.
The effect of dye concentration
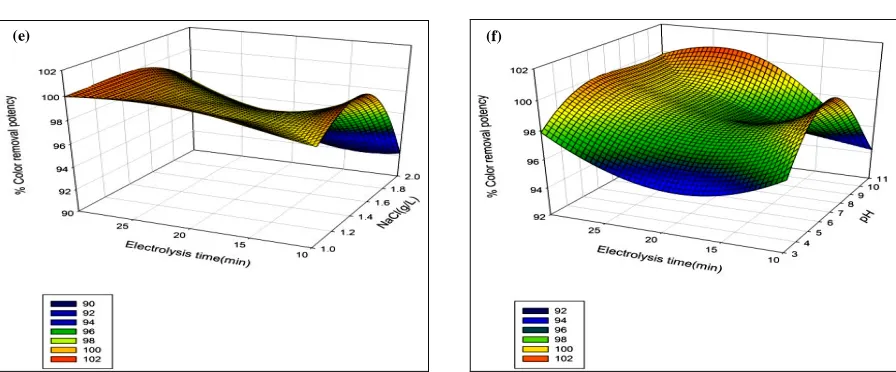
To observe the effect of initial dye concentration on the removal of the dye using two electrode systems by EC, the experiments were carried out for five different dye concentrations (100,150, 200, 250 and 300 mg/L). The higher removals of the dye were obtained using Fe-Fe electrodes as compared to Al-Al electrodes. Furthermore, at the low concentration of the dye the removal was greater as compared to presence of the high concentration of the dye. Because, the high concentration requires the high quantity of coagulant for coagulation in a fixed period of time [25]. The effect of concentration of the dye combined with other factors on the removal efficiency of the dye is shown in Fig. 7, and Fig. 8.
The effect of NaCl
The effect of amount of supporting electrolyte (NaCl) on the removal of Y145 dye is given in Fig. 7 and 8. It can be ascertained from Fig. 7a-d that the dye removal efficiency was not increasing with an increase in the supporting electrolyte concentration in Fe-Fe electrode system while it was increasing using Al-Al electrode system as shown in Fig. 8a-d. The formation of chlorine gas and OCl− owing to the oxidation of chloride ions at the anode, additionally, provides support for the removal of contaminants in the EC system. Thus, the supporting electrolyte not only
(a)
(b)
(a)
increases the conductivity but also contributes as a strong oxidizing agent [26].
The effect of pH
The pH of the EC system significantly affects the efficiency of EC process. The pH determines the type of hydroxide of metal cations in the EC system and also determines the interaction between the formed coagulants and the molecules of dye in the solution. Consequently, It influences the mechanism of the removal of dye from the aqueous system. In order to investigate the effect of the pH of the solution on the removal of the dye, the experiments were performed by adjusting the initial pH such as 3, 5, 7, 9 and 11. Fig. 7 and Fig. 8 are showing that the removal of
the dye was higher in the acidic condition as compared to the basic environment of the EC system. Because, the acidic condition increases the rate of formation of Fe+3cations in the system [27]. The effect of pH of the dye solution combined with other factors on the removal efficiency of the dye is shown in Fig. 7 and 8.
The effect of electrolysis time
The removal efficiency of the dye was increasing with the increase of electrolysis time for both the electrode combinations. It was also in agreement with the reported data [28, 29]. The effect of electrolysis time combined with other factors on the removal efficiency of the dye is shown in Fig. 7 – 8.
(a) (b)
Figure 7.Response surface plots for the removal of Y145 dye using Fe-Fe electrodes
(e) (f)
(a) (b)
Figure 8.Response surface plots for the removal of Y145 dye using Al-Al electrodes
The effect of nature of electrode system
In EC process, the electrodes of Al and Fe were used. They are easily available, low cost, and undergo better dissolution [30]. The published data of some authors pointed out to the benefits of Fe electrodes, while others pointed out to the advantages of using Al anodes. It is also pointed out that Fe is relatively cheaper [31]. Fe forms more denser flocks of coagulated contaminants as compared to Al because it is heavy in mass [32]. Furthermore, Fe has better complex formation nature with inorganic/organic pollutants than Al [33]. However, it is also reported that Al/Al electrode combinations effectively utilized for the removal of dyes and Fe/Fe electrode worked better for COD and phenol removal, while Al/Fe and Fe/Al electrode combinations were successfully applied for the treatment of paper mill wastewater [34]. It is found that around 9 carbon atoms are complexed by one Fe atom, whereas 3 carbon atoms are allowed for complexation by an Al atom. It is also determined that ‘‘coordination’’ numbers of Fe or Al largely depend on the wastewater to be treated. Therefore, the efficiency of the type of electrode is depend upon the type of effluent [35]. In this work Fe-Fe electrode system provided the data of higher removal of Y145 dye as compared to Al-Al electrode system. Therefore, Fe-Fe electrode system will be proved more effective for the removal of the dye in the real effluent.
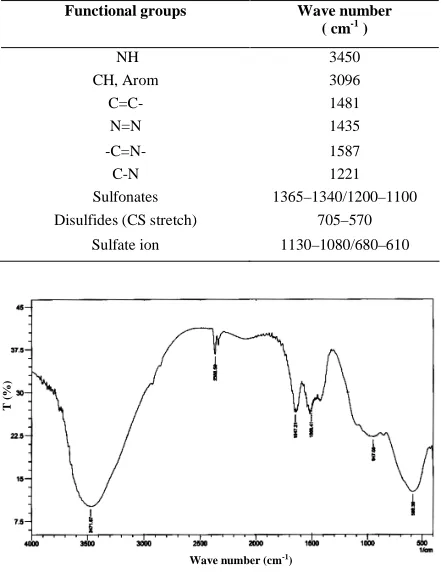
FT-IR analysis
Fig. 9 shows the FT-IR spectrum of Y145 dye. The IR absorption bands of Y145 dye are given in Table 6.
Table 6.The IR absorption bands for the given functional groups
in the dye.
Functional groups Wave number ( cm-1)
NH 3450
CH, Arom 3096
C=C- 1481
N=N 1435
-C=N- 1587
C-N 1221
Sulfonates 1365–1340/1200–1100
Disulfides (CS stretch) 705–570
Sulfate ion 1130–1080/680–610
Figure 9.FT-IR spectrum of Y145 dye
(c) (d)
T
(%
)
Conclusion
In the present study, CCD was
successfully applied to optimize the parameters of the EC process for the removal of Y154 dye from the simulated wastewater using Fe-Fe and Al-Al electrodes. The optimum operating parameters for the Fe-Fe electrode system were 100 mgL-1 of dye concentration, 1.0 gL-1 of NaCl, pH of 5.0 and 30 min of electrolysis time. The maximum removal of the dye was found to be 99.21%. On the other hand, the optimum operating parameters for the Al-Al electrode system were 120 mgL-1 of dye concentration, 1.66 gL-1of NaCl, pH of 3.0 and 10 min of electrolysis time. The percent removal of the dye was found to be 98.24%. Furthermore, It was also encountered that the concentration of the dye (A), amount of electrolyte (B) were showing linearly and combined effect on the removal of the dye in Fe-Fe electrodes system. In the second electrode system, the concentration of the dye (A) has a linear and quadratic effect on the removal of the dye. It is concluded that the process can be effectively applied for the removal of Y145 dye from wastewater at large scale.
Acknowledgment
The author acknowledges the financial assistance from the University of Karachi, Karachi, Pakistan.
References
1. K. S. Hashim and N. H. Al-Saati,Mater. Sci. Eng.,584 (2019) 012024).
https://doi.org/10.1088/1757-899X/584/1/012024
2. B. A. Abdulhadi and P. Kot, Mater. Sci. Eng.,584 (2019) 012035.
https://doi.org/10.1088/1757-899X/584/1/012035
3. N. H. Bektaş, H. Akbulut, H. Inan and A. Dimoglo,J. Hazard. Mater., 106 (2004)101.
https://doi.org/10.1016/j.jhazmat.2003.10.00 2
4. A. K. Golder, A. N. Samanta and S. Ray.
Sep. Purif. Technol.,52 (2006) 102.
https://doi.org/10.1016/j.seppur.2006.03.027
5. A. A Bassam, Y. Yavuz and A. S. Koparal.
Sep. Purif. Technol., 86 (2012) 248.
https://doi.org/10.1016/j.seppur.2011.11.011
6. M. Bayramoglu, M. Eyvaz and M. Kobya.
Chem. Eng. J.,128 (2007) 155.
https://doi.org/10.1016/j.cej.2006.10.008
7. K. Garg and B. Prasad. Environ. Technol. Innov.,8 (2017) 191.
https://doi.org/10.1016/j.eti.2017.07.001
8. M. Y. A. Mohammad, P. Morkovsky, J. A. G. Gomes, M. Kesmez, J. Parga and D. L. Cocke. J. Hazard. Mater., 114 (2004) 199.
https://doi.org/10.1016/j.jhazmat.2004.08.009
9. L-H, Ivonne, C. B. Díaz, G. R. Morales, B. Bilyeu and F. Ureña-Núñez. Chem. Eng. J.,
148 (2009) 97.
https://doi.org/10.1016/j.cej.2008.08.007
10. A. R. Shah, T. Hajira and H. M.
Kifayatullah. Desali. Water Treat., (2017) 72.
doi:10.5004/dwt.2017.21604
11. E. Gengec, M. Kobya, E. Demirbas, A. Akyol and K. Oktor. Desalination, 286 (2012) 200.
https://doi.org/10.1016/j.desal.2011.11.023
12. APHA, AWWA, WPCF, Standard Methods
for the Examination of Water and
Wastewater, 21st ed., American Public Health Association, Washington, DC, (2005).
https://www.worldcat.org/title/standard- methods-for-the-examination-of-water-and-wastewater/oclc/156744115
13. N. A. Daneshvar, Oladegaragoze and N. Djafarzadeh. J. Hazard. Mater., 129 (2006) 116.
https://doi.org/10.1016/j.jhazmat.2005.08.03 3
14. A. R. Shah, T. Hajira and H. M.
Kifayatullah.Int. J. Environ. Sci. Nat. Res., 2 (2017) 555583.
https://pdfs.semanticscholar.org/8c10/549f87 64f65d4057ccfca79cb82768cfb67b.pdf
15. A. Gürses, M. Yalçin and C. Doğar. Waste Manage., 22 (2002) 491.
https://doi.org/10.1016/S0956-053X(02)00015-6
16. M. Rebhun and M. Lurie. Water Sci.
Technol., 27 (1993) 1.
17. M-F. Pouet and A. Grasmick. Water Sci. Technol., 31 (1995) 275.
https://doi.org/10.2166/wst.1995.0536
18. S. Bajpai, S. K. Gupta, A. Dey, M. K. Jha, Vidushi Bajpai, Saurabh Joshi and Arvind Gupta. J. Hazard. Mater., 227 (2012) 436.
https://doi.org/10.1016/j.jhazmat.2012.05.01 6
19. M. Kumar, F. I. A. Ponselvan, J. R. Malviya, V. C. Srivastava and I. D. Mall. J. Hazard. Mater., 165 (2009) 345.
https://doi.org/10.1016/j.jhazmat.2008.10.04 1
20. Kumar, Mayank, F. Infant Anto Ponselvan, Jodha Ram Malviya, V. C. Srivastava and Indra Deo Mall. J. Hazard. Mater., 165 (2009) 345.
https://doi.org/10.1016/j.jhazmat.2008.10.04 1
21. K. S. Ravikumar, S. Krishnan, Ramalingam, and K. Balu. Dyes Pigm., 72 (2007) 66.
https://doi.org/10.1016/j.dyepig.2005.07.018
22. X. Jing, Y. Cao, X. Zhang, D. Wang, X. Wu, and H. Xu. Desalination, 269 (2011) 120.
https://doi.org/10.1016/j.desal.2010.10.050
23. G. Güven, A. Perendeci and A. Tanyolaç.J. Hazard. Mater.,157 (2008) 69.
https://doi.org/10.1016/j.jhazmat.2007.12.08 2
24. K. B. Körbahti and M. A. Rauf.Chem. Eng. J.,136 (2008) 25.
https://doi.org/10.1016/j.cej.2007.03.007
25. I. Arslan-Alaton, M. Kobya, A. Akyol and M. Bayramoğlu.Color. Technol.,125 (2009) 234.
https://doi.org/10.1111/j.1478-4408.2009.00202.x
26. H. Zhang, X. W. Yanli Li, Y. Zhang and D. Zhang, Waste Manage., 30 (2010) 2096.
https://doi.org/10.1016/j.wasman.2010.04.02 9
27. J. Ge, J. Qu, P. Lei and H. Liu., Sep. Purif. Technol., 36 (2004) 33.
https://doi.org/10.1016/S1383-5866(03)00150-3
28. D. Ghosh, C. R. Medhi and M. K. Purkait,
Chemosphere,73 (2008) 1393.
https://doi.org/10.1016/j.chemosphere.2008. 08.041
29. Y. Yavuz, E. Öcal, A. S. Koparal and Ü. B. Öğütveren. J. Chem. Technol. Biotechnol., 86 (2011) 964.
https://doi.org/10.1002/jctb.2607
30. G. Mouedhen, M. Feki, M. D. P. Wery and H. F. Ayedi. J. Hazard. Mater., 150 (2008)
https://doi.org/10.1016/j.jhazmat.2007.04.09 0
31. M. Solak, M. Kılıç, Y. Hüseyin and A.
Şencan. J. Hazard. Mater., 172 (2009) 345.
https://doi.org/10.1016/j.jhazmat.2009.07.01 8
32. O. Sahu, B. Mazumdar and P. K. Chaudhari.
Environ. Sci. Pollut. Res., 21 (2014) 2397.
https://doi.org/10.1007/s11356-013-2208-6
33. S. Vasudevan and A. Mehmet. Oturan. Environ. Chem. Lett., 12 (2014) 97.
https://doi.org/10.1007/s10311-013-0434-2
34. S. Bellebia, S. Kacha, Z. Amel, Bouyakoub and Z. Derriche. Environ. Prog. Sustain. Energy,31 (2012) 361.
https://doi.org/10.1002/ep.10556
35. A. K. Chopra and A. K. Sharma.Appl. Water Sci., 3 (2013) 125.