Hareesh Dara et al., J. Sci. Res. Phar. 2015, 4(1), 12-18
Journal of
Scientific
Research in
Pharmacy
Research Article
Available online through
ISSN: 2277-9469
www.jsrponl
ine.com
Controlled Release Drug Delivery System of Azilsartan Medoximil for the Treatment of Hypertension
Hareesh Dara1*, Narasimha Reddy Yellu2
1Shri College of Pharmacy, Kakatiya University, Kothagudem, Warangal - 506009, Andhra Pradesh, INDIA.
2Dept of Pharmacology and Clinical Pharmacy, University Col Ege of Pharmaceutical Sciences, Kakatiya University, Warangal - 506009, Andhra
Pradesh, INDIA.
Received on: 21-12-2014; Revised and Accepted on: 02-01-2015
ABSTRACT
T
he present research work was aimed to prepare controlled release drug delivery system of Azilsartan Medoximil. Azilsartan medoximil is an angiotensin II receptor antagonist used in the treatment of hypertension. In the present work Methocel K100LV CR, Ethocel 7F P, CMEC were employed as polymers. Preformulations studies were carried out for the drug molecule, all the parameters such as angle of repose, bulk density, tapped density and Hausners ratio were found to be good. Drug and excipient compatability studies were carried out using FTIR and DSC , based on the results the it was found that there were no interactions. Various quality control evaluation parameters were carried out and the results were found to be good. The formulations prepared with ETHOCEL 7F P retarded the drug release up to 12 hours and showed maximum of 96.10% with good retardation. The optimized formulation followed zero order release kinetics controlled by diffusion phenomenon.Key words:Azilsartan Hydrochloride, Methocel K100LV CR, Ethocel 7F P, CMEC and Direct compression method.
INTRODUCTION
F
or many decades treatment of acute diseases or chronic illnesses have been mostly accomplished by delivery of drugs to patients using various pharmaceutical dosage forms including tablets, capsules, suppositories, creams, ointments, liquids, aerosols and injectables. Even today these conventional dosage forms are the primary pharmaceutical vehicles commonly seen in the prescription and over the counter drug market. The oral conventional types of drug delivery systems are known to provide a prompt release of the drug. Therefore to achieve as well as to maintain the drug concentration within the therapeutically effective range needed for treatment, it is often necessary to take this type of drug delivery system several times a day. This results in a significant fluctuation in drug levels often with a sub-therapeutic and or toxic levels and wastage of drug. Recently several technical advancements have resulted in the development of new systems of drug delivery capable of controlling the rate of drug delivery, sustaining the duration of therapeutic activity and targeting the delivery of drug to a tissue[1, 2].Most conventional oral drug products, such as tablets and capsules, are formulated to release the active drug immediately after oral administration, to obtain rapid and complete systemic drug absorption. Such immediate-release products result in relatively rapid drug absorption and onset of accompanying pharmacodynamic effects[3]. However, after absorption of the drug
from the dosage form is complete, plasma drug concentrations decline according to the drug's pharmacokinetic profile. Eventually, plasma drug concentrations fall below the minimum effective plasma concentration (MEC), resulting in loss of therapeutic activity. Before this point is reached, another dose is usually given if a sustained therapeutic effect is desired. An alternative to administering another dose is to use a dosage form that will provide sustained drug release, and therefore maintain plasma drug concentrations, beyond what is a typically seen using immediate-release dosage form[4, 5].
The term modified-release drug product is used to describe products that alter the timing and/or the rate of release of the drug substance. A modified-release dosage form is defined "as
*Corresponding author:
Hareesh DaraShri College of Pharmacy, Kakatiya University,
Kothagudem, Warangal - 506009, Andhra Pradesh, INDIA. *E-Mail: [email protected]
one for which the drug-release characteristics of time course and/or location are chosen to accomplish therapeutic or convenience objectives not offered by conventional dosage forms such as solutions, ointments, or promptly dissolving dosage forms as presently recognized".
Azilsartan medoxomil is an angiotensin II receptor antagonist indicated for the treatment of mild to moderate essential hypertension. Azilsartan medoxomil has so far been shown to be superior to olmesartan and valsartan in lowering blood pressure. Azilsartan medoxomil is hydrolyzed to the active metabolite azilsartan in the GI tract. The presence of food does not affect oral absorption of azilsartan medoxomil , and the bioavailability is 60% for Azilsartan. Maximum plasma concentrations are reached in 1.5 to 3 hours. To improve the bioavailability and to reduce number of doses it was formulated as controlled release drug delivery system.
MATERIALS AND METHODS
Materials:
Azilsartan Medoximil was obtained as a gift sample from Aurabindo Pharma Ltd. All other chemicals were standard grade obtained from SD Fine chemicals.
Methodology:
Preformulation studies:[8, 9]
Before formulation of drug substances into a dosage form, it is essential that drug and polymer should be chemically and physically characterized. Preformulation studies give the information need to define the nature of the drug substance and provide a framework for the drug combination with pharmaceutical excipients in the fabrication of a dosage form.
Calibration curves of Azilsartan in different media: Analytical method development:
a) Determination of absorption maxima:
A solution containing the concentration 10 µg/ ml drug was prepared in 0.1N HCl and pH 6.8 Phosphate buffer UV spectrums was taken using Double beam UV/VIS spectrophotometer. The solution was scanned in the range of 200 – 400.
b) Preparation calibration curve:
Hareesh Dara et al., J. Sci. Res. Phar. 2015, 4(1), 12-18
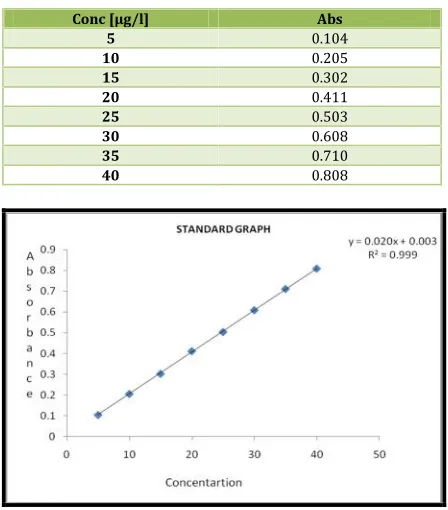
series of dilutions Containing 5,10,15,20,25,30,35 and 40μg/ml ofAzilsartan Medoximil per ml of solution. The absorbance of the above dilutions was measured at 298 nm by using UV-Spectrophotometer taking 0.1N HCl as blank. Then a graph was plotted by taking Concentration on X-Axis and Absorbance on Y-Axis which gives a straight line Linearity of standard curve was assessed from the square of correlation coefficient (R2) which
determined by least-square linear regression analysis. The above procedure was repeated by using pH 6.8 phosphate buffer solutions.
Drug – Excipient compatibility studies:
Fourier Transform Infrared (FTIR) spectroscopy:
The physical properties of the physical mixture were compared with those of plain drug. Samples was mixed thoroughly with 100mg potassium bromide IR powder and compacted under vacuum at a pressure of about 12 psi for 3 minutes. The resultant disc was mounted in a suitable holder in Perkin Elmer IR spectrophotometer and the IR spectrum was recorded from 3500 cm to 500 cm. The resultant spectrum was compared for any spectrum changes.
Formulation:
Formulation development of Tablets:
All the formulations were prepared by direct compression. The compositions of different formulations are given inTable 1. The tablets were prepared as per the procedure given below and aim is to prolong the release of Azilsartan Medoximil . Total weight of the tablet was considered as 300mg.
Procedure:
1) Azilsartan Medoximil and all other ingredients were individually passed through sieve no60.
2) All the ingredients were mixed thoroughly by triturating up to 15 min.
3) The powder mixture was lubricated with talc.
4) The tablets were prepared by using direct compression method.
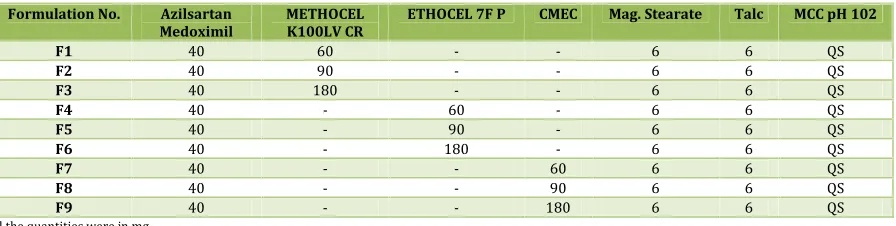
Table No. 1: Formulation composition for tablets
Formulation No. Azilsartan
Medoximil METHOCELK100LV CR ETHOCEL 7F P CMEC Mag. Stearate Talc MCC pH 102
F1 40 60 - - 6 6 QS
F2 40 90 - - 6 6 QS
F3 40 180 - - 6 6 QS
F4 40 - 60 - 6 6 QS
F5 40 - 90 - 6 6 QS
F6 40 - 180 - 6 6 QS
F7 40 - - 60 6 6 QS
F8 40 - - 90 6 6 QS
F9 40 - - 180 6 6 QS
All the quantities were in mg
Evaluation of post compression parameters for prepared Tablets:
The designed formulation tablets were studied for their physicochemical properties like weight variation, hardness, thickness, friability and drug content.
Weight variation test:
To study the weight variation, twenty tablets were taken and their weight was determined individually and collectively on a digital weighing balance. The average weight of one tablet was determined from the collective weight. The weight variation test would be a satisfactory method of deter mining the drug content uniformity. Not more than two of the individual weights deviate from the average weight by more than the percentage shown in the following table and none deviate by more than twice the percentage. The mean and deviation were determined. The percent deviation was calculated using the following formula.
% Deviation = (Individual weight – Average weight / Average weight) × 100
Table No. 2: Pharmacopoeial specifications for tablet weight variation
Average weight of
tablet (mg) (I.P) tablet (mg) (U.S.P)Average weight of percentageMaximum difference allowed Less than 80 Less than 130 10
80-250 130-324 7.5
More than More than 324 5
Hardness:
Hardness of tablet is defined as the force applied across the diameter of the tablet in order to break the tablet. The resistance of the tablet to chipping, abrasion or breakage under condition of storage transformation and handling before usage depends on its hardness. For each formulation, the hardness of three tablets was determined using Monsanto hardness tester and the average is calculated and presented with deviation.
Thickness:
Tablet thickness is an important characteristic in reproducing appearance. Tablet thickness is an important
characteristic in reproducing appearance. Average thickness for core and coated tablets is calculated and presented with deviation.
Friability:
It is measured of mechanical strength of tablets. Roche friabilator was used to determine the friability by following procedure. Preweighed tablets were placed in the friabilator. The tablets were rotated at 25 rpm for 4 minutes (100 rotations). At the end of test, the tablets were re weighed, loss in the weight of tablet is the measure of friability and is expressed in percentage as
% Friability = [ ( W1-W2) / W] × 100
Where, W1 = Initial weight of three tablets W2 = Weight of the three tablets after testing
Determination of drug content:
Tablets were tested for their drug content. Ten tablets were finely powdered quantities of the powder equivalent to one tablet weight of Meloxicam were accurately weighed, transferred to a 100 ml volumetric flask containing 50 ml water and were allowed to stand to ensure complete solubility of the drug. The mixture was made up to volume with water. The solution was suitably diluted and the absorption was determined by UV –Visible spectrophotometer. The drug concentration was calculated from the calibration curve.
In vitrodrug release studies: Dissolution parameters:
Apparatus -- USP-II, Paddle Method
Dissolution Medium -- 0.1 N HCl , p H 6.8
Phophate buffer RPM -- 50
Sampling intervals (hrs) -- 0.5,1,2,3,4,5,6,7,8,10,11,12
Temperature -- 37°c + 0.5°c
As the preparation was for floating drug release given through oral route of administration, different receptors fluids are used for evaluation the dissolution profile.
Procedure:
Hareesh Dara et al., J. Sci. Res. Phar. 2015, 4(1), 12-18
phosphate buffer was added process was continued from upto 12hrs at 50 rpm. At definite time intervals of 5 ml of the receptors fluid was withdrawn, filtered and again 5ml receptor fluid was replaced. Suitable dilutions were done with receptor fluid and analyzed by spectrophotometrically at 298 nm using UV-spectrophotometer.
Application of Release Rate Kinetics to Dissolution Data:
Various models were tested for explaining the kinetics of drug release. To analyze the mechanism of the drug release rate kinetics of the dosage form, the obtained data were fitted into zero-order, first zero-order, Higuchi, and Korsmeyer-Peppas release model.
Zero order release rate kinetics:
To study the zero–order release kinetics the release rate data ar e fitted to the following equation.
F = Kot
Where, ‘F’ is the drug release at time‘t’, and ‘Ko’ is the zero order
release rate constant. The plot of % drug release versus time is linear.
First order release rate kinetics:The release rate data are fitted to the following equation
Log (100-F) = kt
A plot of log cumulative percent of drug remaining to be released vs. time is plotted then it gives first order release.
Higuchi release model:To study the Higuchi release kinetics, the release rate data were fitted to the following equation.
F = k t1/2
Where, ‘k’ is the Higuchi constant.
In higuchi model, a plot of % drug release versus square root of time is linear.
Korsmeyer and Peppas release model:
The mechanism of drug release was evaluated by plotting the log percentage of drug released versus log time according to Korsmeyer- Peppas equation. The exponent ‘n’ indicates the mechanism of drug release calculated through the slope of the straight Line.
Mt/ M∞= K tn
Where, Mt/ M∞is fraction of drug released at time ‘t’, k
represents a constant, and ‘n’ is the diffusional exponent, which characterizes the type of release mechanism during the dissolution process.For non-Fickian release, the value of n falls between 0.5 and 1.0; while in case of Fickian diffusion, n = 0.5; for zero-order release (case I I transport), n=1; and for supercase II transport, n > 1.In this model, a plot of log (Mt/ M∞) versus log (time) is linear.
Hixson-Crowell release model:
(100-Qt)1/3= 1001/3– KHC.t
Where, k is the Hixson-Crowell rate constant.
Hixson-Crowell model describes the release of drugs from an insoluble matrix through mainly erosion. (Where there is a change in surface area and diameter of particles or tablets).
RESULTS & DISCUSSION
Pre-Formulation studies:
Calibration curves of Azilsartan in different media:
Standard graph of Azilsartan in different media was plotted by taking concentration ranging from 5 to 40µg/ml.
Calibration of Azilsartan in PBS pH 6.8:
Standard graph of Azilsartan in PBS pH 6.8 was plotted by taking concentration ranging from 5 to 40µg/ml. The absorbance values for their respective concentration were shown in Table and the standard graph was shown in Figure.
The present study was aimed to developing extended release tablets of Azilsartan Medoximil using various polymers. All
the formulations were evaluated for physicochemical properties and invitro drug release studies.
Analytical Method:
Graphs of Azilsartan Medoximil was taken in Simulated Gastric fluid (pH 1.2) and in p H 6.8 phosphate buffer at 298 nm and 294 nm respectively.
Table No. 3: Observations for graph of Azilsartan Medoximil in 0.1N HCl (298nm)
Conc [µg/l] Abs
5 0.104
10 0.205
15 0.302
20 0.411
25 0.503
30 0.608
35 0.710
40 0.808
Fig. 1: Standard graph of Azilsartan Medoximil in 0.1N HCl
Table No. 4: Observations for graph of Azilsartan Medoximil in p H 6.8 phosphate buffer (294nm)
Conc [µg/l] Abs
5 0.098
10 0.195
15 0.298
20 0.392
25 0.490
30 0.595
35 0.690
40 0.776
Hareesh Dara et al., J. Sci. Res. Phar. 2015, 4(1), 12-18
Drug – Excipient compatability studies: Fourier Transform-Infrared Spectroscopy:
Fig. 3: FT-TR Spectrum of Azilsartan Medoximil pure drug
Fig. 4: FT-IR Spectrum of Azilsartan+Methocel K100LV M
Fig. 5: FT-IR Spectrum of Azilsartan+Ethocel 7FP
Fig. 6: FT-IR Spectrum of Azilsartan+ CMEC
Evaluation of Powders:
Pre-Formulation parameters of powder blend:
Table No. 5: Pre-formulation parameters of Core blend
Formulation
Code Angle of Repose Bulk density(gm/ml) Tapped density(gm/ml) Carr’s index(%) Hausner’s Ratio
F1 25.11 0.49±0.04 0.54±0.04 16.21±0.06 0.86±0.06
F2 25.67 0.52±0.09 0.52±0.04 16.87±0.05 0.98±0.05
F3 25.54 0.50±0.05 0.58±0.05 17.11±0.01 0.64±0.03
Hareesh Dara et al., J. Sci. Res. Phar. 2015, 4(1), 12-18
F5 25.34 0.52±0.03 0.57±0.03 16.92±0.04 1.2±0.08
F6 24.22 0.53±0.04 0.56±0.06 17.65±0.09 1.06±0.09
F7 25.18 0.54±0.06 0.59±0.04 16.43±0.05 0.76±0.03
F8 24.22 0.58±0.04 0.67±0.02 17.97±0.02 1.15±0.09
F9 25.05 0.55±0.08 0.5 2±0.03 17.54±0.09 1.17±0.02
Tablet powder blend was subjected to various pre-formulation parameters. The angle of repose values indicates that the powder blend has good flow properties. The bulk density of all the formulations was found to be in the range of 0.43±0.07 to 0.58±0.06 (gm/cm3) showing that the powder has good flow properties. The tapped density of all the formulations was found to be in the range of 0.57 to 0.69 showing the powder has good flow properties. The compressibility index of all the formulations was found to be ranging between 16 to 18 which shows that the
powder has good flow properties. All the formulations has shown the hausner ratio ranging between 0 to 1.2 indicating the powder has good flow properties.
Quality Control Parameters For tablets:
Tablet quality control tests such as weight variation, hardness, and friability, thickness, and drug release studies in different media were performed on the compression coated tablet.
Table No. 6: Invitro quality control parameters for tablets
Formulation
codes variation(mg)Weight Hardness(kg/cm2) Friability(%loss) Thickness(mm) content (%)Drug
F1 312.5 4.5 0.50 6.8 99.76
F2 305.4 4.5 0.51 6.9 99.45
F3 298.6 4.4 0.51 4.9 99.34
F4 310.6 4.5 0.55 6.9 99.87
F5 309.4 4.4 0.56 6.7 99.14
F6 310.7 4.5 0.45 6.5 98.56
F7 302.3 4.1 0.51 6.4 98.42
F8 301.2 4.3 0.49 6.7 99.65
F9 298.3 4.5 0.55 6.6 99.12
All the parameters such as weight variation, friability, hardness, thickness and drug content were found to be within limits.
In-VitroDrug Release Studies:
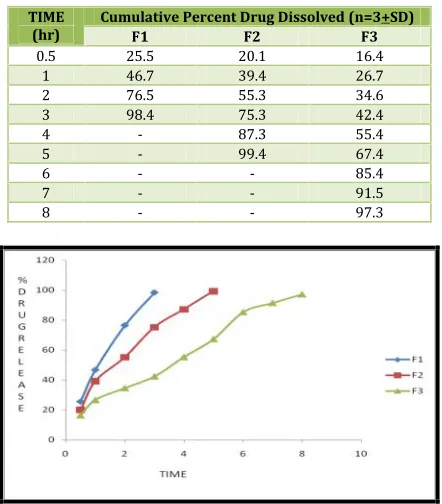
Table No. 7: Dissolution Data of Azilsartan Medoximil Tablets Prepared With CMEC In Different Concentrations
TIME
(hr) Cumulative Percent Drug Dissolved (n=3+SD)F1 F2 F3
0.5 25.5 20.1 16.4
1 46.7 39.4 26.7
2 76.5 55.3 34.6
3 98.4 75.3 42.4
4 - 87.3 55.4
5 - 99.4 67.4
6 - - 85.4
7 - - 91.5
8 - - 97.3
Fig 7: Dissolution profile of Azilsartan Medoximil (F1, F2, F3 formulations)
Table No. 8: Dissolution Data of Azilsartan Medoximil Tablets Prepared With ETHOCEL 7F P In Different Concentrations
TIME
(hr) Cumulative Percent Drug Dissolved (n=3+SD)F4 F5 F6
0.5 17.25 16.42 14.62
1 38.26 25.73 19.86
2 54.16 36.63 22.35
3 72.01 45.04 31.45
4 88.26 58.25 39.80
5 97.10 65.33 45.25
6 - 76.41 58.24
7 - 84.84 66.73
8 - 97.80 71.34
9 - - 75.52
10 - - 82.17
11 - - 87.10
12 - - 96.10
Fig 8: Dissolution profile of Azilsartan Medoximil (F4, F5, F6 formulations)
Table No. 9: Dissolution Data of Azilsartan Medoximil Tablets Prepared With METHOCEL K100LV CR In Different
Concentrations
TIME
(hr) Cumulative Percent Drug Dissolved (n=3+SD)F7 F8 F9
0.5 10.4 9.4 8.5
1 16.5 15.6 14.5
2 28.6 21.4 18.4
3 39.5 36.7 23.4
4 48.5 42.4 28.2
5 59.4 49.6 34.8
6 69.2 55.3 40.2
7 74.5 60.3 44.8
8 82.3 72.8 50.4
9 87.78 83.52 63.34
10 98.78 88.65 69.27
11 - 96.56 74.86
Hareesh Dara et al., J. Sci. Res. Phar. 2015, 4(1), 12-18
Fig 9: Dissolution profile of Azilsartan Medoximil (F7, F8, F9 formulations)
Application of Release Rate Kinetics to Dissolution Data:
Various models were tested for explaining the kinetics of drug release. To analyze the mechanism of the drug release rate kinetics of the dosage form, the obtained data were fitted into zero-order, first zero-order, Higuchi, and Korsmeyer-Peppas release model.
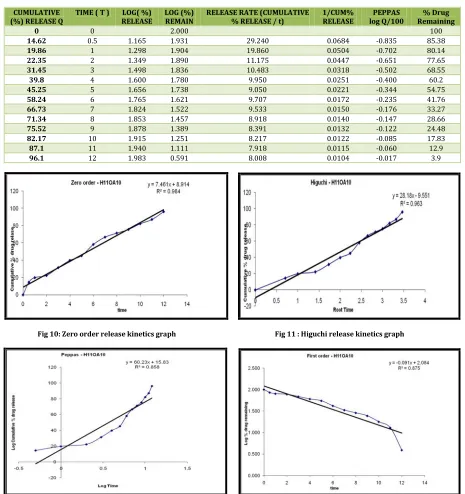
Table No. 10: Release kinetics data for optimised formulation
CUMULATIVE
(%) RELEASE Q TIME ( T ) RELEASELOG( %) LOG (%)REMAIN RELEASE RATE (CUMULATIVE% RELEASE / t) 1/CUM%RELEASE log Q/100PEPPAS Remaining% Drug
0 0 2.000 100
14.62 0.5 1.165 1.931 29.240 0.0684 -0.835 85.38
19.86 1 1.298 1.904 19.860 0.0504 -0.702 80.14
22.35 2 1.349 1.890 11.175 0.0447 -0.651 77.65
31.45 3 1.498 1.836 10.483 0.0318 -0.502 68.55
39.8 4 1.600 1.780 9.950 0.0251 -0.400 60.2
45.25 5 1.656 1.738 9.050 0.0221 -0.344 54.75
58.24 6 1.765 1.621 9.707 0.0172 -0.235 41.76
66.73 7 1.824 1.522 9.533 0.0150 -0.176 33.27
71.34 8 1.853 1.457 8.918 0.0140 -0.147 28.66
75.52 9 1.878 1.389 8.391 0.0132 -0.122 24.48
82.17 10 1.915 1.251 8.217 0.0122 -0.085 17.83
87.1 11 1.940 1.111 7.918 0.0115 -0.060 12.9
96.1 12 1.983 0.591 8.008 0.0104 -0.017 3.9
Fig 10: Zero order release kinetics graph Fig 11 : Higuchi release kinetics graph
Hareesh Dara et al., J. Sci. Res. Phar. 2015, 4(1), 12-18
DSC Studies:
Differential scanning colorimetry studies were carried out to determine the compatibility between drug and excipients in optimized formulation. From the studies it was evident that there were no prominent change in the melting point of pure drug alone and its melting point when it was combined with other excipients in optimized formulation.
Fig. 14: DSC of pure drug
Fig. 15: DSC of Optimised Azilsartan foemulation
CONCLUSION
T
he aim of the present study was to develop an controlled release formulation of Azisartan to maintain constanttherapeutic levels of the drug for over 12 hrs. Various grades of HPMC were employed as polymers. Azisartan dose was fixed as 40 mg. Total weight of the tablet was considered as 150 mg. Polymers were used in the concentration of 60,120 and 180mg concentration. All the formulations were passed various physicochemical evaluation parameters and they were found to be within limits.
From the dissolution data it was evident that the formulations prepared with CMEC as polymer were unable to retard the drug release up to desired time period i.e., 12 hours.
Whereas the formulations prepared with ETHOCEL 7F P retarded the drug release in the concentration of 180 mg showed required release pattern i.e., retarded the drug release up to 12 hours and showed maximum of 96.10% in 12 hours with good retardation.
The formulations prepared with METHOCEL K100LV showed more retardation even after 12 hours they were not shown total drug release. Hence they were not considered.
REFFERENCES:
1. Agis Kydonieus, Treatise on controlled drug delivery Marcel Dekker, Inc. NewYork, 70, 199-203
2. Aithal KS. And Udupa N. Controlled Fluoride Release Tablets using MethylCellulose and Hydroxy Propyl Methyl Cellulose, The Indian Drugs,1994; 31(7): 298-301. 3. American Society of Health System Pharmacist,
Bethesda, Maryland and Spring House Corporation, Spring House, Pennsylvania, 638-640.
4. Anna Viridén, Bengt Wittgren, Anette Larsson. Investigation of critical polymer properties for polymer release and swelling of HPMC matrix tablets. European journal of pharmaceutical sciences,2009; 36: 297-309.
5. Bankers GS and Rhodes CT. Modern Pharmaceutics (3rd
Edn.), Marcel Dekker, New York,1995; 575.
6. Lachman Leon, Liberaman HA, and Kanig JL. The Theory and practice of Industrial Pharmacy (3rdEdn), Varghese
Publishing House Bombay, 430.
7. Brahmankar DM, Karwa RM, Jaiswal SB. Cellulose matrix for controlled release of Ketorolac tromethamine, Indian Drugs,1996; 33(3): 120-123.
8. Lachman Leon and Liberaman HA. Pharmaceutical Dosage Forms Tablets,Marcel Dekker Inc., New York N.Y.,
1980; 2: 246.
9. Lachman Leon, Liberaman HA and Kanig JL. The Theory and practice of Industrial Pharmacy, (3rd Edn), Varghese
Publishing House Bombay, 296-302.
How to cite this article:
Hareesh Dara, Narasimha Reddy Yellu: Controlled Release Drug Delivery System of Azilsartan Medoximil for the Treatment of Hypertension, J. Sci. Res. Phar., 2015; 4(1): 12-18.
Conflict of interest:The authors have declared that no conflict of interest exists.