R E S E A R C H
Open Access
Using classification assignment rules to
assess land-use change impacts on forest
biodiversity at local-to-national scales
Kathrin Affeld
1,2, Susan K. Wiser
1*, Ian J. Payton
1and Miquel DeCáceres
3Abstract
Background:Ecosystem representation is one key component in assessing the biodiversity impacts of land-use changes that will irrevocably alter natural ecosystems. We show how detailed vegetation plot data can be used to assess the potential impact of inundation by a proposed hydroelectricity dam in the Mokihinui gorge, New Zealand, on representation of natural forests. Specifically we ask: 1) How well are the types of forest represented locally, regionally, and nationally; and 2) How does the number of distinct communities (i.e. beta diversity) in the target catchment compare with other catchments nationally?
Methods:For local and regional comparisons plant species composition was recorded on 45 objectively located 400 m2 vegetation plots established in each of three gorges, with one being the proposed inundation area of the Mokihinui lower gorge. The fuzzy classification framework of noise clustering was used to assign these plots to a specific alliance and association of a pre-existing national-scale classification. Nationally, we examined the relationship between the number of alliances and associations in a catchment and either catchment size or the number of plots per catchment by fitting Generalised Additive Models.
Results:The four alliances and five associations that were observed in the Mokihinui lower gorge arepresent in the region but limited locally. One association was narrowly distributed nationally, but is the mostfrequent association in the Mokihinui lower gorge; inundation may have consequences of national importance to its long-term
persistence. That the Mokihinui lower gorge area had nearly twice as many plots that could not be assigned to pre-existing alliances and associations than either the Mokihinui upper or the Karamea lower gorges and proportionally more than the national dataset emphasises the compositional distinctiveness of this gorge. These outlier plots in the Mokihinui lower gorge may be unsorted assemblages of species or reflect sampling bias or that native-dominated woody riparian vegetation is rare on the landscape. At a national scale, the Mokihinui catchment has a higher diversity of forest alliances and associations (i.e. beta-diversity) than predicted based on catchment size and sampling intensity.
Conclusions:Our analytical approach demonstrates one transparent solution to a common conservation planning problem: assessing how well ecosystems that will be destroyed by a proposed land-use change are represented using a multi-scale spatial and compositional framework. We provide a useful tool for assessing potential consequences of land-use change that can help guide decision making.
Keywords:Beta-diversity, Biodiversity conservation, Environmental impacts, Ecosystem representation, Hydroelectricity dams, Land-use change, National vegetation classification, Noise clustering, New Zealand NVS databank, Plant
community composition
* Correspondence:[email protected]
1Manaaki Whenua - Landcare Research, PO Box 69040, Lincoln 7640, New Zealand
Full list of author information is available at the end of the article
Background
Foundational principles for biodiversity conservation are that i) viable populations of native species are maintained; ii) ecological and evolutionary processes are sustained; iii) conservation networks are resilient to environmental change; and iv) ecosystems are represented across their natural range of variation (Noss and Cooperrider 1994). Ecosystem representation, in combination with criteria to satisfy the other goals, such as distributions of threatened species, is a key component of prioritising sites for conser-vation (Austin and Margules 1986; DeVelice et al. 1988; Scott et al. 1993). Such representation can also provide the context for assessing the biodiversity impacts of a land-use change that will irrevocably alter natural ecosys-tems (Noss 1990; Crist et al. 2000; Monavari and Momen Bellah Fard 2010), a problem to which it is less commonly applied in the scientific literature. Our paper focusses on this general problem by introducing a scale-based frame-work and quantitative approach to assessing the impacts of potential inundation by a proposed hydroelectricity dam on representation of natural forests.
As ecosystems are challenging to fully characterise, vegetation types are commonly used as surrogates, albeit with caution (Groves et al. 2002; Margules et al. 2002; Bonn and Gaston 2005). Vegetation types provide infor-mation on habitats that are utilised by species other than plants, are often linked to specific characteristics of the physical environment and depict more ecological com-plexity than individual taxa (Scott et al. 1993; Margules et al. 2002). Others have argued that vegetation types themselves should be a key conservation unit (Hortal and Lobo 2006; Keith 2009). Ecosystem representation is often assessed by employing spatial (GIS)-based analyses using maps of vegetation types as a key layer (e.g. Scott et al. 1993; Jennings 2000; Margules et al. 2002). The United States national gap analysis program, which seeks to understand how well the biota of the US is protected, recommends that mapping to assess representation should be undertaken at the vegetation alliance level (Jennings 2000). Alliances are a level of compositional variation in the hierarchy of the US vegetation classifica-tion standard that signify a characteristic range of species composition, habitat conditions, physiognomy, and diag-nostic species reflecting regional to sub-regional environ-mental variation. An alliance consists of one or more associations. In many locations, especially outside the United States and Europe, however, regional or national-scale vegetation maps may be restricted to coarse typolo-gies and broad mapping resolutions (Groves et al. 2002). New Zealand, for example, has national-scale maps of land cover derived from satellite imagery (Land Cover Database; Thompson et al. 2004) and vegetative cover maps (Newsome 1987), but these maps have insufficient thematic resolution to assess ecosystem representation.
Inferences from available vegetation maps may be lim-ited by mapping errors at finer spatial scales, especially when maps do not capture small and isolated pockets of threatened habitats and their associated species (Scott et al. 1993; Groves et al. 2002). These pockets are often the actual target of conservation efforts, particularly in frag-mented and heterogeneous landscapes (Stohlgren et al. 1997; Williams et al. 2007). Conversely, data collected exclusively at the finest spatial scales will be inadequate to provide the broad-scale context required to assess representation (Scott et al. 1993). In New Zealand, rep-resentativeness and the related property of community distinctiveness (i.e. an assemblage of species is rare, en-demic or reaches its distributional limit in the target area) are criteria used to evaluate ecosystem significance for assessment of environmental impacts (O'Connor et al. 1990). Given the absence of high-resolution national-scale vegetation maps, however, evaluations of these criteria are typically qualitative.
An alternative to using vegetation maps for assessing ecosystem representation is based on point data sam-pling of vegetation across a wide range of spatial scales. The option of using point data is becoming increasingly tractable as many parts of the world accumulate large quantities of vegetation composition data from sample plots (e.g. Dengler et al. 2011). Such data not only allow a quantitative depiction of vegetation types but also pro-vide detailed information about the structure and abun-dance of component species. Our paper develops a quantitative means of synthesising vegetation plot data, at different spatial scales and levels of compositional resolution, to assess ecosystem representativeness.
plots to ensure coverage of dominant forest and shrub-land ecosystems; and 3) has been extended by use of a large historical plot dataset to provide coverage of rare woody vegetation alliances. However, maps of this classi-fication system have not yet been produced. We use a novel analytical approach to apply this classification sys-tem to assess local, regional, and national representative-ness of forest alliances and associations that will potentially be flooded by the proposed inundation. To address local and regional representativeness, respect-ively we ask i) are forest alliances and associations in the inundation zone present elsewhere in the Mokihinui catchment; and ii) are forest alliances and associations in the inundation zone present in a similar catchment nearby? The plot data also allowed us to compare floris-tics, specifically species richness and the presence of both threatened and exotic species on plots at these scales. To address national-scale representation we ask iii) are any of the forest alliances or associations in the inundation zone confined to the region; iv) are there species assemblages in the inundation zone that are not currently defined as alliances or associations in the na-tional classification; and v) how does the number of dis-tinct forest alliances and associations (i.e. beta diversity) in the Mokihinui catchment compare to all other catch-ments nationally? Given the high geologic, topographic complexity and biogeographic history of the region, we expect beta diversity to be high.
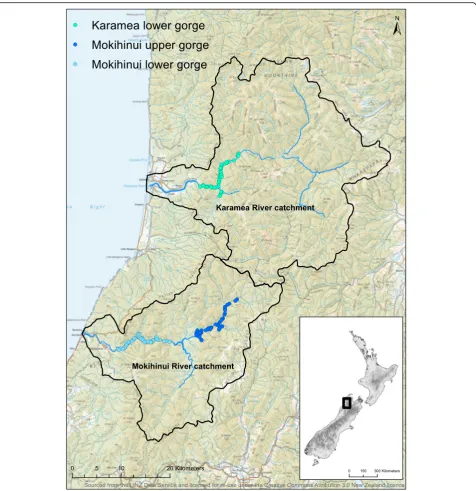
Methods Study area
The Mokihinui catchment is located on the west coast of New Zealand’s South Island and covers ~ 75,000 ha (Fig. 1). About 35 km to the north is the nearby Karamea catchment covering ~ 124,000 ha (Fig. 1). Each catchment derives its name from its main river, which extends from a large inland basin through steep-sided gorges and lowland valleys before reaching floodplains near the river mouth and the Tasman Sea. As is the case for 80% of New Zealand’s indigenous forests, the study catchments are found on lands primarily managed for conservation, although the status of the Mokihinui catchment as ‘stewardship land’means its protection in perpetuity is not
guaranteed (Parliamentary Commissioner for the
Environment 2013). Geologically, the catchments are pre-dominantly greywacke interspersed with granite and smaller patches of limestone, mudstone and sandstone. Small colluvial fans and alluvial terraces are found along sections of both rivers. As a result of the steep topography, past earthquakes, and high rainfall, mass movements are common (Nathan et al. 2002). The climate of the study area is relatively mild, with mean temperatures of 9.2° in winter and 16.2° in summer (Macara 2016). Annual rain-fall is about 2200 mm spread evenly throughout the year,
although heavy rain events are common. The study catchments are densely forested and little of the area has been cleared or logged. These forests comprise a
mix of podocarp species including Dacrydium
cupressinum and Prumnopitys ferruginea, broadleaved
species such as Weinmannia racemosa, Quintinia
acutifolia, Myrsine salicifolia, and Coprosma spp., southern beech species such as Lophozonia menziesii and Fuscospora fusca and tree fern species including
Cyathea smithii and Dicksonia squarrosa (Mitchell Partnerships 2007a, 2007b). The resultant mix of for-est types reflects the geologic and topographic com-plexity of the catchments and the dynamic nature of the landscape. Closer to the rivers, forests are shorter, frequently flooded, and grade into communities domi-nated by herbaceous species, bryophytes and scattered
small shrubs of mainly Coprosma and Carmichaelia
species (Mitchell Partnerships 2007a, 2007b).
Study design
The proposed dam would be located in the lower Mokihinui River and create a 337-ha lake that would extend 14 km upstream through the lower gorge and cover an altitudinal range from 23 to 100 m a.s.l. As a con-sequence, all vegetation below 100 m a.s.l. upstream from the dam would be inundated, including tributaries in the lower catchment. The area sampled by plots in the Mokihinui lower gorge was thus defined as the inundation zone of the proposed dam. To address local and regional representation, respectively, we also sampled a gorge else-where in the Mokihinui catchment and a gorge in the nearby Karamea River catchment. To ensure comparabil-ity with the Mokihinui lower gorge, the other two gorges selected had similar geological and topographic charac-teristics and were no higher than 400 m a.s.l. The gorge elsewhere in the Mokihinui catchment was upstream of the proposed inundation zone and is hereafter referred to as the Mokihinui upper gorge (Fig. 1). This gorge was selected to determine whether the vegetation of the Mokihinui lower gorge was replicated locally. The gorge in the lower Karamea catchment (Fig. 1) was selected to determine whether the vegetation of the Mokihinui lower gorge was replicated at the regional scale.
along a 14-km stretch of river, based on the length of river that would be affected by the proposed dam in the Mokihinui lower gorge. The area sampled by plots in the other two topographic strata in the Mokihinui upper gorge and the Karamea lower gorge were defined by constructing a virtual dam at the entrance to each gorge, and adjusting the height of the dam so that the area of high slope vegetation modelled to be inundated was the same as that for the lower gorge. The area of low slope vegetation modelled to be inundated was
then adjusted to match that of the Mokihinui lower gorge by adding low slope area below the virtual dam location (Mokihinui upper gorge) and at the head of the virtual lake (Karamea lower gorge). This ensured an equal sampling intensity in each of the three gorges.
Data collection
Local and regional comparison
Vegetation plots (20 m × 20 m) were established at 15 randomly located points within each of the topographic
strata (riparian, low slope, high slope), giving 45 plots in each gorge. These random points were plotted on maps produced from the spatial modelling described above to direct field sampling. Where locations for riparian plots fell in the riverbed, these were allocated to the north or south bank using a coin toss. Riparian plots were estab-lished parallel to the river at the point where field teams first encountered vascular plants. Low and high slope plots were positioned so that the lower boundary followed the contour of the slope, following Hurst and Allen (2007). All vascular plant species were recorded within each plot and their percentage cover recorded in seven tiers (0–30 cm height, >30 cm–2 m, >2–5 m, >5– 12 m, >12–25 m, >25 m, and as an epiphyte). Cover-abundance was estimated in each height tier using a modified Braun-Blanquet scale (1 = <1%, 2 = 1%–5%, 3 = 6%–25%, 4 = 26%–50%, 5 = 51%–75%, 6 = 76%–100%; methods follow (Hurst and Allen 2007)).
Selected voucher specimens for species are deposited in the Allan Herbarium (CHR). Nomenclature follows NgāTipu o Aotearoa –New Zealand Plants (2011). All data are archived in the NVS databank.
National comparison
The first stage of developing a national classification used a representative dataset of 1177 indigenous forest and shrubland plots established (2002–2007) on inter-sections of an 8 km × 8 km-grid superimposed on the areas mapped as shrubland or indigenous forest by the New Zealand Land Cover Database version 1, based on 1996/97 SPOT satellite imagery. The plots supporting the national classification used the same field protocols as the plots sampling the gorges. In order to classify the national plot data into alliances and associations, a cumulative cover value was calculated for each species on each plot. Cover scores within each height tier were converted to the midpoint of the percentage cover range for that cover abundance class and summed across tiers (Wiser et al. 2011). This procedure generated an importance value reflecting the volume occupied by each species rather than its projected cover. Resemblance between plots was de-fined using the Chord distance (Orlóci 1967). The Chord distance calculates Euclidean distance after relativizing species abundance on a plot by the total abundance of all species on the plot, thus decreasing the impact of plot richness on the abundance value. These data were classi-fied into 24 vegetation alliances (Wiser et al. 2011). In the second stage, an additional 12,374 vegetation plots col-lected with comparable methods sourced from the NVS databank were incorporated into this classification to both define spatially rare alliances (five new alliances were de-fined) to characterise types at a finer level of compos-itional resolution (i.e. 79 associations) (Wiser and De Cáceres 2013). Names for alliances and associations follow
the convention of the International Vegetation Classifica-tion (Grossman et al. 1998). In the text that follows we refer to alliances using the minimum number of species names in the full alliance name that distinguish alliances from each other. We refer to associations using their full names as these are required to distinguish associations from each other. Codes associated with each name reflect the relative importance of southern beech, podocarp, and broadleaved tree species in the canopies. Areal extent of each alliance or association was calculated based on the proportion of the plots sampled on intersections of the 8 km × 8 km grid assigned to each alliance or association of the total 1177 plots relative to the total forest and shrubland area of 8.9 million ha mapped by the Land Cover Database version 1.
Data analysis
Assigning the Mokihinui and Karamea plots to the national plot-based classification
plots (three from the Mokihinui upper gorge and two from the Karamea lower gorge) were excluded from this analysis, because each had a total woody species cover of <20%, and so did not match the scope of the national-scale classification, with its focus on forests and shrub-lands (Wiser and De Cáceres 2013).
Comparison of other floristic attributes at local and regional species scales
To assess how well species from the lower Mokihinui gorge are represented in the upper Mokihinui gorge (local comparison) and Karamea lower gorge (regional comparison), the total species richness and the species richness of the three topographic strata for each gorge as well as species threat status and whether species were introduced or indigenous were determined. Biostatus (e.g. exotic or indigenous) and threat status (following de Lange et al. 2009) were sourced from Ngā Tipu o Aotearoa – New Zealand Plants (2011).
Beta-diversity of the Mokihinui catchment compared with catchments nationally
Assigning plots that sampled the Mokihinui gorges and the Karamea gorge to a national classification of plots not only allowed us to answer questions about shared and dis-tinctive alliances and associations at local (Question i), regional (Question ii) and national (Questions iii and iv) scales, but also whether the combination of alliances and associations (i.e. beta-diversity or the species turnover between sites) recorded from the entire Mokihinui catch-ment (both from the current study and historically) was represented in other catchments in New Zealand (Question v). This required the alliance and association identities and spatial location of each of the 13,551 NVS plots to be uploaded into an ArcGIS 10 (ESRI™) as an event theme. Each sample point (plot) was then assigned to a mapped catchment using the River Environment Classification (REC) dataset made available by the NZ Ministry for the Environment (Snelder et al. 2010). Catch-ment size for each of the 260 catchCatch-ments sampled by these vegetation plots was computed using ArcGIS. By in-cluding additional plot records from the NVS databank, we were able to add 179 pre-existing plot records to the dataset of 87 forest plots from the Mokihinui gorge col-lected for the current study. This enabled us to more comprehensively assess the heterogeneity in forest vegeta-tion across the entire Mokihinui catchment in relavegeta-tion to catchments nationally. We examined the relationship be-tween the number of alliances and associations in a catch-ment and either catchcatch-ment size or the number of plots per catchment by fitting Generalised Additive Models using the R package mgcv (Wood 2017). The response was modelled using a Poisson distribution and cubic re-gression splines.
Results
Representation of forest alliances and associations at the local scale
Across the Mokihinui lower and upper gorges a total of eight alliances defined by the national classification were observed (Table 1, Fig. 2a). Of these, two alliances,
Melicytus ramiflorus–Cyathea smithii forest (A: BlPF2) and Cyathea dealbata–Melicytus ramiflorus forest (A: BlPF4), were only recorded in the Mokihinui lower gorge but were uncommon (Fig. 2a). Four alliances,
Lophozonia menziesii–Weinmannia racemosaforest (A: BBlF3), Pseudowintera colorata–Griselinia littoralis
forest (A: BBlPF2), Fuscospora truncata–Weinmannia racemosa forest (A: BF6), andPseudowintera colorata– Fuchsia excorticata (A: BlPF5), were only found in the
Mokihinui upper gorge. Two alliances, Weinmannia
racemosa–Cyathea smithii forest (A: BBlPF3) and
Weinmannia racemosa–Prumnopitys ferruginea forest (A: BlPF1), were present in both the Mokihinui lower
and upper gorges; notably these were the two
alliances that had both podocarp species and
Weinmannia racemosa as dominants (Table 1). The most common alliance in the Mokihinui lower gorge was
Weinmannia racemosa–Cyathea smithii forest (A: BBlPF3; 56% of plots) and in the Mokihinui upper gorge was Lophozonia menziesii–Weinmannia racemosa forest (A: BBlF3; 45% of plots).
At the finer (i.e. association) level of compositional resolution the Mokihinui lower gorge was more dissimilar from the Mokihinui upper gorge, with only
one of 13 associations shared – the Weinmannia
racemosa–Fuscospora fusca (Fuscospora menziesii) /Griselinia littoralis/Blechnum discolor–Grammitis billardierei forest (a: BBlPF4; Table 2, Fig. 2b). Four associations were restricted to the Mokihinui lower gorge and eight were restricted to the Mokihinui upper gorge (Table 2). The most common association
in the Mokihinui lower gorge was the Weinmannia
racemosa–Hedycarya arborea (Melicytus ramiflorus) /Dicksonia squarrosa–Freycinetia banksii–Ripogonum scandens forest (a: BlPF15; 29% of plots sampled). In the Mokihinui upper gorge the Weinmannia racemosa– Fus-cospora fusca (Lophozonia menziesii)/Griselinia littoralis/ Blechnum discolor–Grammitis billardierei forest was the most common association (a: BBlPF4, 38% of plots sampled).
Representation of forest alliances and associations at the regional scale
plots), similar to its high frequency in the Mokihinui lower gorge. One alliance, the Cyathea dealbata–Melicytus ramiflorus forest (A: BlPF4), was only recorded from the Mokihinui lower gorge, where it was uncommon. Three al-liances, Lophozonia menziesii–Weinmannia racemosa
forest (A: BBlF3), Fuscospora truncata–Weinmannia racemosa forest (A: BF6), and Beilschmiedia tawa – Weinmannia racemosa forest (A: BlPF3), were present in the Karamea lower gorge but absent from the Mokihinui lower gorge. Three alliances, Weinmannia racemosa– Cyathea smithiiforest (A: BBlPF3),Weinmannia racemosa– Prumnopitys ferruginea forest (A: BlPF1), and Melicytus ramiflorus–Cyathea smithii forest (A: BlPF2), were present in both Mokihinui and Karamea lower gorges (Table 1).
In contrast to the local-scale comparison, at the finer level of compositional resolution there was considerable overlap in the Mokihinui and Karamea lower gorges: five of the seven associations present occurred in both gorges (Table 2, Fig. 3b). Of these, the most frequent
association in the two gorges was the Weinmannia
racemosa–Hedycarya arborea (Melicytus ramiflorus)/ Dicksonia squarrosa–Freycinetia banksii–Ripogonum scandens forest (a: BlPF15), comprising 29% and 40% of the sampled plots in the Mokihinui and Karamea lower gorges, respectively. All associations in the Mokihinui lower gorge occurred in the Karamea lower gorge. Two
associations were present in the Karamea lower gorge, but absent from the Mokihinui lower gorge. The propor-tion of plots designated as outliers was higher in the Mokihinui lower gorge than in the Karamea lower gorge (38% versus 14%, respectively).
Comparison of other floristic attributes at local and regional species scales
In total, 373 vascular plant species were recorded across the three gorges, of which 53 were exotic. Plant species richness in the Mokihinui lower gorge (268 species) was nearly identical to that of the Mokihinui upper gorge (269 species), but lower than in the Karamea lower gorge (308 species). The Mokihinui lower gorge shared a higher proportion of its species with the Karamea lower gorge (82%) than with the Mokihinui upper gorge (75%). In the Mokihinui lower and upper gorges, the total number of species observed in riparian plots (297) was substantially higher than observed across low (190) or high (181) slope plots.
None of the indigenous plant species found in the plots in the Mokihinui lower gorge are listed as threatened (nationally critical, nationally endangered or nationally vulnerable) by the New Zealand Threat Classification sys-tem (de Lange et al. 2009; Townsend et al. 2008).
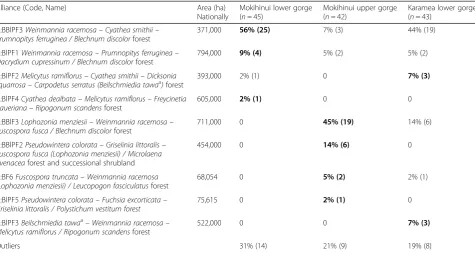
Table 1The proportion (and number) of forest plots from three river gorges assigned to different vegetation alliances
Alliance (Code, Name) Area (ha)
Nationally
Mokihinui lower gorge (n= 45)
Mokihinui upper gorge (n= 42)
Karamea lower gorge (n= 43)
A:BBlPF3Weinmannia racemosa–Cyathea smithii– Prumnopitys ferruginea / Blechnum discolorforest
371,000 56% (25) 7% (3) 44% (19)
A:BlPF1Weinmannia racemosa–Prumnopitys ferruginea– Dacrydium cupressinum / Blechnum discolorforest
794,000 9% (4) 5% (2) 5% (2)
A:BlPF2Melicytus ramiflorus–Cyathea smithii–Dicksonia squarrosa–Carpodetus serratus (Beilschmiedia tawaa)forest
393,000 2% (1) 0 7% (3)
A:BlPF4Cyathea dealbata–Melicytus ramiflorus–Freycinetia baueriana–Ripogonum scandensforest
605,000 2% (1) 0 0
A:BBlF3Lophozonia menziesii–Weinmannia racemosa– Fuscospora fusca / Blechnum discolorforest
711,000 0 45% (19) 14% (6)
A:BBlPF2Pseudowintera colorata–Griselinia littoralis– Fuscospora fusca (Lophozonia menziesii) / Microlaena avenaceaforest and successional shrubland
454,000 0 14% (6) 0
A:BF6Fuscospora truncata–Weinmannia racemosa (Lophozonia menziesii) / Leucopogon fasciculatusforest
68,054 0 5% (2) 2% (1)
A:BlPF5Pseudowintera colorata–Fuchsia excorticata– Griselinia littoralis / Polystichum vestitum forest
75,615 0 2% (1) 0
A:BlPF3Beilschmiedia tawaa–Weinmannia racemosa– Melicytus ramiflorus / Ripogonum scandensforest
522,000 0 0 7% (3)
Outliers 31% (14) 21% (9) 19% (8)
Vegetation alliances are as defined by Wiser et al. (2011) and Wiser and De Cáceres (2013). The value for the gorge where the alliance was most frequent is indicated in bold. Alliances are ordered by descending frequency in the Mokihinui lower gorge, Mokihinui upper gorge, and Karamea lower gorge, respectively. Floristic and environmental details of the alliances can be found in the above citations and athttp://www.landcareresearch.co.nz/publications/factsheets/woody-types. Alliance names follow the convention of the International Vegetation Classification (Grossman et al.1998). Code letters indicate broad structural forest types:
BFbeech forest,BBlFbeach-broadleaved forest,BBlPFbeech-broadleaved-podocarp,BlPFbroadleaved-podocarp forest
a
However, five species were observed, Coprosma acerosa
(shrub),Olearia cheesemannii(shrub),Juncus pauciflorus
(rush), Lindsaea viridis (fern) and Trichomanes colensoi
(fern) that are listed as At Risk, because they are either de-clining or naturally uncommon.
The proportion of the flora that was exotic was very similar between the Mokihinui lower gorge (13%), the Mokihinui upper gorge (12%), and the Karamea lower gorge (13%). In the Mokihinui lower gorge seven of the exotic species are classified as environmental weeds (Howell 2008); of these only Lotus pedunculatus was widespread, but its abundance was low. The highest
proportion of exotic species occurred in riparian com-munities (17.2% ±0.64 (mean ± SE); this proportion de-clined sharply on low slopes (0.7% ±0.64) and exotics were absent from high slope areas. The proportion of exotic species in the individual topographic strata was similar across the three gorges.
Representation of forest alliances and associations at the national scale: are any in the Mokihinui lower gorge confined to the region?
All four alliances present in the Mokihinui lower gorge are widely distributed in NZ, with estimated areal ex-tents ranging from 371,000 to 794,000 ha (Table 1, Fig. 4a). Of these, one (A: BlPF4) has not previously been recorded on the South Island, and two (A: BBlPF3 and A: BlPF2) are near their southern distributional limit in the Mokihinui lower gorge. The remaining alliance (A: BlPF1) occurs on the South Island west and south coasts and Stewart Island; the Mokihinui lower gorge is near the northern limit of its distribution.
One of the five associations observed in the Mokihinui lower gorge (a: BlP15) has an estimated extent of less than 0.5% (15,100 ha) of the NZ forest area, being highly scattered in occurrence (Table 2, Fig. 4b). Given its high frequency in the lower gorges of both Mokihinui and Karamea, this is likely a stronghold of its distribution. Three associations have extents ranging from 0.6% to 1% of the total forest area (37,800–60,500 ha); of these one (a: PF4) is restricted to the South Island West Coast, and the second (a: BBlF3) is even more narrowly restricted, occur-ring primarily near the coast of New Zealand’s north west-ern South Island. The fifth is relatively widespread, with an estimated extent of 173,900 ha.
The presence of nationally unique species assemblages
The proportion of plots designated as outliers at both the alliance or the association level were higher in the Mokihinui lower gorge (31% and 38%, respectively; Fig. 5) than in either the Mokihinui upper gorge (21% and 24%), the Karamea lower gorge (19% and 26%), or nationally (12% and 18%; Wiser and De Cáceres 2013). Most plots designated as outliers were in the riparian zone (93% and 82% in the Mokihinui lower gorge, 100% and 90% in Mokihinui upper gorge, and 88% and 91% in the Karamea lower gorge, at the alliance and association levels, respectively). The riparian outlier plots in the Mokihinui lower gorge alone are clearly distinct from the plots in the Mokihinui lower gorge that were assigned to either an alliance or an association. Riparian outliers are shorter in stature (mean top height = 6.7 m versus 12.3 m in outlier versus assigned plots, respect-ively,p= 0.001 with a t-test), rarely have podocarp trees
in the canopy, and are more species rich (mean species richness =76 versus 55 in outlier versus assigned plots, respectively, p= 0.006 with a t-test). This species rich-ness is manifested in higher numbers of species in the understorey, particularly shrubs, grasses and herbaceous species and also higher richness of exotic species (mean exotic richness =12 versus 2 in outlier versus assigned plots, respectively,p< 0.0001 with a t-test).
Local catchment beta-diversity compared with catchments nationally
Adding the 179 plots from the national dataset to the 90 plots collected in the present study identified an additional 6 alliances and 13 associations in the Mokihinui catchment. The diversity of alliances and associations in the entire Mokihinui catchment is
amongst the highest of the 260 catchments
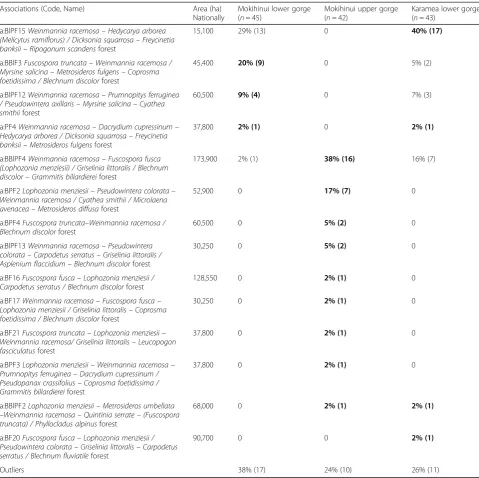
Table 2The proportion (and number) of forest plots from three river gorges assigned to different vegetation associations
Associations (Code, Name) Area (ha)
Nationally
Mokihinui lower gorge (n= 45)
Mokihinui upper gorge (n= 42)
Karamea lower gorge (n= 43)
a:BlPF15Weinmannia racemosa–Hedycarya arborea (Melicytus ramiflorus) / Dicksonia squarrosa–Freycinetia banksii–Ripogonum scandensforest
15,100 29% (13) 0 40% (17)
a:BBlF3Fuscospora truncata–Weinmannia racemosa / Myrsine salicina–Metrosideros fulgens–Coprosma foetidissima / Blechnum discolorforest
45,400 20% (9) 0 5% (2)
a:BlPF12Weinmannia racemosa–Prumnopitys ferruginea / Pseudowintera axillaris–Myrsine salicina–Cyathea smithiiforest
60,500 9% (4) 0 7% (3)
a:PF4Weinmannia racemosa–Dacrydium cupressinum– Hedycarya arborea / Dicksonia squarrosa–Freycinetia banksii–Metrosideros fulgensforest
37,800 2% (1) 0 2% (1)
a:BBlPF4Weinmannia racemosa–Fuscospora fusca (Lophozonia menziesii) / Griselinia littoralis / Blechnum discolor–Grammitis billardiereiforest
173,900 2% (1) 38% (16) 16% (7)
a:BPF2Lophozonia menziesii–Pseudowintera colorata– Weinmannia racemosa / Cyathea smithii / Microlaena avenacea–Metrosideros diffusaforest
52,900 0 17% (7) 0
a:BPF4Fuscospora truncata–Weinmannia racemosa / Blechnum discolorforest
60,500 0 5% (2) 0
a:BlPF13Weinmannia racemosa–Pseudowintera colorata–Carpodetus serratus–Griselinia littoralis / Asplenium flaccidium–Blechnum discolorforest
30,250 0 5% (2) 0
a:BF16Fuscospora fusca–Lophozonia menziesii / Carpodetus serratus / Blechnum discolorforest
128,550 0 2% (1) 0
a:BF17Weinmannia racemosa–Fuscospora fusca– Lophozonia menziesii / Griselinia littoralis–Coprosma foetidissima / Blechnum discolorforest
30,250 0 2% (1) 0
a:BF21Fuscospora truncata–Lophozonia menziesii– Weinmannia racemosa/ Griselinia littoralis–Leucopogon fasciculatusforest
37,800 0 2% (1) 0
a:BPF3Lophozonia menziesii–Weinmannia racemosa– Prumnopitys ferruginea–Dacrydium cupressinum / Pseudopanax crassifolius–Coprosma foetidissima / Grammitis billardiereiforest
37,800 0 2% (1) 0
a:BBlPF2Lophozonia menziesii–Metrosideros umbellata
–Weinmannia racemosa–Quintinia serrate–(Fuscospora truncata) / Phyllocladus alpinusforest
68,000 0 2% (1) 2% (1)
a:BF20Fuscospora fusca–Lophozonia menziesii / Pseudowintera colorata–Griselinia littoralis–Carpodetus serratus / Blechnum fluviatileforest
90,700 0 0 2% (1)
Outliers 38% (17) 24% (10) 26% (11)
Vegetation associations are as defined by Wiser and De Cáceres (2013). The value for the gorge where the association was most frequent is indicated in bold. Associations are ordered by descending frequency in the Mokihinui lower gorge, Mokihinui upper gorge, and Karamea lower gorge, respectively. Floristic and environmental details of the associations can be found in the above citation and athttp://www.landcareresearch.co.nz/publications/factsheets/woody-types. Association names follow the convention of the International Vegetation Classification (Grossman et al.1998). Association codes indicate broad structural forest types
BFbeech forest,BBlFbeach-broadleaved forest,BBlPFbeech-broadleaved-podocarp,BlPFbroadleaved-podocarp forest,BPFbeech-podocarp forest,
supporting woody vegetation in New Zealand (Fig. 6a and b). The total of 14 alliances recorded in the Mokihinui catchment, was nearly four times that of the national average of 4 ± 0.23 alliances per catch-ment. Similarly, the 26 associations recorded in the Mokihinui catchment exceeded the national average of 5 ± 0.41 associations per catchment five-fold.
The numbers of alliances and associations recorded in catchments nationally was strongly related to the number of plots sampled in the catchment (adjusted
R2= 0.784 and 0.783, respectively; Fig. 7a and b), but was only weakly related to catchment size (adjusted
Fig. 3Regional-scale comparison of presence of (a) alliances and (b) associations in the Mokihinui lower gorge versus the Karamea lower gorge. Note the vertical axis is the proportion of assigned plots that were in the alliance and excludes those plots designated as outliers
R2= 0.262 and 0.237, respectively; Fig. 7c and d). In these relationships, the Mokihinui catchment was po-sitioned well above the regression line, indicating that its community composition is more heterogeneous compared with other catchments that have been sampled with the same level of intensity or are of a similar size.
Discussion
Representation of forest alliances and associations from local to national scales
Sometimes policy must be formulated and management decisions made rapidly using expert opinion and trad-itional knowledge (Martin et al. 2012; Haenn et al. 2014)
Ultimately, however, robust, quantitative evidence is es-sential to underpin conservation decision making (Pullin and Knight 2009; Magurran and McGill 2011). There are several quantitative advantages to assessing ecosys-tem representation using the approach introduced in this paper. The unbiased sampling undertaken allowed us to compare the same forest vegetation characteristics at two levels of compositional resolution across local, re-gional and national scales. Our use of a quantitative ap-proach to assign plots to a pre-existing national-scale quantitative classification identified vegetation alliances and associations that were poorly represented within the same river system and in a similar river system in the re-gion. It also allowed us to identify individual plant com-munities that are not well represented in the national forest and shrubland plot dataset. Our approach also identified alliances and associations that are near their distributional limit or where the study area is a strong-hold of their distribution, indicating distinctiveness. Pre-vious qualitative assessments of representativeness and distinctiveness for the environmental impact assessment
Fig. 5Proportion of plots designated as compositional outliers in the Mokihinui lower and upper gorges, the Karamea lower gorge and nationally for (a) alliances and (b) associations
of the Mokihinui dam proposal arrived at markedly dis-parate conclusions (Mitchell Partnerships 2007b, Lloyd 2008) and their basis and logic is more challenging to scrutinise than our transparent and repeatable quantita-tive approach.
The importance of nationally unique species assemblages Plots designated as outliers are distinctive in their com-position and insufficiently replicated across the dataset in question to allow a cluster to be defined (De Cáceres et al. 2010); in our example these plots are too dissimilar to be assigned to any associations or alliances defined using the national New Zealand dataset (Wiser and De Cáceres 2013). That the Mokihinui lower gorge area had nearly twice as many plots designated as outliers at both the alliance and association level than either the Mokihi-nui upper gorge or the Karamea lower gorge, and pro-portionally more than the national dataset reiterates a compositional distinctiveness and lack of representation elsewhere.
From a conservation perspective, conclusions that out-lier plots sample significant vegetation must be made with caution. In riparian zones periodic flooding may re-peatedly interrupt successional processes and maintain distinct riparian vegetation (Bendix and Hupp 2000). In the Mokihinui catchment, mass movement is likely to further interrupt succession. Such successions may re-sult in communities that are opportunistic assemblages
of species not repeated across the landscape, depending on the temporal and spatial heterogeneity of local spe-cies pools (Wiser and De Cáceres 2013; Wiser et al. 2016). Indeed, Moore (1976) supported the assertion of Braun-Blanquet (1928) that such‘accidental’assemblages might be inappropriate to be described formally as vegetation types as they are unlikely to recur elsewhere. At the same time, such communities contribute to the variation in ecosystems from local to national scales.
Another alternative is that outlier plots belong to undescribed vegetation types that are too rare to have been sampled in the national dataset. That the outlier plots are primarily located in the riparian topographic strata is noteworthy as sampling bias, in relation to both land tenure (cf. Hilty and Merenlender 2003; Patterson et al. 2012) and sampling protocols mean riparian vege-tation is poorly sampled nationally by the datasets in the NVS databank.
Globally, an estimated two-thirds of the fresh water flowing to the oceans is obstructed by approximately 40,000 large dams (defined as more than 15 m in height) and more than 800,000 smaller ones (Petts 1984; McCully 1996). Their impacts on ecosystem representa-tion are substantial on top of the modificarepresenta-tions to coastal and lowland environments because of their accessibility and value for agriculture and settlement (Walker et al. 2006). Lowland riparian forests, in particu-lar, are one of New Zealand’s most threatened ecosystems
a
b
c
d
(Park 1983; Anon. 2000). Clearance of indigenous forest on New Zealand’s west coast was historically driven by gold mining and the timber industry, but later surpassed by farming developments (McCaskill 1960; Peat 1987; Awimbo et al. 1996). As a result, >53% of the alluvial floodplains are now in pasture up to the river’s edge and only small patches of original forest remain on farmland (Miller 2002). The impacts from agricultural develop-ments were most intensive in the central and northern West Coast (McSweeney 1982), but the steep gorge envir-onment and difficult access has minimised such land-use changes in the Mokihinui gorge and thereby preserved vegetation types that may once have occurred in other catchments.
A national context to interpret catchment-scale beta-diversity
Attention to beta-diversity in conservation is implicit in the principle of complementarity. Complementarity in-volves defining the minimum set of sites in an area that if incorporated into a reserve network will ensure that all species are represented (Margules et al. 1988). Ap-plied to ecosystems, the principle of complementarity ensures ecosystem representation. Regions of high beta-diversity allow ecosystem representation to be achieved with relative efficiency (Spector 2002). High beta-diver-sity in plants may also be linked to high beta-diverbeta-diver-sity in other taxa (e.g. (Kessler et al. 2009; Zellweger et al. 2017). Areas of high beta-diversity may also correspond to biogeographic crossroads, which may be important for conserving evolutionary processes such as speciation and coevolution (Spector 2002).
Our analysis quantitatively demonstrates that the Mokihinui catchment supports one of the most diverse sets of forest alliances and associations recorded in a New Zealand catchment and its combination is unique. The Mokihinui catchment lies within the Northwest Nelson ecological region, one of the most biologically di-verse areas within New Zealand (Heads 1997). The var-ied geology and associated soils, combined with the wide climatic and altitudinal range of this region, have formed many different habitats inhabited by numerous plant species, including regional endemics (Given 1995). The strong biogeographic affinities of the study area with the North Island reflect climate-related distributional limits of plant species and repeated isolation and fragmenta-tion of populafragmenta-tions during Pleistocene glacial-interglacial cycles; this has facilitated the disjunct distribution of many plant species (McGlone 1985).
Maximising beta-diversity is not always beneficial to conservation as anthropogenic impacts can increase dis-similarity between communities (Socolar et al. 2016). For example, when different invasive species invade dif-ferent areas, and there is no loss of native species,
dissimilarity between these areas will increase (McKin-ney 2004), but this wouldn’t be viewed as beneficial to conservation. Patchy human impacts can also increase beta-diversity at the landscape scale (Kessler et al. 2009). The high beta-diversity of forests in the Mokihinui, how-ever, is not a consequence of anthropogenic impacts as it is one of few catchments in New Zealand that has remained largely unmodified by human activity in the past. Currently, only 33% of New Zealand’s land surface
is covered in indigenous forest and shrublands
(Thompson et al. 2004). This represents a > 70% loss of forested areas due to massive land clearance since human arrival 800 years ago (McGlone 1989; Ewers et al. 2006), especially in the lowlands.
Conclusion
The regulation of river flow by dams for hydroelectric generation has been a common practice worldwide, with diverse ecological impacts (Mallik and Richardson 2009). Vegetation plots provided data to assess the impacts of such a land-use change on ecosystem representation at various levels of compositional resolution and spatial scales. Each level of resolution provides answers to a specific set of questions that can lead to rather different conclusions about the severity of impacts. While local-scale assessments may be appropriate in some instances, we demonstrate the utility of simultaneously examining potential impacts at multiple spatial scales based on rep-resentative, detailed plot data. Our approach also shifts the focus away from broadly mapped ecosystem types or individual species to the diversity of ways species are combined to form different types of forest. The result is a structured and coherent picture of the severity of land-use changes that will allow conservation and resource managers to make informed decisions. Given the on-going development of national and supra-national plot-based vegetation classifications (e.g. Schaminée et al. 1995; Jennings et al. 2009; Chytrý & Tíchý 2018), and that vegetation surveys are commonly conducted for conservation planning and as part of offsetting schemes, our approach can be broadly applied. Although our study focussed exclusively on plant communities our ap-proach could be applied to assessing impacts on other types of biodiversity, provided the majority of species have been described and sufficiently sampled.
Postscript
Act, and the high costs. The company faced what could have developed into one of the largest environmental bat-tles in New Zealand. Although multiple Statements of Evidence were filed with the Environment Court, includ-ing one based on some of the work presented here, the hearing never took place. Rising demands for electricity, however, could see the proposal reactivated in the future.
Abbreviation
NVS:National Vegetation Survey databank
Acknowledgements
We are very grateful to the numerous field staff that provided invaluable support to this project. Robbie Price constructed the virtual dams and located the sampling points. Craig Briggs prepared the field maps. We thank James Barringer for his help with the GIS component of the catchment analysis. Elise Arnst prepared the maps. Thanks also to Rob Allen, Larry Burrows and Sarah Richardson for their feedback on earlier drafts of the manuscript. We acknowledge the use of data drawn from the New Zealand National Vegetation Survey databank for this study. Collection of plant specimens for the purposes of this study were covered by the Landcare Research global concession for permission to collected plants for research from lands administered by the New Zealand Department of Conservation.
Funding
This study was funded by Meridian Energy Limited, New Zealand and by Core funding for Crown Research Institutes from the New Zealand Ministry of Business, Innovation and Employment’s Science and Innovation Group.
Availability of data and materials
The datasets supporting the conclusions of this article are available from New Zealand’s National Vegetation Survey Databank
(nvs.landcareresearch.co.nz). The specific datasets related to the Mokihinui dam proposal can be located on the data search page by entering the text “mokihinui hydro proposal”in the‘Search Metadata’box and adding the additional filter Method = Recce. These datasets are publically available and can be downloaded once a user has registered with the NVS databank.
Authors’contributions
KA & SKW conceived of the analytical approach, conducted the statistical analyses and co-wrote the manuscript. IP designed the sampling and super-vised field staff. KA was involved in data collection. MDC developed the ana-lytical approach of applying noise clustering to vegetation classification, helped with the analyses and contributed to the writing of the manuscript. All authors read and approved the final manuscript.
Authors’information
KA received her PhD from Lincoln University, NZ in Ecology & Conservation. She has held positions as a Lecturer in Ecology & Conservation at Lincoln University and a Plant Community Ecologist at Landcare Research, NZ. She is currently the editor for the Performance-based Research Fundin the Research Management Office of Lincoln University. SKW is a Senior Scientist (Plant Ecology). Her research interests include i) vegetation classification and its application; ii) large-scale ecological synthesis; iii) ecological informatics and; iv) ecology of naturally rare ecosystems and habitat islands. IP is a Research Associate at Landcare Research, NZ. His research interests include i) carbon storage and sequestration in natural ecosystems; ii) the development of monitoring systems for biodiversity and carbon in both NZ and the Pacifac islands; and iii) ecology of tussock grasslands. MD is a Ramón y Cajal researcher at the Biodiversity and Landscape Ecology Laboratory of the Forest Science Center of Catalonia. His current research interests include i) the development of quantitative frameworks to analyse the spatial and temporal variation of vegetation; ii) the development and application of models to simulate functioning and dynamics of Mediterranean forests.
Ethics approval and consent to participate
Not applicable.
Consent for publication
Not applicable.
Competing interests
The authors declare that they have no competing interests.
Author details
1
Manaaki Whenua - Landcare Research, PO Box 69040, Lincoln 7640, New Zealand.2Lincoln University, PO Box 85084, Lincoln 7647, New Zealand. 3
Forest Science Centre of Catalonia, Ctra. Sant Llorenç km.2, E-25280 Solsona, Spain.
Received: 1 August 2017 Accepted: 14 December 2017
References
Anon (2000) The New Zealand biodiversity strategy. Our chance to turn the tide Whakakahukihukitia te Tai Roroku ki te Tai Oranga. Department of Conservation and Ministry for the Environment, Wellington
Austin MP, Margules CR (1986) Assessing representativeness. In: Usher MB (ed) Wildlife conservation evaluation. Chapman & Hall, London, pp 45–67 Awimbo JA, Norton DA, Overmars FB (1996) An evaluation of representativeness
for nature conservation, Hokitika Ecological District, New Zealand. Biol Conserv 75:177–186. doi:10.1016/0006-3207(95)00058-5
Bendix J, Hupp CR (2000) Hydrological and geomorphological impacts on riparian plant communities. Hydrol Proc 14:2977–2990. doi:https://doi.org/10. 1002/1099-1085(200011/12)14:16/17<2977::aid-hyp130>3.0.co;2-4
Bonn A, Gaston KJ (2005) Capturing biodiversity: selecting priority areas for conservation using different criteria. Biodivers Conserv 14:1083–1100 Braun-Blanquet J (1928) Pflanzensoziologie. Grundzüge der Vegetationskunde–
Biol. Studienbücher 7. Julius Springer Verlag, Berlin
Chytrý M, Tíchý L (2018) National vegetation classification of the Czech Republic: a summary of the approach. Phytocoenologia In press.
Crist PJ, Kohley TW, Oakleaf J (2000) Assessing land-use impacts on biodiversity using an expert systems tool. Landsc Ecol 15:47–62
Dave RN (1991) Characterization and detection of noise in clustering. Patt Recog Lett 12:657–664
De Cáceres M, Font X, Oliva F (2010) The management of numerical vegetation classification with fuzzy clustering methods. J Veg Sci 21:1138–1151 de Lange PJ, Norton DA, Courtney SP, Heenan PB, Barkla JW, Cameron EK,
Hitchmough R, Townsend AJ (2009) Threatened and uncommon plants of New Zealand (2008 revision). NZ J Bot 47:61–96
Dengler J, Jansen F, Glöckler F, Peet RK, De Cáceres M, Chytrý M, Ewald J, Oldeland J, Finckh M, Lopez-Gonzalez G, Mucina L, Rodwell JS, Schaminée JHJ, Spencer N (2011) The Global Index of Vegetation-Plot Databases (GIVD): a new resource for vegetation science. J Veg Sci 22:582–597
DeVelice R, DeVelice J, Park GN (1988) Gradient analysis in nature reserve design: a New Zealand example. Conserv Biol 2:206–217
Ewers RM, Kliskey AD, Walker S, Rutledge D, Harding JS, Didham RK (2006) Past and future trajectories of forest loss in New Zealand. Biol Conserv 133:312–325
Given R (1995) North-west Nelson. In: Davis SD, Heywood VH, Hamilton AC (eds) Centres of plant diversity volume 2 Asia, Australasia, and the Pacific. WWF/ IUCN, IUCN Publications Unit, Cambridge
Grossman D, Faber-Langendoen D, Weakley A, Anderson M, Bourgeron P, Crawford R, Goodin K, Landaal S, Metzler K, Patterson K, Pyne M, Reid M, Sneddon L (1998) International classification of ecological communities: terrestrial vegetation of the United States, vol 1. The National Vegetation Classification System: development, status, and applications, The Nature Conservancy, Arlington
Groves CR, Jensen DB, Valutis LL, Redford KH, Shaffer ML, Scott JM, Baumgartner JV, Higgins JV, Beck MW, Anderson MG (2002) Planning for biodiversity conservation: putting conservation science into practice. Bioscience 52:499–512
Haenn N, Schmook B, Reyes Y, Calmé S (2014) Improving conservation outcomes with insights from local experts and bureaucracies. Conserv Biol 28:951–958 Heads M (1997) Regional patterns of biodiversity in New Zealand: one degree
grid analysis of plant and animal distributions. J Roy Soc NZ 27:337–354 Hilty J, Merenlender AM (2003) Studying biodiversity on private lands. Conserv
Hortal J, Lobo JM (2006) Towards a synecological framework for systematic conservation planning. Biodiv Inform 3:16–45
Howell C (2008) Consolidated list of environmental weeds in New Zealand. DOC Research & Development Series 292, Wellington
Hurst JM, Allen RB (2007) A permanent plot method for monitoring indigenous forests–field protocols. Manaaki Whenua-Landcare Research, Lincoln Jennings MD (2000) Gap analysis: concepts, methods, and recent results. Landsc
Ecol 15:5–20
Jennings MD, Faber-Langendoen D, Loucks OL, Peet RK, Roberts D (2009) Standards for associations and alliances of the US National Vegetation Classification. Ecol Monogr 79:173–199
Keith DA (2009) The interpretation, assessment and conservation of ecological communities. Ecol Manag Restor 10:S3–S15. doi:10.1111/j.1442-8903.2009.00453.x Kessler M, Abrahamczyk S, Bos M, Buchori D, Putra DD, Gradstein SR, Höhn P,
Kluge J, Orend F, Pitopang R (2009) Alpha and beta diversity of plants and animals along a tropical land-use gradient. Ecol Appl 19:2142–2156 Lloyd KM (2008) Evidence of Dr Kelvin Michael Lloyd in the matter of the
resource management act 1991 and in the matter of an application by Meridian Energy limited for resource consents for the Mokihinui hydro project. Department of Conservation, Hokitika
Macara GR (2016) The climate and weather of west coast. NIWA science and technology series 72
Magurran AE, McGill BJ (2011) Biological diversity: frontiers in measurement and assessment. Oxford University Press, UK
Mallik AU, Richardson JS (2009) Riparian vegetation change in upstream and downstream reaches of three temperate rivers dammed for hydroelectric generation in British Columbia, Canada. Ecol Eng 35:810–819
Margules CR, Nicholls AO, Pressey RL (1988) Selecting networks of reserves to maximise biological diversity. Biol Conserv 43:63–76. doi:10.1016/0006-3207(88)90078-X
Margules CR, Pressey R, Williams P (2002) Representing biodiversity: data and procedures for identifying priority areas for conservation. J Biosci 27:309–326 Martin TG, Burgman MA, Fidler F, Kuhnert PM, Low-Choy S, McBride M,
Mengersen K (2012) Eliciting expert knowledge in conservation science. Conserv Biol 26:29–38
McCaskill M (1960) Historical geography of Westland before 1914 (Vol. 1-3), dissertation. University of Canterbury
McCully P (1996) Silenced rivers. The ecology and politics of large dams. Zed Books, London
McGlone M (1985) Plant biogeography and the late Cenozoic history of New Zealand. NZ J Bot 23:723–749
McGlone M (1989) The Polynesian settlement of New Zealand in relation to environmental and biotic changes. NZ J Ecol 12(supplement):115–129 McKinney ML (2004) Do exotics homogenize or differentiate communities? Roles
of sampling and exotic species richness. Biol Inv 6:495–504
McSweeney GD (1982) Matai/totara floodplain forests in south Westland. NZ J Ecol 5:121–128
Miller CJ (2002) Conservation ecology of riparian forest within the agricultural landscape: West Coast, New Zealand. dissertation. University of Canterbury Mitchell Partnerships (2007a) Mokihinui Hydro proposal: Baseline ecological
surveys. Prepared for Meridian Energy Limited
Mitchell Partnerships (2007b) Mokihinui hydro proposal: terrestrial ecology assessment. Prepared for Meridian Energy
Monavari SM, Momen Bellah Fard S (2010) A GIS based assessment tool for biodiversity conservation. Intl J Environ Res 4:701–712
Moore LB (1976) The changing vegetation of Molesworth station, New Zealand 1944 to 1971. DSIR Bulletin 217
Naiman RJ, Decamps H (1997) The ecology of interfaces: riparian zones. A Review Ecol Syst 28:621–658
Nathan S, Rattenbury M, Suggate R (2002) Geology of the Greymouth area: scale 1:250,000. Institute of Geological & Nuclear Sciences Institute of Geological & Nuclear Sciences 1:250,000 geological map. Lower Hutt
Newsome PFJ (1987) The vegetation cover of New Zealand. Water and soil miscellaneous publication 112. Water and Soil Directorate, Ministry of Works and Development, Wellington
NgāTipu o Aotearoa-New Zealand Plants (2011) http://nzflora.landcareresearch. co.nz /. Accessed 2 June 2011
Noss RF (1990) Indicators for monitoring biodiversity: a hierarchical approach. Conserv Biol 4:355–364
Noss RF, Cooperrider A (1994) Saving nature's legacy: protecting and restoring biodiversity. Washington, D.C.
O'Connor KF, Overmars F, Ralston MM (1990) Land evaluation for nature conservation: a scientific review compiled for application in New Zealand, Department of Conservation, Wellington
Orlóci, L (1967) An agglomerative method for classification of plant communities. Journal of Ecology 55:193–206.
Park GN (1983) The patterns, diversity and conservation status of New Zealand's lowland forests. In: Thompson K, APH H, Edmonds AS (eds) Lowland forests in New Zealand–proceedings of a symposium held at the University of Waikato, Hamilton, 27-28 may 1980
Parliamentary Commissioner for the Environment (2013) Investigating the future of conservation: the case of stewardship land. Parliamentary Commissioner for the Environment, Wellington
Patterson PL, Coulston JW, Roesch FA, Westfall JA, Hill AD (2012) A primer for nonresponse in the US forest inventory and analysis program. Environm Monitor Assess 184:1423–1433. doi:10.1007/s10661-011-2051-5 Peat N (1987) Forever the forest. Hodder & Stoughton, Auckland Petts GE (1984) Impounded rivers. Wiley, Chichester
Pullin AS, Knight TM (2009) Doing more good than harm–building an evidence-base for conservation and environmental management. Biol Conserv 142:931–934
Schaminée JHJ, Stortelder AHF, Westhoff V (1995) De vegetatie van Nederland. Deel 1. Inleiding tot de plantensociologie–grondslagen, methoden en toepassingen. Opulus Press, Uppsala
Scott JM, Davis F, Csuti B, Noss RF, Butterfield B, Groves C, Anderson H, Caicco S, D’Erchia F, Edwards TC, Ulliman J, Wright RG (1993) Gap analysis: a geographic approach to protection of biological diversity. Wildlife Monogr 123:1–41
Snelder T, Biggs B, Weatherhead M (2010) New Zealand river environment classification user guide. Ministry for the Environment, Wellington Socolar JB, Gilroy JJ, Kunin WE, Edwards DP (2016) How should beta-diversity
inform biodiversity conservation? Trend Ecol Evol 31:67–80 Spector S (2002) Biogeographic crossroads as priority areas for biodiversity
conservation. Conserv Biol 16:1480–1487
Stohlgren TJ, Chong GW, Kalkhan MA, Schell LD (1997) Multiscale sampling of plant diversity: effects of minimum mapping unit size. Ecol Appl 7: 1064–1074
Thompson S, Grűner I, Gapare N (2004) New Zealand land cover database, version 2–illustrated guide to target classes. Ministry for the Environment, Wellington
Townsend AJ, de Lange PJ, Norton DA, Molloy J, Miskelly C, Duffy C (2008) The New Zealand Threat Classification System manual. Department of Conservation, Wellington.
Walker S, Price R, Rutledge D, Stephens RTT, Lee WG (2006) Recent loss of indigenous cover in New Zealand. NZ J Ecol 30:169–177
Williams PA, Wiser S, Clarkson B, Stanley MC (2007) New Zealand's historically rare terrestrial ecosystems set in a physical and physiognomic framework. NZ J Ecol 31:119–128
Wiser SK, Bellingham PJ, Burrows LE (2001) Managing biodiversity information: development of New Zealand's National Vegetation Survey databank. NZ J Ecol 25:1–17
Wiser SK, De Cáceres M (2013) Updating vegetation classifications: an example with New Zealand's woody vegetation. J Veg Sci 24:80–93. doi:10.1111/j. 1654-1103.2012.01450.x
Wiser SK, Hurst JM, Wright EF, Allen RB (2011) New Zealand's forest and shrubland communities: a quantitative classification based on a nationally representative plot network. Appl Veg Sci 14:506–523. doi:10.1111/j.1654-109X.2011.01146.x
Wiser SK, Thomson FJ, De Cáceres M (2016) Expanding an existing classification of New Zealand vegetation to include non-forested vegetation. NZ J Ecol 40:1–19
Wood S (2017) Mixed GAM computation vehicle with automatic smoothness estimation. R Package Version 1:8–22