Open Access
Research article
Algorithms for converting estimates of child malnutrition based on
the NCHS reference into estimates based on the WHO Child
Growth Standards
Hong Yang and Mercedes de Onis*
Address: Department of Nutrition, World Health Organization, Geneva, Switzerland
Email: Hong Yang - [email protected]; Mercedes de Onis* - [email protected] * Corresponding author
Abstract
Background: The child growth standards released by the World Health Organization (WHO) in 2006 have several technical advantages over the previous 1977 National Center for Health Statistics (NCHS)/WHO reference and are recommended for international comparisons and secular trend analysis of child malnutrition. To obtain comparable data over time, earlier surveys should be reanalyzed using the WHO standards; however, reanalysis is impossible for older surveys since the raw data are not available. This paper provides algorithms for converting estimates of child malnutrition based on the NCHS reference into estimates based on the WHO standards.
Methods: Sixty-eight surveys from the WHO Global Database on Child Growth and Malnutrition were analyzed using the WHO standards to derive estimates of underweight, stunting, wasting and overweight. The prevalences based on the NCHS reference were taken directly from the database. National/regional estimates with a minimum sample size of 400 children were used to develop the algorithms. For each indicator, a simple linear regression model was fitted, using the logit of WHO and NCHS estimates as, respectively, dependent and independent variables. The resulting algorithms were validated using a different set of surveys, on the basis of which the point estimate and 95% confidence interval (CI) of the predicted WHO prevalence were compared to the observed prevalence.
Results: In total, 271 data points were used to develop the algorithms. The correlation coefficients
(R2) were all greater than 0.90, indicating that most of the variability of the dependent variable is
explained by the fitted model. The average difference between the predicted WHO estimate and the observed value was <0.5% for stunting, wasting and overweight. For underweight, the mean difference was 0.8%. The proportion of the 95% CI of the predicted estimate containing the observed prevalence was above 90% for all four indicators. The algorithms performed equally well for surveys without the entire age coverage 0 to 60 months.
Conclusion: To obtain comparable data concerning child malnutrition, individual survey data should be analyzed using the WHO standards. When the raw data are not available, the algorithms presented here provide a highly accurate tool for converting existing NCHS estimates into WHO estimates.
Published: 5 May 2008
BMC Pediatrics 2008, 8:19 doi:10.1186/1471-2431-8-19
Received: 15 October 2007 Accepted: 5 May 2008
This article is available from: http://www.biomedcentral.com/1471-2431/8/19
© 2008 Yang and de Onis; licensee BioMed Central Ltd.
Background
In April 2006 the World Health Organization (WHO) released new standards for assessing the growth and development of children from birth to five years of age [1-3]. The WHO Child Growth Standards (hereafter referred to as the WHO standards) were developed to replace the National Center for Health Statistics (NCHS)/WHO inter-national growth reference [4] (hereafter referred to as the NCHS reference), whose limitations have been described in detail elsewhere [5]. The new standards are based on an international sample of healthy children living under con-ditions likely to favour achievement of their full genetic growth potential. Furthermore, the mothers of the chil-dren selected for the construction of the standards engaged in fundamental health-promoting practices, namely breastfeeding and not smoking.
As anticipated, the substantially different approaches used to construct the NCHS reference and the WHO standards resulted in significant differences between the two. These differences vary by anthropometric measure, sex, specific percentile or z-score curve, age, and population-specific anthropometric characteristics [1,6]. The impact on popu-lation estimates of child malnutrition will therefore vary depending on all these features.
A notable effect is that stunting will be greater throughout childhood when assessed using the WHO standards com-pared to the NCHS reference. For underweight, the WHO standards will result in a substantial increase in rates of low weight-for-age during the first half of infancy (i.e., 0– 6 months) and a decrease thereafter. For wasting, the main difference between the WHO standards and the NCHS reference is during infancy (i.e., up to about 70 cm in length) when wasting rates will be substantially higher using the WHO standards. With respect to overweight, use of the WHO standards will result in a greater prevalence that will vary according to the age, sex and nutritional sta-tus of the index population. A detailed description of the differences in the rates of underweight, stunting, wasting and overweight has been published elsewhere [6].
At present, the NCHS reference is used in the national nutrition surveillance programmes of over 100 countries [7]. Similarly, the United Nations system monitors the progress of nations in achieving the Millennium Develop-ment Goal of halving, between 1990 and 2015, the pro-portion of people who suffer from hunger, using as a basis for comparison the NCHS reference [8]. It is thus impor-tant to have comparable trend data on child malnutrition both for national and international use, and this will require the reanalysis of the earlier anthropometric sur-veys using the WHO standards. However, the analysis of the earlier surveys will not always be possible primarily due to lack of availability of the raw data. This is mainly
the case for surveys conducted prior to the 1980s, for which data are not available in electronic form. As an alternative approach to producing comparable trend nutritional data, we developed algorithms that convert the estimates of child malnutrition based on the NCHS reference into estimates based on the WHO standards. This paper provides algorithms for the indicators of underweight, stunting, wasting and overweight, and eval-uates their performance in predicting WHO-based esti-mates.
Methods
To develop the algorithms, we selected from the WHO Global Database on Child Growth and Malnutrition [9] nutritional surveys for which raw data were available for analysis using the WHO standards. Where feasible in a given national survey, regional estimates were used in place of national ones in order to increase the number of data points for developing the algorithms. To ensure robustness, only estimates based on a minimum sample size of 400 children were included.
For each survey we generated prevalence estimates of underweight (percent below -2 standard deviation (SD) weight-for-age), stunting (percent below -2 SD length/ height-for-age), wasting (percent below -2 SD weight-for-length/height), and overweight (percent above +2 SD weight-for-length/height) based on the WHO standards (WHO estimates). The prevalence estimates for the NCHS (NCHS estimates) were taken directly from the global database.
A simple linear regression was performed, using the NCHS and WHO prevalence estimates as, respectively, the independent and dependent variables. Since the preva-lence scale is between 0 and 1, to perform the regression in the entire real line, the logit transformation was applied to both estimates before fitting them to the regression model.
Results
In total, 64 national and 4 research surveys were selected from the WHO global database. The age coverage of the surveys was: 0–60 months for 64 surveys, 0–36 months for 2 surveys, and 1 each for 3–60 and 6–60 months. The total number of national/regional estimates used for cre-ating the algorithms for underweight, stunting and wast-ing was 271. For overweight, the sample size was decreased to 255 since the NCHS-based estimate of over-weight was not available from the database for 16 surveys.
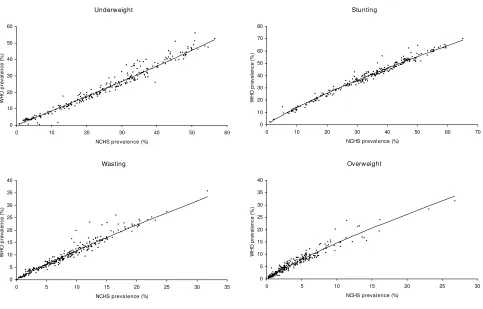
The scatter plots of the two prevalence estimates, WHO vs. NCHS, used for algorithm estimation are presented in Fig-ure 1. The observed estimates are very close to the fitted regression lines in the prevalence scale.
Table 1 presents the parameter estimates from the simple linear regressions in the logit scale. The correlation coeffi-cients, R2, are all greater than 0.90, indicating that most of
the variability of the dependent variable, logit (PWHO), can
be explained by the fitted model for each algorithm. The point estimates of the slopes are greater than 0.9 for all four indicators; and assuming they are equal to "1", the
odds ratios of the two prevalence estimates, WHO vs. NCHS, can be approximated by the exponential function of the intercept, i.e., exp [intercept], which are 0.84, 1.24, 1.03 and 1.26 for underweight, stunting, wasting and overweight, respectively. As shown in Table 1, among all the parameter estimates of the model, only the intercept from the wasting algorithm is not significant; the others, intercepts and slopes, are all significant at the 5% level, with their 95% CIs not including "0".
To validate the performance of the algorithms, 65 national/regional surveys that were not included in their estimation were selected from the WHO global database. Of these, 16 surveys did not cover the entire 0–60 months age range. For overweight, NCHS-based prevalence esti-mates were available for 56 surveys only. Additional file 1 presents, for the four anthropometric indicators, the observed WHO and NCHS prevalence estimates from the 65 surveys, the predicted WHO estimates with the 95% CI, and the actual difference between the predicted and the observed WHO prevalences.
Observed WHO and NCHS prevalence estimates and fitted regression lines in the algorithm estimation
Figure 1
Observed WHO and NCHS prevalence estimates and fitted regression lines in the algorithm estimation. : scatter plot of the observed WHO vs. NCHS prevalence estimates. --: fitted regression line in the prevalence scale.
Underweight
0 10 20 30 40 50 60
0 10 20 30
NCHS prevalence (%)
W
H
O
pre
v
a
le
nc
e
(
%
)
40 50 60
Stunting
20 30 40 50 60 70
NCHS prevalence (%) 0
10 20 30 40 50 60 70 80
0 10
W
H
O p
rev
a
le
n
c
e
(%
)
Wasting
0 5 10 15 20 25 30 35 40
0 5 10 15 20
NCHS prevalence (%)
WH
O
p
rev
al
en
c
e
(
%
)
25 30 35
Overweight
10 15 20 25 30
NCHS prevalence (%) 0
5 10 15 20 25 30 35 40
0 5
WH
O
p
rev
al
en
c
e
(%
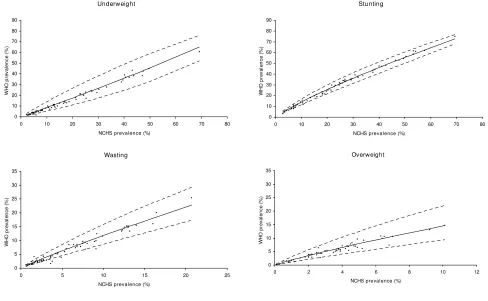
The scatter plots of the two prevalence estimates, WHO vs. NCHS, used for the algorithm validation are presented along with the predicted lines and their 95% CI bands in Figure 2. Since the linear regression models were fitted in the logit scale, the 95% CI bands in the prevalence scale have funnel shapes. Almost all the observed WHO esti-mates are within the 95% CI bands.
The differences between the predicted and the observed WHO estimates were examined, and their summary statis-tics are presented in Table 2. The average difference is less
than a half percent (0.5%) for stunting, wasting and over-weight. For underweight, the mean difference is slightly higher (0.8%). In the lower prevalence group, i.e., <5%, the magnitude of the difference remains roughly the same except for stunting, where the mean difference is a bit higher (0.7%) due to the small number of surveys in this category (n = 3).
The percentage of the 95% CI of the predicted estimate containing the observed prevalence is above 95% for underweight, stunting and overweight, whereas it is
Table 1: Parameter estimates from the simple regression models
Simple linear regression model in the logit1 scale: logit (P
WHO) = a+b*logit (PNCHS)
Algorithm N Intercept a (95% CI) Slope b (95% CI) Correlation coefficient (R2) Mean square error
Underweight 271 -0.177 (-0.231, -0.124)2 0.987 (0.955, 1.019)2 0.931 0.073 Stunting 271 0.216 (0.198, 0.235)2 0.925 (0.908, 0.941)2 0.979 0.012 Wasting 271 0.026 (-0.038, 0.090) 0.928 (0.905, 0.951)2 0.959 0.030 Overweight 256 0.235 (0.117, 0.353)2 0.912 (0.880, 0.944)2 0.925 0.064
1 logit (p) = log [P/(1-P)], where P is either PWHO or PNCHS, the WHO and NCHS prevalence estimates, respectively. 2 p-value < 0.05
NCHS and WHO observed estimates and the predicted WHO estimates from the algorithm validation
Figure 2
NCHS and WHO observed estimates and the predicted WHO estimates from the algorithm validation. : scat-ter plot of the observed WHO vs. NCHS prevalence estimates. --: line connecting the predicted WHO estimates. ---: line con-necting the 95% CI limits (lower or upper) of the predicted WHO estimates.
Underweight
0 10 20 30 40 50 60 70 80 90
0 10 20 30 40 50 6
NCHS prevalence (%)
WH
O
p
rev
al
en
c
e
(%
)
0 70 80
Stunting
0 10 20 30 40 50 60 70 80 90
0 10 20 30 40 50 60 70 80
NCHS prevalence (%)
W
H
O
p
rev
al
en
c
e
(
%
)
Wasting
0 5 10 15 20 25 30 35
0 5 10 15
NCHS prevalence (%)
WH
O
p
rev
al
e
n
c
e
(
%
)
20 25
Overweight
0 5 10 15 20 25 30 35
0 2 4 6 8 10 12
NCHS prevalence (%)
W
H
O
p
rev
al
en
c
e
(
%
slightly lower (92.3%) for wasting (Table 2). This magni-tude of coverage remains roughly the same in the lower prevalence category.
Finally, the four algorithms for calculating the predicted WHO estimates with 95% CI are presented in an Excel programme in Additional file 2. An NCHS prevalence esti-mate in percentage is expected, from which the pro-gramme will generate the WHO-based point estimates with 95% CIs for the four indicators.
Discussion
This paper provides algorithms that convert estimates of child malnutrition based on the NCHS reference into esti-mates based on the WHO Child Growth Standards. The algorithms were developed using simple linear regression models fitted in the logit scale. Empirically, the linear assumption between the NCHS and WHO estimates in the logit scale was supported by the observed relationship dis-played in their scatter plots along with the fitted lines in the prevalence scale (Figure 1). The linear regression model has been used in the past to estimate rates of intrauterine growth retardation [10], and its robustness and high pre-dictability have been demonstrated by de Onis et al [11].
In estimating the algorithms, national/regional estimates were taken from nutritional surveys included in the WHO global database for which WHO estimates were derived using raw data. Potential outliers were examined; how-ever, since there was no evidence of data quality errors, they were not excluded in fitting the models. This approach should preserve the robustness of the models, as a reflection of real life, while keeping the sample consist-ent in estimating the four algorithms.
In all four algorithms, the estimated slopes are close to "1", and except for the underweight algorithm, the esti-mated intercepts are large than "0"; this indicates that, in
general, the predicted WHO estimates are higher than the respective NCHS estimates for stunting, wasting and over-weight, but that the reverse applies for underweight. As shown in an earlier paper from our group [6] with regard to weight-for-age, the average weight of infants included in the WHO standards is above the NCHS median during the first half of infancy, crosses it at about 6 months, and tracks below it thereafter. Therefore, the pattern of the dif-ference between the NCHS redif-ference and the WHO stand-ards estimates depends on the specific age interval. The prevalence of underweight during the first six months of life will be higher when using the WHO standards com-pared to the NCHS reference, but lower thereafter [6]. For a survey covering the entire age group, i.e., 0–60 months, the age-combined prevalence (a weighted average) for underweight is strongly influenced by the majority of late age, and the result is a lower WHO estimate. This is clearly demonstrated in its algorithm, with an approximate ORWHO/NCHS = 0.84. For wasting, there is also a crossing of centiles at about 72 cm of length (equivalent to 9 months in a healthy population or around 1 year in a stunted pop-ulation), but thereafter the -2 SD lines for the NCHS and the WHO curves largely overlap [1]. Therefore, although in general the prevalence of wasting for the entire range 0– 60 months is somewhat higher when based on the WHO standards compared to the NCHS reference, occasionally it might be lower depending on the age-specific length/ height distribution of the index population. This is reflected in the wasting algorithm, which usually yields a slightly higher WHO-predicted estimate (see Additional file 1) with an approximated ORWHO/NCHS = 1.03.
The four algorithms have a high degree of predictability as demonstrated by the validation results (Additional file 1). On average, the magnitude of the differences is very small, less than 0.5% for stunting, wasting and overweight (Table 2). For stunting, this difference is almost negligible given that stunting rates are above 20% in most
develop-Table 2: Summary results from the algorithm validation
Algorithm Prevalence N Mean difference Predicted minus observed WHO prevalence (SD)
Percentage of the observed WHO prevalence within the 95% CI of the predicted values (%)
Underweight <5% 9 0.2 (0.46) 100
t5% 56 0.9 (1.62) 98.2
Total 65 0.8 (1.53) 98.5
Stunting <5% 3 0.7 (0.55) 66.7
t5% 62 0.1 (1.34) 96.8
Total 65 0.1 (1.32) 95.4
Wasting <5% 36 0.4 (0.86) 88.9
t5% 29 0.2 (1.30) 96.6
Total 65 0.3 (1.07) 92.3
Overweight <5% 46 0.2 (0.74) 97.8
t5% 9 0.3 (1.36) 100
ing countries. Also, in almost all cases the observed WHO prevalence falls within the 95% CIs of the predicted esti-mate (Table 2), especially for underweight, stunting and overweight, where more than 95% of the observed WHO estimates are within the confidence limits. Similarly, the small magnitude of the mean differences and high cover-age of the 95% CIs are affected only slightly, if at all, when the prevalence is low (i.e., below 5%)(Table 2).
The majority of the surveys used in developing the algo-rithms cover the age range 0 to 60 months. Nevertheless, the algorithms can also be applied to convert NCHS esti-mates from surveys with a different age range (e.g., 6–60 months and 3–36 months) since the predicted WHO esti-mates are very close to the observed values (Additional file 1). Although in some cases the difference increases slightly when the survey covers an age range under 0–60 months, most of the 95% CIs still cover the observed WHO estimate.
Conclusion
In summary, the WHO standards have several technical advantages over the NCHS reference, including its source population, study design and statistical methods applied to construct the curves [2], and WHO and other international bodies such as the International Pediatric Association [12] recommend them for use with individual children and in child populations. To obtain comparable data for interna-tional comparisons and for secular trend analysis, the WHO estimates should be derived using raw data whenever possible. However, for those surveys for which raw data are not available, the algorithms presented here provide an easy-to-use tool for calculating accurately the WHO esti-mates using the historical NCHS-based estiesti-mates.
Competing interests
The authors declare that they have no competing interests.
Authors' contributions
HY and MdO developed the idea for the analysis. HY per-formed the analysis and drafted the manuscript. MdO guided the analysis and interpretation of results and revised the manuscript for essential intellectual content.
Additional material
Acknowledgements
We want to thank Jim Akre for his editorial comments on the manuscript. The views expressed in the paper are solely those of the authors and do not necessarily reflect the decision or stated policy of the World Health Organization.
References
1. WHO Multicentre Growth Reference Study Group: WHO Child Growth Standards: Length/height-for-age, weight-for-age, weight-for-length, weight-for-height and body mass index-for-age: Methods and development
Geneva: World Health Organization; 2006.
2. WHO Multicentre Growth Reference Study Group: WHO Child Growth Standards based on length/height, weight and age.
Acta Paediatr Suppl 2006, 450:76-85.
3. Garza C, de Onis M, for the WHO Multicentre Growth Reference Study Group: Rationale for developing a new international growth reference. Food Nutr Bull 2004, 25(Suppl 1):S5-14. 4. Hamill PVV, Drizd TA, Johnson CL, Reed RB, Roche AF, Moore WM:
Physical growth: National Center for Health Statistics per-centiles. Am J Clin Nutr 1979, 32:607-29.
5. de Onis M, Yip R: The WHO growth chart: historical consider-ations and current scientific issues. Bibl Nutr Dieta 1996,
53:74-89.
6. de Onis M, Onyango AW, Borghi E, Garza C, Yang H, for the WHO Multicentre Growth Reference Study Group: Comparison of the WHO Child Growth Standards and the NCHS/WHO inter-national growth reference: implications for child health pro-grammes. Public Health Nutr 2006, 9:942-7.
7. de Onis M, Wijnhoven TMA, Onyango AW: Worldwide practices in child growth monitoring. J Pediatr 2004, 144:461-5. 8. UN Millennium Project 2005: Halving Hunger: It Can Be Done. Task
Force on Hunger 2005 London and Sterling, VA; 2005.
9. de Onis M, Bloessner M: The World Health Organization Glo-bal Database on Child Growth and Malnutrition: methodol-ogy and applications. Int J Epidemiol 2003, 32:518-26.
10. Villar J, Ezcurra EJ, Gurtner de la Fuente V, Campodonico L: Pre-term delivery syndrome: the unmet need. New perspectives for the effective treatment of pre-term labor: an international consensus. Research and Clinical Forums 1994, 16:9-38.
11. de Onis M, Bloessner M, Villar J: Levels and patterns of intrauter-ine growth retardation in developing countries. Eur J Clin Nutr
1998, 52(Suppl 1):S5-15.
12. International Pediatric Association. Endorsement of the New WHO Growth Standards for Infants and Young Chil-dren [http://www.who.int/childgrowth/Endorsement_IPA.pdf]
Pre-publication history
The pre-publication history for this paper can be accessed here:
http://www.biomedcentral.com/1471-2431/8/19/prepub
Additional file 1
This file contains a table presenting the results of the validation described in the results section of the manuscript. It is under the title "Individual NCHS and WHO observed estimates and the predicted WHO estimates from the algorithm validation". It is a standard word file created by MS Word 2003.
Click here for file
[http://www.biomedcentral.com/content/supplementary/1471-2431-8-19-S1.doc]
Additional file 2
This Excel programme contains the actual algorithms developed in this paper. For each indicator, i.e. underweight, stunting, wasting and over-weight, a NCHS-based prevalence estimate in percentage is expected from the user, from which the predicted WHO-based estimate with its 95% CI will be generated by the programme.
Click here for file