DETERMINATION AND
OPTIMIZATION OF CYLINDRICAL
GRINDING PROCESS PARAMETERS
USING TAGUCHI METHOD AND
REGRESSION ANALYSIS
M.Janardhan1 and Dr.A.Gopala Krishna2
1
Professor, AbdulKalam Institute of Tech. Sciences, Vepalagadda, Kothagudem, Khammam Dist.AP., India
2
Associate Professor, Department of Mechanical Engg, JNTU College of Engg, Kakinada.AP., India
E mail:[email protected] Mobile:9849497834
ABSTRACT
Cylindrical grinding is one of the important metal cutting processes used extensively in the finishing operations. Metal removal rate and surface finish are the important out put responses in the production with respect to quantity and quality respectively. The Experiments are conducted on CNC cylindrical grinding machine with L9 Orthogonal array with input machining variables as work speed, feed rate and depth of cut. Empirical models are developed using design of experiments and response surface methodology. The adequacy of the developed model is tested with ANNOVA. The developed model can be used by the different manufacturing firms to select right combination of machining parameters to achieve an optimal metal removal rate (MRR) and surface roughness (Ra).The results reveals that feed rate, depth of cut are influences predominantly on the output responses metal removal rate (MRR) and surface roughness (Ra).The predicted optimal values for MRR, Ra for Cylindrical grinding process are 62.05 gm/min and 0.816 µm respectively. The results are further confirmed by conducting confirmation experiments.
Key Words: Cylindrical grinding, Metal removal rate (MRR), Surface roughness (Ra), Design of experiments (DOE), Taguchi method and regression analysis
I Introduction
maximize the metal removal rate (MRR) and to minimize the surface roughness (Ra).In order to optimize these values taguchi method, ANNOVA and regression analysis is used.
2. Taguchi Method and Regression analysis
Taguchi method is the process of engineering optimization in a three step approach namely system design, parameter design and tolerance design. In the system design, a basic functional prototype design will be produced by applying scientific and engineering knowledge. In parameter design, independent process parameter values will be optimized and where as in tolerance design, tolerances will be determined and analyzed for optimal values set by parameter design. Taguchi method is a powerful design of experiments (DOE) tool for optimization of engineering processes, in which the concept of S/N ratio is used for the improvement of quality through variability reduction and improvement of measurement. The transformation of the repetition data to another value, which is a measure of the variation and at least two data points are required to determine the S/N ratio. There are several type of S/N ratios are available based on the characteristic namely lower is better(LB),nominal is the best(NB),higher is better(HB) and mathematical equations of these S/N ratios is expressed in equations (1),(2)and (3).The optimal level of the process parameters is the level with highest S/N ratio. A statistical analysis of variance (ANNOVA) is performed to determine the significant process parameters.
Lower is better S/N =-10 log [1/n (Σyi2)] ---- “Eq. (1)”.
Higher is better S/N =-10 log [1/n (Σ1/yi2)] ---- “Eq. (2)”.
Nominal is better S/N =10 log [y⎯/Sy2] ---- “Eq. (3)”.
Where n is the number of observations, y is the observed data, Sy2 is the variance of y.
The orthogonal array is selected for the process parameters based on the Taguchi method the total degrees of freedom for three levels with three process parameters were six. The L9 Orthogonal array with nine experimental readings and three levels was selected for the Present work. The process parameters and their levels in this study are presented in the Table 1.
Regression analysis is used to determine the relationships of the variables which influences the output responses .The multiple regression analysis equations are in the following form
Y=a1+b1x1+b2x2+b3x3+---+bkxk ---“Eq. (4)”.
Where Y is independent variable and x1, x2, x3----xk are the known variables from which independent variable
will be determined .a1, b1, b2, b3----bk are regression coefficients which can be determined by the method of least
squares. The regression analysis was done by MINITAB15 statistical software.
Table 1 Processes Parameters and their levels
Parameter Units Symbol Low Center High
Work Speed Rpm A 150 200 250
Depth of Cut μm B 20 25 30
Feed rate mm/min C 780 1460 2140
3. Experimental Details
A set of experiments were conducted on cylindrical grinding machine on EN8 material to determine effect of machining parameters namely feed rate (mm/min),Work speed (rpm), depth of cut (μm) on metal removal rate and surface finish (μm). Three levels and three factors L9 Orthogonal array used to design the orthogonal array by using design of experiments (DOE) and relevant ranges of parameters as shown in Table 1. Grinding wheel used for the present work is the aluminum oxide abrasive with verified bond with constant speed of 1650 RPM and water miscible coolant was supplied in all grinding experiments. The jobs have undergone turning and hardening processes before grinding. Hardening is done for better output response and the BHN is maintained at 30-35. Material removal rate (MRR) is calculated by taking the ratio of difference of initial weights and final weights to machining time. The formula to calculate the MRR is given in Eq. (5)
MRR= [(W1-W2)/machining time] gm/min --- “Eq. (5)”.
Where W1 is the weight of the job before grinding and W2 is the weight of the job after grinding .The surface
4. Results and discussion
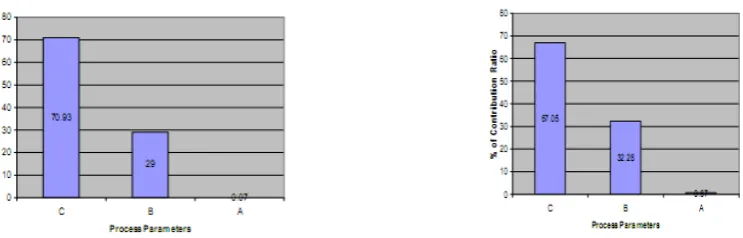
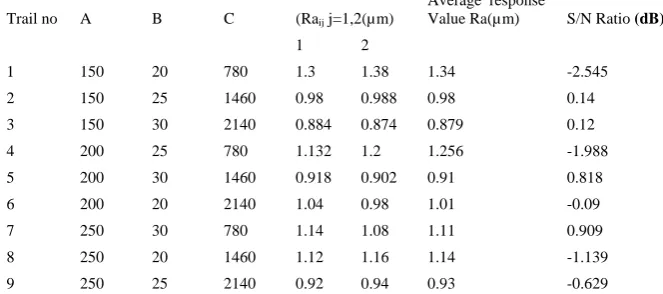
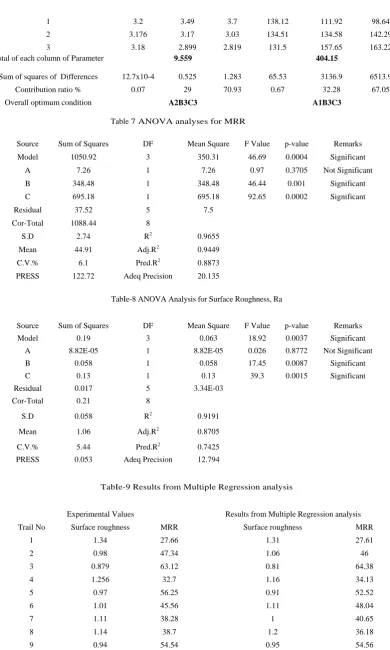
Discussion was done by determination of signal to noise ratio(S/N ratio) based on the experimental data. The S/N ratio is a simply a quality indicator by which the effect of a changing a particular process parameter on the processes performance. A better signal is obtained when the noise is smaller so that a larger S/N ratio is used for surface roughness and higher is better characteristic is used for metal removal rate. The surface roughness and metal removal rate(MRR) for nine trail conditions with two measurement locations along with average response values and corresponding S/N ratios were determined, shown in Table (2) and Table(3) respectively. The average values of surface roughness and metal removal rate (MRR) at different levels were computed as shown in Table (4). As a sample calculation, the average effect of work speed at first level was determined for surface roughness using the average of surface roughness from the experimental values 1-3 of table (2) viz [ (1.34+0.98+0.879)/3=1.067]. Similarly the average values of surface roughness and metal removal rate (MRR) for different processes parameters namely work speed, feed rate and depth of cut at different levels were determined and shown in table (4). In the same procedure, the average values of S/N ratios for surface roughness and metal removal rate (MRR) for different processes parameters namely work speed, feed rate and depth of cut at different levels were determined and shown in table (5). Pareto ANNOVA was carried to determine contribution ratio of the processes parameters on the output responses namely surface roughness and metal removal rate (MRR) and shown in table (6) .The first Three rows indicate the sum of surface roughness and metal removal rate (MRR) at respective levels for each process parameter. As a sample calculation, for process parameter work speed at level 1 is determined as (1.34+0.98+0.879=3.2) from the experimental readings of surface roughness and metal removal rate (MRR) in table (2) and Table (3) respectively and the same procedure was extended to other sums at different levels for different process parameters . The Sum of squares of differences for each process parameter was calculated using the equation “Eq. (6)”.The same procedure was adopted to determine other sum of squares of differences for each process parameter. The percentage of contribution ratio was determined for the processes parameters on out put responses .As a sample calculation for the process parameter of feed rate is [(1.283)/(1.283+0.525+12.7x10-4)]= 70.93 .PARETO diagram for surface roughness and metal removal rate (MRR)is shown in Fig(1) and Fig(2) respectively.
From the diagram it is evident that the feed rate played vital role on output responses than other process parameters. The overall optimal condition for the three process parameters were determined based on the least sum at factor levels for the surface roughness and highest sum at factor Levels for the metal removal rate (MRR).Hence the overall optimal condition for the surface roughness is A2 B3 C3 and for metal removal rate
(MRR) is A1 B3 C3
A= (ΣA1-ΣA2)2+ (ΣA2-ΣA3)2+ (ΣA3-ΣA1)2 --- “Eq. (6)”.
Analysis of variance (ANNOVA) using MINITAB15 software was performed to determine the significance of process parameters on the output responses namely surface roughness and metal removal rate (MRR) listed in table (7) and table (8) and revels that both models are significant. From table (7) and table (8), it is evident that feed rate and depth of cut are significant process parameters as their F values are grater than P values for both the output responses where as other process parameter work speed is not significant as its F value is less than the P value. The regression equations for output responses in terms of process parameters is given below
Surface Roughness,
Ra =1.062–(3.83x10⁻³ x A)–(0.1478xC) – (0.098xB) --- “Eq. (7)”.
MRR=44.90–(1.10x A) + (7.62xB) + (10.763xC) ---“Eq. (8)”.
Results from Multiple Regression analysis along with experimental values are listed in the table (9) and it is evident that there is a good agreement between results.
Table 2 Experimental observations and S/N ratio for surface roughness Ra (µm)
Trail no A B C (Raij j=1,2(µm)
Average response
Value Ra(µm) S/N Ratio (dB)
1 2
1 150 20 780 1.3 1.38 1.34 -2.545
2 150 25 1460 0.98 0.988 0.98 0.14
3 150 30 2140 0.884 0.874 0.879 0.12
4 200 25 780 1.132 1.2 1.256 -1.988
5 200 30 1460 0.918 0.902 0.91 0.818
6 200 20 2140 1.04 0.98 1.01 -0.09
7 250 30 780 1.14 1.08 1.11 0.909
8 250 20 1460 1.12 1.16 1.14 -1.139
9 250 25 2140 0.92 0.94 0.93 -0.629
Table3 Experimental observations and S/N ratio for Metal Removal Rate MRR (gm/min)
Trail no A B C
MRRij
j=1,2(µm)
Average response
Value MRR(gm/min) S/N Ratio (dB)
1 2
1 150 20 780 27.01 28.31 27.66 34.86
2 150 25 1460 47.22 47.46 47.34 39.52
3 150 30 2140 64.18 62.06 63.12 42.02
4 200 25 780 32.6 32.8 32.7 36.31
5 200 30 1460 56.4 56.1 56.25 41.02
6 200 20 2140 44.96 46.16 45.56 39.19
7 250 30 780 38.22 38.34 38.28 37.68
8 250 20 1460 38.28 39.12 38.7 37.77
9 250 25 2140 54.13 54.95 54.54 40.75
Table4 Average values of MRR and Surface Roughness at different levels.
Parameter Average values of MRR Average values of surface roughness
L1 L2 L3 L1 L2 L3
A 46.04 44.83 43.84 1.067 1.058 1.06
B 37.3 44.86 52.55 1.163 1.011 0.93
C 32.88 47.43 54.4 1.23 1.011 0.939
L1 L2 L3 represents levels 1, 2 and 3 respectively.
Table 5 Average values of S/N ratios for MRR and Surface Roughness at different levels.
Parameter Average S/N ratio of MRR Average S/N ratio of surface roughness
L1 L2 L3 L1 L2 L3
A 38.8 38.84 38.73 -0.42 -0.42 -0.286
B 37.27 40.43 40.24 -0.955 -0.229 0.622
C 36.28 39.43 40.65 -0.44 -0.06 0.133
Table 6 determination of Pareto ANNOVA for MMR and Surface Roughness
Surface roughness MRR
Process parameters A B C A B C
1 3.2 3.49 3.7 138.12 111.92 98.64
2 3.176 3.17 3.03 134.51 134.58 142.29
3 3.18 2.899 2.819 131.5 157.65 163.22
Total of each column of Parameter 9.559 404.15
Sum of squares of Differences 12.7x10⁻⁴ 0.525 1.283 65.53 3136.9 6513.9
Contribution ratio % 0.07 29 70.93 0.67 32.28 67.05
Overall optimum condition A2B3C3 A1B3C3
Table 7 ANOVA analyses for MRR
Source Sum of Squares DF Mean Square F Value p-value Remarks
Model 1050.92 3 350.31 46.69 0.0004 Significant
A 7.26 1 7.26 0.97 0.3705 Not Significant
B 348.48 1 348.48 46.44 0.001 Significant
C 695.18 1 695.18 92.65 0.0002 Significant
Residual 37.52 5 7.5
Cor-Total 1088.44 8
S.D 2.74 R2 0.9655
Mean 44.91 Adj.R2 0.9449
C.V.% 6.1 Pred.R2 0.8873
PRESS 122.72 Adeq Precision 20.135
TabIe-8 ANOVA Analysis for Surface Roughness, Ra
Source Sum of Squares DF Mean Square F Value p-value Remarks
Model 0.19 3 0.063 18.92 0.0037 Significant
A 8.82E-05 1 8.82E-05 0.026 0.8772 Not Significant
B 0.058 1 0.058 17.45 0.0087 Significant
C 0.13 1 0.13 39.3 0.0015 Significant
Residual 0.017 5 3.34E-03
Cor-Total 0.21 8
S.D 0.058 R2 0.9191
Mean 1.06 Adj.R2 0.8705
C.V.% 5.44 Pred.R2 0.7425
PRESS 0.053 Adeq Precision 12.794
TabIe-9 Results from Multiple Regression analysis
Experimental Values Results from Multiple Regression analysis
Trail No Surface roughness MRR Surface roughness MRR
1 1.34 27.66 1.31 27.61
2 0.98 47.34 1.06 46
3 0.879 63.12 0.81 64.38
4 1.256 32.7 1.16 34.13
5 0.97 56.25 0.91 52.52
6 1.01 45.56 1.11 48.04
7 1.11 38.28 1 40.65
8 1.14 38.7 1.2 36.18
9 0.94 54.54 0.95 54.56
Prediction of Optimal Output Responses
Ra= B3R+C3R-Y1 = 0.939+0.939-1.062=0.816--- “Eq. (9)”.
MRR= B3M+C3M-Y2=52.55+54.4-44.9=62.05 --- Eq. (10)
Where y1 y2 are mean of average values of surface roughness and Metal Removal Rate respectively.
B3R, C3R are average Surface Roughness for third level of depth of cut and feed rate respectively.
B3M, C3M are average Metal Removal Rate for third level of depth of cut and feed rate respectively.
Response Graphs
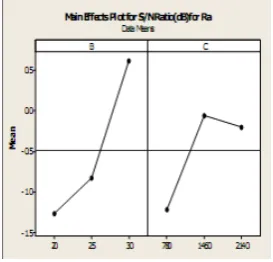
Response graphs for the average values and S/N ratios of surface roughness and metal removal rate (MRR) are shown in fig 3-6.
Fig (3) Response graphs for Ra Fig (4) Response graphs for S/N ratio of Ra
Fig (5) Response graphs for MRR Fig (6) Response graphs for S/N ratio of MRR
fig 3 shows the response graphs of surface roughness for two significant parameters namely depth of cut and feed rate and fig 4 shows the response graphs of S/N ratio for surface roughness with two significant parameters namely depth of cut and feed rate. It revels that highest s/n ratio values of depth of cut and feed rate are highest and produced minimum variation in surface roughness at that level. Fig 5 and Fig 6 shows response graphs for metal removal rate and S/N ratio of metal removal rate and evident that two processes parameters namely depths of cut and feed rate are significant on output response metal removal rate.
Confidence Intervals
The Confidence intervals at 95% for confirmation tests was determined using the following equation
The Confidence intervals, I= [Fα (1, fe) x Ve (1/neff)] ½
Where Fα is the F ratio at (1-α) confidence interval against one degrees of freedom and error degree of freedom fe.
n eff = ( Number of Experiments)/ (1+ dof of all factors in the estimate of mean)
CI for Surface Roughness
Error Variance (Ve) =0.0034
Hence, CI = ±0.086
Predicted optimal range for surface roughness is given by
0.73 µm < Ra < 0.902 µm
CI for MRR
Total no of Trails =18, No of Repetitions=2 neff=3 and F0.05(1,5)=6.61
Error Variance (Ve) =7.504
Hence, CI = ±4.06
Predicted optimal range for MRR is given by
57.99 gm/min < MRR < 66.11 gm/min
Confirmation of experiments
Two confirmation experiments were conducted at the optimum set of the process parameters. The average values of surface roughness at the optimum set of the process parameters were 0.826 μm and 0.897 μm respectively and they fall in the predicted rage of 0.73 - 0.902 μm. The average values of metal removal rate (MRR) at the optimum set of the process parameters were 60.19 and 62.2 gm/min respectively and they fall in the predicted rage of 57.99-66.11 gm/min.
5. Conclusions
This paper has presented application of taguchi method to determine the optimal process parameters for cylindrical grinding process. The concept of ANNOVA and S/N ratio is used to determine the effect and influence of process parameters namely work speed, feed rate and depth of cut is studied on output responses, and found that the developed model is significant. MINITAB15 software is used is for analysis of response graphs of average values and S/N ratios. From the Pareto analysis it is evident that the feed rate played vital role on output responses surface roughness and metal removal rate (MRR) than other process parameters. The model predicted in the present work is useful for selecting the right set of process parameters variables for optimal value of the MRR and Surface roughness.
6. References
[1] Taguchi G. introduction to quality engineering (Asian productivity organization Tokyo), 1990.
[2] Roy, RK, Premier on Taguchi Methods (Van Nostrand Reinhold, New York, 1990.
[3] Guptha V and Murthy PN, An introduction to Engineering design methods, Tata McGraw Hill, New Delhi, 1982.
[4] Jae –Seob Kwak, Application of Taguchi and response surface methodologies for geometricerror in surface grinding process,
international journal of machine tools &manufacture 45(2005) 327-334.
[5] Jae –Seob Kwak, An analysis of grinding power and surface roughness in external cylindrical grinding of hardened SCM 440 Steel
using the response surface method, international journal of machine tools &manufacture 46 (2006) 304-312.
[6] N.Alagumurthi, K. palaniradja and V.Soundararajan, cylindrical grinding – a review on Surface integrity. International journal of
precision engineering and manufacturing vol. no 3.
[7] S.S.Mahapatra, Amar Patnaik, Optimization of wire electrical discharge machining (WEDM) Process parameters using Taguchi
method.
[8] Dinesh, Optimization of High speed turning parameters of super alloy inconel Material using Taguchi Technique, Indian journal of
engineering& materials sciences, Feb 2009 pp 44-50.
[9] Naveen Beri, S.Maheswari, Performance Evaluation of Powder Metallurgy Electrode in EDM of AISI D2 Steel using Taguchi Method,