STUDY ON HYDROXYAPATITE
COATING ON BIOMATERIALS BY
PLASMA SPRAY METHOD
Dr. Hanumantharaju H. G1, Dr. H. K. Shivanand2, Prashanth K. P3, K. Suresh Kumar4, S. P. Jagadish5
1,2
UVCE, Department of Mechanical Engineering, Bangalore, India, 3
East West Institute of Technology, Bangalore, India, 4,5
Rao Bahadur Y Mahabaleswarappa Engineering College, Bellary, India,
E-mail:[email protected], [email protected], [email protected] 4
[email protected], [email protected]
Abstract
In plasma spray coating process the hydroxyapatite powder particles are melted in a high temperature plasma flame and propelled towards the substrate material thus forming a coating. The thin hydroxyapatite coatings have shown better adhesion to substrates and are more stable in the biological environment because they have more uniform structure and composition. Samples are tested for Scanning Electron Microscopy analysis, to find the uniform coating and bonding strength. From the XRD analysis it was confirmed that the phase purity of HAP is maintained even after the coating.
Keywords: Plasma spray process, Hydroxyapatite, SEM, XRD
1. INTRODUCTION
Plasma spraying techniques are coating processes in which melted materials are sprayed onto a surface. Plasma spraying can provide thick coatings over a large area at high deposition rate as compared to other coating processes such as electroplating, physical and chemical vapor deposition. Coating materials available for plasma spraying include metals, alloys, ceramics, plastics and composites. They are fed in powder or wire form, heated to a molten or semi molten state and accelerated towards substrates in the form of micron-size particles. Combustion or electrical arc discharge is usually used as the source of energy for plasma spraying. Resulting coatings are made by the accumulation of numerous sprayed particles. The surface may not heat up significantly, allowing the coating of flammable substances.
2. MATERIALS
Biocompatibility proved materials like SS316L, Ti-6Al-4V, Alumina, PEEK and Polyurethane materials are considered for plasma spray coating [R.G. Mason (1972)]. As a coating material for biomaterials Hydroxyapatite [Ca10(PO4)6(OH)2] is used
[
K.A.Khor, et.al, (1997)]. Hydroxyapatite is an inorganic compound whose chemical composition is similar to the composition of the bone. It is a very attractive material due to its excellent biocompatibility, bioactivity and osteoconduction properties.3. POWDER PREPARATION
Commercially HAP powder is very costly, so an attempt is made to prepare the powder from fish bone and egg shell as these sources consider as waste material. These are easily available and they are of lower cost [K. Prabakaran and S. Rajeswari, (2006)].
Steps in Powder Preparation
1) Fish bones are obtained from fish. The fish named soel is available in large quantity at fish market. The fish bones are boiled in distilled water for 1hr and washed using a strong water jet to eliminate the fish meat.
2) The washed fish bones are then dried and heated in an oven at 500oC for 30 min.
Plasma spray method is the most commonly used method for the application of HAP coatings [Metthew T. Walenciak et al (2004)]. This is a thermal spray process in which powder particles are melted in a high temperature plasma flame and propelled towards the substrate material forming a coating. The advantages of this process include the high deposition rate which allows coatings to be quickly produced. In this study, the HAP coatings were atmospherically plasma sprayed (APS) using different spray power and stand-off distance (SOD), and the coating surfaces were characterized using various methods.
Substrates of Ti-6Al-4V, SS316L, Al2O3, PEEK and Polyuretnane were prepared by pickling in acid (8% HF and 40% HNO3) for 1 min, to remove surface oxide, and degreased by rinsing in acetone. Substrates were then grit-blasted with brown Al2O3 (-80 mesh) under a pressure of 6 bar for ~30 s. The surfaces were air-blasted to remove any residual grit and finally cleaned with alcohol.
Plasma spray method is used to coat HAP on all considered specimens. The feedstocks were fully crystalline pure HAP powders with a particle size distribution in the range of 10 - 120µm. They were produced by spray drying followed by heat treatment. A Metco 3MB plasma torch with a GH nozzle was used for the atmospheric plasma spray (APS) process. Argon was used as the primary gas(at 50 slpm) and the carrier gas (at 3.65 slpm). Hydrogen was used as the secondary gas while its volume was adjusted to obtain different spray voltages. The powders were sprayed at 14 g/min and three types of spray power and two stand-off distances were used.
Table 1: Spraying conditions used for all specimens
Spraying conditions used for all specimens
Chamber pressure (bar) 200
Spraying stand-off distance (mm) 270
Nozzle internal diameter (mm) 8
Plasma gas flow rates(slpm) Ar = 50, +H2 = 4-9 or Ar = 35, +He =50
5. STUDY OF SEM IMAGES
The present work investigated in detail, the coating of HAP on considered materials by plasma spray method. Uniform bonding of coating layer on implant materials by using SEM images and X-ray diffraction pattern are discussed as follows:
5.1 SEM images and XRD pattern of SS316L material
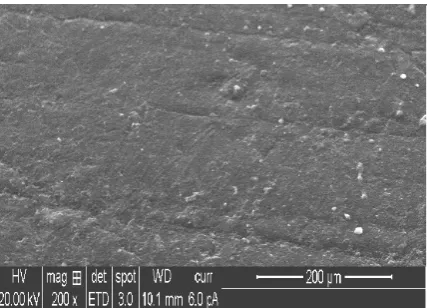
Figure.1 shows the scanning electron micrograph image of SS316L before coating. This image reveals the surface texture of the SS316L. It is observed that the phases are enlarged in the form of lines and in between the lines some cleavages are being seen which may be helpful for proper bonding of the materials.
Figure 1: SEM image (200X) of SS316L before Coating
Figure 2: SEM image (500X) of SS316L after coating.
Figure 3: SEM image (3000X) of SS316L, after coating.
Phase analysis of coated SS316L
Graph 1: Phase analysis of HAP on SS316L
5.2 SEM images and XRD pattern of Ti-6Al-4V material
Figure.4 shows the scanning electron micrograph image of Ti-6Al-4V before coating. This image reveals the surface texture of SS316L. It is observed that the phases are enlarged in the form of lines and in between the lines some cleavages are being seen which may be helpful for proper bonding of the materials. At some zones it is being observed that spheroidal structures present in the other phases.
Figure 4: SEM image (200X) of Ti-6Al-4V before Coating
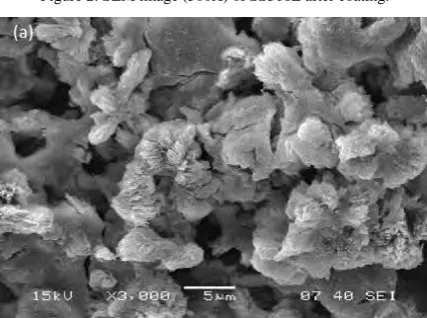
Figures.5 and 6 shows the SEM images of HAP coated material, it is observed that the deposition is uniform and it covers entire surface in the form of feathery structure, when seen under low magnification (500X) and high magnification (3000X). The growth of the HAP crystals is more pronounced, which leads to better coating on the surface as observed from the figures. This better coverage of HAP coating on sample is due to the proper growth of HAP crystals has taken place, which also results in giving a good thick layer on the surface up to 50 microns. It is also observed that the coated material is more dense structure compared to SS316L coated specimen. Fibre structured coating is observed in high magnification which may be useful to improve the performance of the implant.
Figure 6: SEM image (3000X) of Ti-6Al-4V, after coating
Phase analysis of coated Ti-6Al-4V
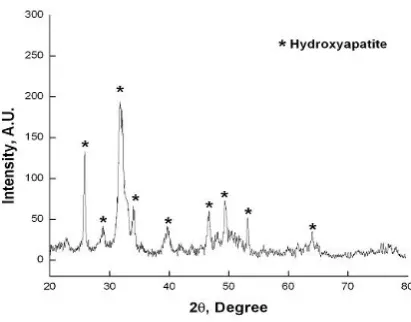
Graph.2 shows the X-ray diffraction profile of coated Ti-6Al-4V. From the analysis of the XRD data obtained from the scrape of the coating on the sample surface, it is found that, the peaks obtained are matching with the standard peaks of HAP in the data book. The matching of the peaks are done using PHILIPS X pert high score software. Hence we can conclude that HAP has not lost its phase purity after deposition. The coating of HAP were verified from the X Ray Diffraction pattern, no other lower calcium compounds are detected in the data, which confirms that the purity of the HAP coating is almost 99 %.
Graph 2: Phase analysis of HAP on Ti-6Al-4V
5.3 SEM images and XRD pattern of Al2O3 material.
Figure.7 shows the scanning electron micrograph image of Al2O3 before coating. The image shows the curved grain boundaries throughout the surface which may be useful for better coating.
Figure 7: SEM image (200X) of Al2O3 before Coating
Figure 8: SEM image (500X) of Al2O3, after coating
Figure 9: SEM image (3000X) of Al2O3, after coating
Phase analysis of coated Al2O3
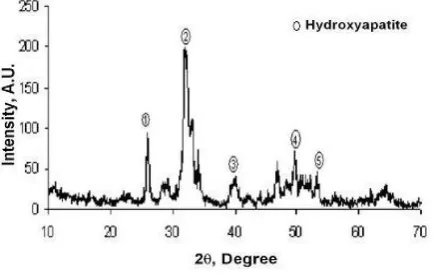
Graph.3 shows the X-ray diffraction profile of coated Al2O3. From the analysis of the XRD data obtained from the scrape of the coating on the sample surface, it is found that, the peaks obtained are matching with the standard peaks of HAP in the data book. The matching of the peaks are done using PHILIPS X pert high score software. Hence we can conclude that HAP has not lost its phase purity after deposition. The coating of HAP were verified from the X Ray Diffraction pattern, no other lower calcium compounds are detected in the data, which confirms that the purity of the HAP coating is almost 99 %. More number of peaks have been observed in this material compared to the previous material which may be more stable than other two.
5.4 SEM image of PEEK with 30% glass filled
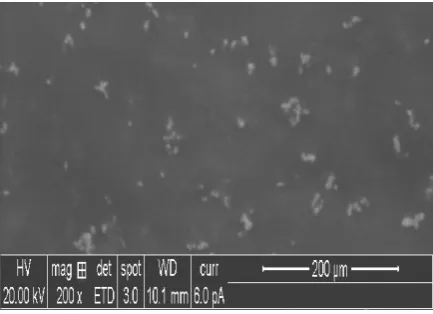
Figure.10 shows the scanning electron micrograph image of PEEK with 30% glass filled before coating, when seen under low magnification (200X). It is observed that the phases are uniform with fine surface. Coating of HAP could not take place by plasma spray method; it may be due to material property.
Figure 10: SEM image (200X) of PEEK with 30% glass filled before Coating
5.5 SEM image of PEEK
Figure.11 shows the scanning electron micrograph image of PEEK before coating, when seen under low magnification (200X). It is observed that the phases are uniform with fine surface. Coating of HAP could not take place by plasma spray method, it may be due to material property.
Figure 11: SEM image (200X) of PEEK before Coating
5.6 SEM image of Polyurethane
Figure 12: SEM image (200X) of Polyurethane, before Coating
6. CONCLUSION
The plasma spray coating method is used which is, efficient and economical, method used to coat HAP successfully on SS316L, Ti-6Al-4V and Al2O3.With the help of SEM images before and after coating compared, it is observed that proper thickness up to 50 microns, given good bonding strength, feathery structure and phase purity was maintained on the substrate, providing excellent means for deposition. HAP could not be coated on PEEK and Polyurethane by plasma spray method may be because of its properties.
REFERENCES
[1] R.G. Mason journal of Biomedical Engineering of the New York Academy of MedicineVol. 48, No. 2, February 1972
[2] K. A. Khor, P. Cheang and Y. Wang JOM Journal of the Minerals, Metals and Materials Society, Volume 49,Number 2 / February, 1997, pp 51-57
[3] K. Prabakaran and S. Rajeswari, Trends Biomater.Artif.Organs, Vol 20(1), pp 20-23(2006).