Commentated case study
Design and development of a web-based
application for diabetes patient data
management
SS Deo
PhD Research Fellow, Molecular Biology Research Laboratory, Department of Zoology
DN Deobagkar
Director and Professor, Institute of Bioinformatics and Biotechnology; Professor, Department of Zoology
Deepti D Deobagkar
Head and Professor, Department of Zoology; Professor, Institute of Bioinformatics and Biotechnology
University of Pune, Pune, India
Introduction
Diabetes is a complex, multifactorial disease, which results from an interaction of both genetic and en-vironmental factors; it is known to run in families and clearly has a powerful genetic component.1,2 Type 1 diabetes is an autoimmune disease and accounts for about 5–10% of all diagnosed diabetes. Type 2 diabetes results from insulin resistance com-bined with relative insulin deficiency, which ac-counts for approximately 90–95% of diabetes cases. Prevalence of diabetes in adults worldwide is estim-ated to rise to 5.4% and the number of adults with diabetes in India is predicted to be 57.2 million by the year 2025.3
Local healthcare providers associated with the Dia-betic Association of India have multiclinics and path-ological laboratories. Several medical practitioners are associated with these organisations. Patients are treated by more than one specialist: a diabetologist, an ophthal-mologist, a cardiologist, and so on; availability of the complete patient record would be useful to these different specialists in rendering accurate treatment to the patient. The application described here has there-fore been developed with a view to satisfying the requirements of such multiclinics.
Diabetes is a disease where patients need to be mon-itored continuously for a number of parameters, for
ABSTRACT
A web-based database management system devel-oped for collecting, managing and analysing infor-mation of diabetes patients is described here. It is a searchable, client-server, relational database appli-cation, developed on the WindowsTM platform using Oracle, Active Server Pages (ASP), Visual Basic Script (VB Script) and Java Script. The software is menu-driven and allows authorised healthcare pro-viders to access, enter, update and analyse patient information. Graphical representation of data can be generated by the system using bar charts and pie charts. An interactive web interface allows users to query the database and generate reports. Alpha- and
beta-testing of the system was carried out and the system at present holds records of 500 diabetes patients and is found useful in diagnosis and treat-ment. In addition to providing patient data on a continuous basis in a simple format, the system is used in population and comparative analysis. It has proved to be of significant advantage to the health-care provider as compared to the paper-based system.
so on, in order to ascertain their response to particular medication. Simultaneously, the effect of environmental factors such as nutrition, stress and exercise must also be taken into account in the management of the disease. It would be efficacious if patient data could be mon-itored for these various aspects in a user-friendly fashion, with the searchable and relational aspects of this appli-cation providing particular advantage in collecting, maintaining, comparing and analysing data. Deriving significant relationships simultaneously among the sev-eral parameters then becomes feasible. The system described here offers efficient clinical data management while taking into account all the various parameters.
The treatment procedure for diabetic patients in-volves continuous monitoring, which produces a large volume of data.4This makes the paper-based system of patient records unmanageable; therefore computer-ising patient data is a major benefit for the manage-ment of patients with diabetes.5
This application provides instant access by author-ised healthcare providers to a patient’s electronic medical record. The user can access the complete medical record of a patient, including details of family history, medical history, symptoms, associated diseases, treat-ment and the details of pathology tests, over a period of time. The user can also view the results of various pathology tests in graphical format using bar charts and pie charts. Standard reports of the pathology tests and reports based on the query system can be gen-erated. Such a review of patient medical information enables a healthcare provider to give improved and appropriate treatment to the patient.
Technical specification
This is a relational database application based on client-server architecture.
. Pentium 3 . 256 MB RAM . 40 GB HDD
Software specification
. Operating system: Windows 2000 server . Backend: Oracle 8.0
. Languages: ASP, JavaScript, VBScript
. Client side browser: Internet Explorer 5.0 and
above/Netscape 4.7 and above
Design
Application design
An overview of the application design is shown in Figure 1.
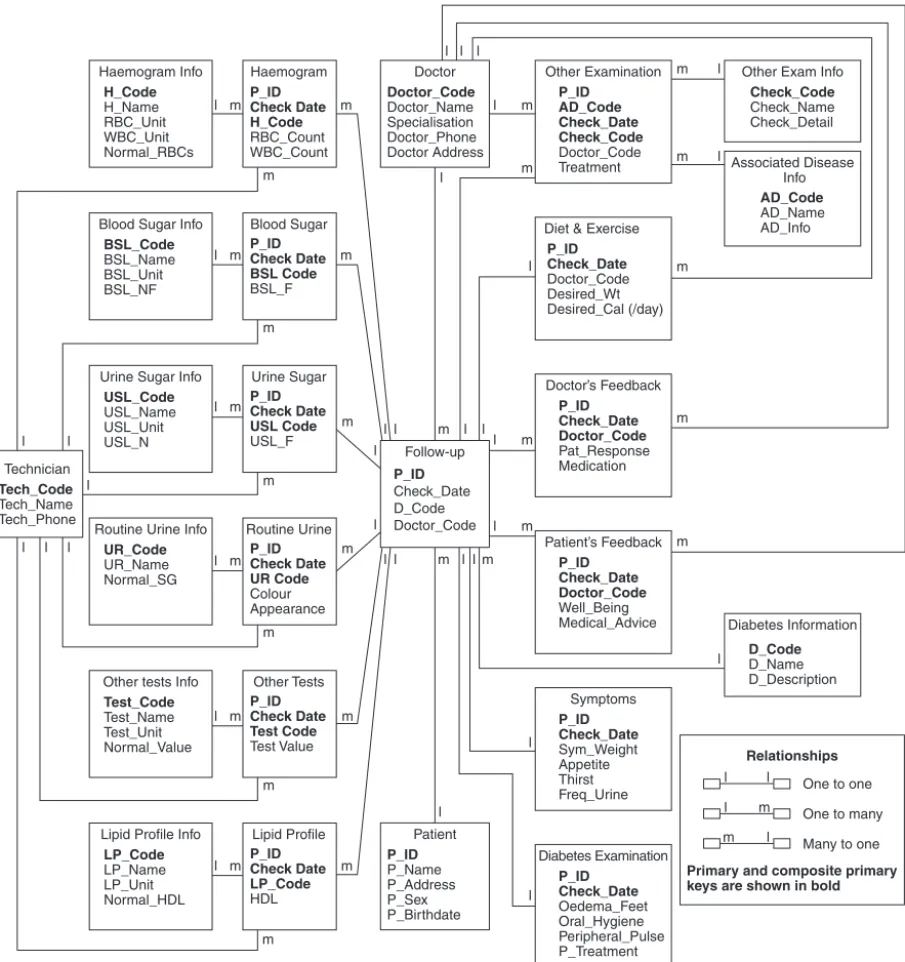
The Entity Relationship Diagram (see Figure 2) shows only the main attributes of a given entity. Thepatient
table holds the personal information about a patient. This table has a one-to-many relationship with the
follow-uptable. Thefollow-uptable has data about the date of visit of the patient, the type of diabetes the patient has, and the doctor code of the main diabetol-ogist who is treating the patient; this table has one-to-one relationships with thesymptomstable, thediabetes examination table and the diet and exercise table; many-to-one relationships with thedoctoranddiabetes informationtables, which contain data about each doc-tor’s personal details and diabetes types, respectively. Thefollow-uptable has one-to-many relationships with
other examination, doctor’s feedback,patient’s feedback
and all the tables that give the details of pathology tests.
Client (internet browser)
IIS web
server ADO
OLE-DB
ODBC
Oracle
ADO: Active X Data Object
OLE-DB: Object linking and Embedding Database
ODBC: Open Database Connectivity
Information about the treatment rendered to the patient is stored in two tables –diabetes examinationandother examination. This helps in providing an overview of the nature of any complications being treated, the line of medical treatment, and also the identity of the physician concerned. This set of information would be of great use in evaluation and analysis of the treatment of individual cases.
Database access and usage
This application has two modules – one is for data entry and the other is for database maintenance. Both
the modules are menu-driven and form-based, and are accessible only to authorised users.
The data entry module (see Figure 3) provides the interface for entering patient details such as personal details, family history, disease information, symp-toms, medical history, associated diseases and fol-low-up information about treatment and pathology tests. This module is accessible to medical specialists and laboratory technicians.
The screen in Figure 3 is displayed when the user logs in by entering a login name and password. In the main menu, under patient data, options for viewing and adding patient data as well as printing pathology test details are present. Using the ‘view’ option, the
Haemogram Info H_Code H_Name RBC_Unit WBC_Unit Normal_RBCs Other Examination P_ID AD_Code Check_Date Check_Code Doctor_Code Treatment
Other Exam Info
Check_Code Check_Name Check_Detail Associated Disease Info AD_Code AD_Name AD_Info Diabetes Information D_Code D_Name D_Description Doctor’s Feedback P_ID Check_Date Doctor_Code Pat_Response Medication Patient’s Feedback P_ID Check_Date Doctor_Code Well_Being Medical_Advice Symptoms P_ID Check_Date Sym_Weight Appetite Thirst Freq_Urine Diabetes Examination P_ID Check_Date Oedema_Feet Oral_Hygiene Peripheral_Pulse P_Treatment Diet & Exercise
P_ID Check_Date Doctor_Code Desired_Wt Desired_Cal (/day) Haemogram P_ID Check Date H_Code RBC_Count WBC_Count Doctor Doctor_Code Doctor_Name Specialisation Doctor_Phone Doctor Address Patient P_ID P_Name P_Address P_Sex P_Birthdate Follow-up P_ID Check_Date D_Code Doctor_Code Blood Sugar P_ID Check Date BSL Code BSL_F Urine Sugar P_ID Check Date USL Code USL_F Routine Urine P_ID Check Date UR Code Colour Appearance Other Tests P_ID Check Date Test Code Test Value Lipid Profile P_ID Check Date LP_Code HDL Blood Sugar Info
BSL_Code
BSL_Name BSL_Unit BSL_NF
Lipid Profile Info
LP_Code
LP_Name LP_Unit Normal_HDL Urine Sugar Info
USL_Code
USL_Name USL_Unit USL_N
Other tests Info
Test_Code
Test_Name Test_Unit Normal_Value Routine Urine Info
UR_Code UR_Name Normal_SG Technician Tech_Code Tech_Name Tech_Phone Relationships
One to one
One to many
Many to one
Primary and composite primary keys are shown in bold
l m l
l l l l l m l l l l l l l
l l l
l l l l l l l m m m m m m m l m m m m l m m m l m l l l l
l l l m m m m m m
l m m
m m l m m m l l l m l m
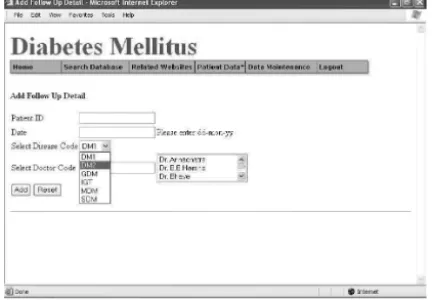
can display the entire record of a particular patient by inputting the patient number. The ‘graphs’ option enables the user to generate and print graphs by selecting appropriate sub-options. The ‘add’ option enables the user to add patient information and follow-up information (see Figure 4).
sonal information and Figure 6 displays the screen for inputting follow-up information.
Figure 7 is the screen that is displayed when the user clicks on the ‘add’ button of the follow-up form. This screen has links to add other details about the patient – disease details, symptoms, associated disease details, pathology test details and so on. When any of these options are clicked, for example ‘Add Disease Details’,
Figure 4 The ‘add’ option menu
Figure 3 The ‘view’ option menu
Figure 5 Personal information screen Figure 6 Follow-up information screen
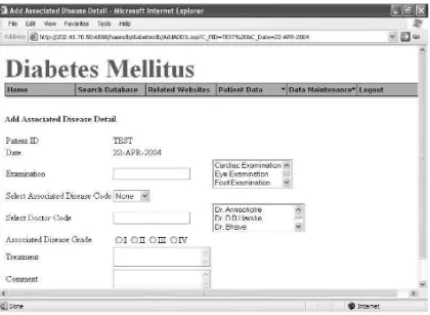
the input screen for that option is displayed (see Figure 8). The patient ID and the date need not be entered again; it remains the same as that entered in the follow-up form and remains till the user has entered all the information about that patient. Figure 9 is the input form for Associated Diseases.
The ‘view graph’ example is shown in Figures 10 and 11. The user can select options as shown in Figure
10 and a graph is generated (see Figure 11). The ‘print tests’ option enables the user to print the pathology test reports by entering the patient ID and the date (see Figure 12).
The database can be queried by selecting appropri-ate options. Figure 13 gives an example of a query form and Figure 14 is the output of the query.
Figure 9 Associated diseases screen Figure 10 Options for graph generation
Figure 11 Graphical display generated Figure 12 Print pathology details
system, as preparation of these types of reports is very time-consuming with paper. Other examples of poss-ible queries are:
. response to a particular drug/diet/exercise regimen
with reference to a particular patient or group of patients
. disease symptoms related to age of onset of disease . associated diseases with respect to age/sex/type of
diabetes.
The data maintenance module is accessible only to the database administrator. This module serves to edit patient information (see Figure 15). If any data entry error is made, it has to be reported to the adminis-trator who eventually corrects it. For example, for editing Disease Symptoms, the administrator can go to the particular record by entering patient ID and date, edit and save the record. It also provides data maintenance utilities, such as adding a user, updating disease codes and pathology test codes. For example, Figure 16 shows the screen for adding associated disease information. The disease code entered here appears in the drop-down list of the ‘Add Associated Disease’ information form. Updating disease codes and path-ology test codes follow the same logic. These codes can then be used in database queries; for example, the following query gives information about a patient with type 2 diabetes whose age of onset of disease is less than 30 years.
Query: Select distinct patient. P_ID, P_OnsetAge, D_Code from Patient, Follow_Up where P_OnsetAge < 30 and D_Code=‘DM2’ and Patient.P_ID= Follow_Up.P_ID
Both the modules offer the facility to generate graphs (see Figure 11) and reports (see Figure 12) according to the criteria entered, such as patient ID, date, test code and so on. The database can be queried on various criteria such as age of onset, sex, symptoms and medication (see Figures 13 and 14 for examples).
incorporated on each form to maintain data accuracy; for example, if alphabetic characters are entered where actually a numeric value or date should be entered, an error message is displayed and the user is unable to add and save the data.
Report generation
The system generates reports based on given criteria; for example, a blood sugar report under a specific medication over a period of time can be generated. Such reports are used by the medical practitioners while treating a patient, for example to decide on and regulate the dose of insulin. The system also generates day-to-day reports such as a Lipid Profile report, Haemogram and other pathology tests.
Database security
Multiple levels of security ensure confidentiality of patient data. Users are required to supply a valid user name and password before they can gain access to the database. Users can be limited to specific program areas determined by their user name. Maintaining a single central repository for all patient-based data minimises physical data security issues.
Testing and evaluation
Alpha-testing of the application was successfully car-ried out. Scientists and medical professionals carcar-ried out beta-testing, which was satisfactory. The system at present holds records of 500 diabetes patients and the
accuracy and correctness of each entry has been validated.
Implementation
This system has been implemented in a multiclinic where several medical specialists (diabetologist, cardi-ologist, podiatrist and so on) provide treatment for patients with diabetes. It also has a pathology labora-tory associated with it. The primary users of the system in this multiclinic are medical practitioners and lab-oratory technicians.
The medical practitioner can monitor a patient on a regular basis; with the help of graphs, patterns of changes are visible. Responses of a patient to a par-ticular drug are visualised simultaneously by different medical specialists by accessing the entire patient record at once. With the use of this application, the manage-ment of the data has become simple, appropriate and requires less effort than the paper systems. The graph-ical utility offered by the application has proved to be significant to the medical practitioners for easy mon-itoring of their patient profiles and for making com-parative assessments. The accuracy of the data entered has to be maintained with stringency, and this depends on the competence of the user entering the data, al-though validation checks and appropriate error mess-ages are incorporated on each form. The correctness of the data entered by the technician is verified by an authorised person in the pathology laboratory and the entries made by the medical practitioners have to be authenticated. However, a data entry error can be rectified by notifying the database administrator. Patients are allowed to view their own data, if they wish, by permission of the medical specialist con-cerned; moreover, patients could receive the treat-ment report and pathological test reports in the form of printouts regularly.
Discussion
This application enables healthcare providers to ren-der suitable and precise treatment to patients with diabetes, and enables continuous monitoring with the help of graphical representation and query generation to show, for example, the response of a patient to a particular drug over a period of time. Pharmaceutical companies, pharmaceutical professionals, research and development laboratories, population researchers and nutritionists can also use this database for various research purposes. Population researchers can accurately
keep follow-up information about patient cohorts for the required period. This database is currently being used for research in the areas of epidemiology/population genetics and clinical studies related to diabetes by gen-eticists and statisticians as it also holds information about family history of the patients, and it is fully searchable using particular criteria such as age of onset, sex, symptoms, associated diseases, severity and so on. Hospitals, healthcare personnel, diabetologists and path-ologists are finding the database extremely useful since it provides comprehensive and multicentre follow-up.
ACKNOWLEDGEMENTS
The authors thank Dr Ramesh Godbole and the Diabetic Association of India, Pune branch, for pro-viding the diabetes care information. We also thank the Bioinformatics Centre, University of Pune for providing the facility to develop the application. The technical help provided by Sanjay Londhe and Rahul Khandare, Bioinformatics Centre, University of Pune is also acknowledged.
REFERENCES
1 Pociot F and McDermott MF. Genetics of type 1 diabetes mellitus.Genes and Immunity2002;3(5):235–49. 2 Gloyn AL. The search for type 2 diabetes genes.Ageing
Research Reviews2003;2:111–27.
3 King H, Aubert RE and Herman WH. Global burden of diabetes, 1995–2025: prevalence, numerical estimates, and projections.Diabetes Care1998;21(9):1414–31.
4 Zarich SW. Treating the diabetic patient: appropriate care for glycemic control and cardiovascular disease risk factors.Reviews in Cardiovascular Medicine2003;4(Suppl. 6):S19–S28.
5 Deftereos S, Lambrinoudakis C, Andriopoulos P, Farmakis D and Aessopos A. A Java-based electronic healthcare record software for beta-thalassaemia.Journal of Medical Internet Research2001;3(4):E33.
CONFLICTS OF INTEREST
None.
ADDRESS FOR CORRESPONDENCE
Dr Deepti D Deobagkar Department of Zoology University of Pune Pune 411007 India
Tel: +91 202 560 1300/+91 202 569 8432 Fax: +91 202 569 0617
Email: [email protected]