ORIGINAL ARTICLE
Rapid total volatile organic carbon
quantification from microbial fermentation
using a platinum catalyst and proton transfer
reaction-mass spectrometry
Heidi R. Schoen
1,2, Brent M. Peyton
1,2and W. Berk Knighton
3*Abstract
A novel analytical system was developed to rapidly and accurately quantify total volatile organic compound (VOC) production from microbial reactor systems using a platinum catalyst and a sensitive CO2 detector. This system allows nearly instantaneous determination of total VOC production by utilizing a platinum catalyst to completely and quantitatively oxidize headspace VOCs to CO2 in coordination with a CO2 detector. Measurement of respiratory CO2 by bypassing the catalyst allowed the total VOC content to be determined from the difference in the two signals. To the best of our knowledge, this is the first instance of a platinum catalyst and CO2 detector being used to quantify the total VOCs produced by a complex bioreactor system. Continuous recording of these CO2 data provided a record of respiration and total VOC production throughout the experiments. Proton transfer reaction-mass spectrometry (PTR-MS) was used to identify and quantify major VOCs. The sum of the individual compounds measured by PTR-MS can be compared to the total VOCs quantified by the platinum catalyst to identify potential differences in detection, identi-fication and calibration. PTR-MS measurements accounted on average for 94 % of the total VOC carbon detected by the platinum catalyst and CO2 detector. In a model system, a VOC producing endophytic fungus Nodulisporium isolate TI-13 was grown in a solid state reactor utilizing the agricultural byproduct beet pulp as a substrate. Temporal changes in production of major volatile compounds (ethanol, methanol, acetaldehyde, terpenes, and terpenoids) were quanti-fied by PTR-MS and compared to the total VOC measurements taken with the platinum catalyst and CO2 detector. This analytical system provided fast, consistent data for evaluating VOC production in the nonhomogeneous solid state reactor system.
Keywords: Fungal endophyte, Proton transfer reaction-mass spectrometry, Solid state fermentation, Total volatile organic carbon
© 2016 The Author(s). This article is distributed under the terms of the Creative Commons Attribution 4.0 International License (http://creativecommons.org/licenses/by/4.0/), which permits unrestricted use, distribution, and reproduction in any medium, provided you give appropriate credit to the original author(s) and the source, provide a link to the Creative Commons license, and indicate if changes were made.
Introduction
Fungi and bacteria produce hundreds of volatile organic compounds (VOCs) with industrial applications includ-ing biofuels, insecticides, quorum sensinclud-ing and biocontrol, flavor and aroma compounds, antibacterials and anti-fungals (Hung et al. 2015; Kai et al. 2009; Morath et al.
2012; Strobel 2014). Bioprospecting has identified many new microorganisms that produce valuable VOCs, and the types and amounts of these compounds often change with substrate, culturing conditions and growth phase (Bunge et al. 2008; Kai et al. 2009; Morath et al. 2012; Strobel 2014). Higher yields of most microbial VOCs must be achieved to make these bioprocesses industri-ally viable, but fast and accurate analytical methods to determine the type and amount of VOCs produced are lacking (Morath et al. 2012). Efficient ways to screen new and genetically modified strains, and changes in culture
Open Access
*Correspondence: [email protected]
3 Department of Chemistry and Biochemistry, Montana State University, 103 Chemistry and Biochemistry Building, PO Box 173400, Bozeman, MT 59717, USA
conditions, are required to rapidly identify improvement to VOC yields (Morath et al. 2012).
Solid phase microextraction (SPME) coupled with gas chromatography–mass spectrometry (GC–MS) has been used to identify compounds produced by microbial fermentation (Mallette et al. 2012; Morath et al. 2012). With little sample preparation, SPME GC–MS readily identifies VOCs using compound libraries, but does a poor job of quantifying the amounts of compounds pro-duced (Luchner et al. 2012; Mallette et al. 2012; Morath et al. 2012) and is not well suited to screen for increased yields of VOCs. Traditional extraction techniques to con-centrate VOCs can be time intensive, and large organic solvent volumes may lead to poor resolution of volatile compounds (Kai et al. 2009; Morath et al. 2012). Fur-ther, extraction techniques may identify fewer VOCs than SPME GC–MS (Kai et al. 2009; Morath et al. 2012). Another analytical method, proton nuclear magnetic resonance can quantify VOCs quickly, but has poor sen-sitivity, cannot determine carbon length and some oxy-genated VOCs cannot be measured because signals are confounded with sugar peaks (Mallette et al. 2014).
Proton transfer reaction-mass spectrometry (PTR-MS) is an effective analytical technique for measuring VOCs in the headspace of both liquid and nonhomogeneous solid state microbial reactor systems (Bunge et al. 2008; Ezra et al. 2004b; Luchner et al. 2012; Mallette et al. 2012). With PTR-MS, many VOCs can be quantified down to the 10–100 parts per trillion range with reliable results (Biasioli et al. 2011; de Gouw et al. 2003; Lindinger et al. 1998). PTR-MS provides data quickly including a likely compound identification, without the extensive prepara-tory laboraprepara-tory work required for extractions (Ammann et al. 2004; Luchner et al. 2012). With real-time gas phase measurement capability, the PTR-MS readily ties VOC data to experimental conditions and temporal changes, and can non-invasively utilize reactor off-gas for meas-urements (Luchner et al. 2012; Romano et al. 2015).
Previously, PTR-MS has been used to explore microbial systems, but estimates of error in VOC quantification can be between 15 and 40 % depending on system condi-tions (Bunge et al. 2008; Ezra et al. 2004b; Luchner et al. 2012; Mallette et al. 2012; Romano et al. 2015; Schmid-berger et al. 2014; Singer et al. 2009). Quantification of total VOC production with PTR-MS can be improved with calibration, but significant uncertainties may remain due to compounds that are not readily detected by PTR-MS (e.g. alkanes) and complex mixtures where multiple compounds with different sensitivity (calibration) factors contribute to the same mass to charge ratio.
Alternatively, the platinum catalyst and sensitive CO2 detector provide a robust VOC quantification system (Baasandorj et al. 2015; Veres et al. 2010) that confidently
provides the total amount of gas phase organic carbon in complex mixtures of VOCs produced by microbial sys-tems. The platinum catalyst oxidizes VOCs completely to CO2, which allows a sensitive CO2 detector to accu-rately quantify the total VOC production in real-time, as well as record respiratory CO2. This accurate VOC total can be used to quantify headspace carbon for carbon bal-ances and as a real-time process monitoring tool. Addi-tionally, the total VOC measurements can be compared to less certain total quantifications performed with other instruments, such as PTR-MS, to identify discrepancies in the system. To the best of our knowledge, this is the first time the combination of a platinum catalyst and CO2 detector has been used to quantify total headspace VOC production from a complex bioreactor system.
This paper demonstrates total VOC quantification in a non-homogenous solid state reactor system, where both growth phase and VOC data can be cumbersome to col-lect (Desgranges et al. 1991; Krishna 2005). The system described here provides a virtually instantaneous method for quantifying total VOC production.
Materials and methods Experimental setup
Figure 1 provides a schematic of the experimental setup. The platinum catalyst, CO2 detector and PTR-MS sam-pled approximately 200 mL/min of the diluted reac-tor off-gas stream. The flow path was alternated every 3 h using an automated three-way valve to flow either directly to the CO2 detector to measure respiratory CO2 only or through the VOC oxidizing platinum cata-lyst and then to the CO2 detector, measuring CO2 from both VOCs and fungal respiration. The PTR-MS sampled both the gas steams that entered and bypassed the plati-num catalyst once per day. Gas flow that passed through the catalyst was measured to verify complete removal of VOCs from the gas steam and as a background with which to compare the bypass flow stream PTR-MS meas-urements. Three biological replicate experiments were performed to assess the reproducibility of the system.
Solid state fungal reactor system
experiments were run for approximately 5 days each until total VOC production approached zero.
The solid state reactor (see Fig. 1) was continuously sparged with 100 mL/min of hydrated medical grade compressed air. The air was delivered via a stainless steel tube (0.5 cm I.D.) running to the bottom center of the reactor. Inlet air pressure forced reactor gas out of the top of the reactor. Reactor off-gas was then diluted with 900 mL/min of dry medical grade air to keep water from condensing in the system and to keep concentrations within the linear range of the CO2 detector and PTR-MS. A portion of the diluted flow stream, ~200 mL/min, was then pulled through the CO2 detector and PTR-MS with the PTR-MS diaphragm pump.
Microorganism
Nodulisporium isolate TI-13 was discovered as an endo-phyte of Cassia fistula in the highlands of Thailand using established collection and isolation methods as described previously (Ezra et al. 2004a). The TI-13 ITS1-5.8 S-ITS2
ribosomal gene sequence is available in GenBank as KJ558391, and the filamentous fungus is stored as sample NRRL 50502 in the Agriculture Research Service Culture Collection at the US Department of Agriculture (Nigg et al. 2014). The fungus was characterized as having the perfect stage of Hypoxylon sp. and as Nodulisporium sp. based on ITS1-5.8 S-ITS2 ribosomal gene sequence information (Nigg et al. 2014).
Growth conditions
Inoculum cultures were generated by growing the fungus on potato dextrose agar until hyphae covered ≥60 % of the plate surface. A 20 % glycerol solution (10 mL) was added to each plate, scraped with a sterile glass rod and the suspended fungal biomass solution was collected. The solution was mixed thoroughly, added to Microbank microbead vials, and stored at −80 °C until use.
The composition of the inoculum medium was 60 g/L glucose and 0.5 g/L yeast extract. Two hundred and fifty millilitre of sterile filtered (0.22 µm) medium was added
Gas Cylinder Medical Grade
Air
Reactor
Diluon Stream Hydraon Flask
Excess Gas Vent
CO2
Detector Valve Planum
Catalyst
VOC CO2
PTR-MS CO2from
Respiraon + VOCs
CO2from
Respiraon
Fig. 1 Experimental setup for monitoring VOC production from a fungal solid state reactor. Hydrated air was sparged through the bottom of the
to 500 mL sterile baffled flasks. Three microbeads were added to each inoculum culture and grown for 9 days at 160 rpm and 30 °C. All inoculum flasks were cov-ered with sterile Kimguard (Kimberly-Clark; Roswell, GA, USA) to allow gas exchange, but prevent microbial contamination.
CO2 detector calibration and verification
An LI-840 CO2/H2O non-dispersive infrared gas analyzer (Li-cor Biosciences; Lincoln, NE, USA), quantified CO2 in the reactor off-gas continuously without impacting it. This optical technique is non-destructive and allowed the PTR-MS to be placed in series after the CO2 detector. The CO2 detector was calibrated using a certified CO2 free gas standard to set the zero point (1 % methane, bal-ance nitrogen Scotty Analyzed Gases, Plumsteadville, PA, USA) and another gas standard for the span (a gas stand-ard of 1010 ppm CO2, balance nitrogen, Scotty Ana-lyzed Gases, Plumsteadville, PA, USA). Linearity of the CO2 detector was assessed by diluting the gas standard (1010 ppm CO2, balance nitrogen) with medical grade compressed air using mass flow controllers to produce final CO2 concentrations of 50.5, 101, 505 and 1010 ppm. The CO2 detector response agreed with the prepared gas standard to within 3.3 % for the four values measured, with values creating a line with a slope of 1.0006 and an R2 value of 0.9998 when plotting measured concentration versus expected concentration (data not shown).
Platinum catalyst VOC conversion verification
Complete oxidation of VOCs to CO2 by a heated plati-num catalyst (Shimadzu, Kyoto, Japan, High Sensitivity Catalyst 630-00996 maintained at 400 °C) was confirmed by diluting a gas standard (0.1 % propane, balance air, Cal Gas Direct, Huntington Beach, CA, USA) and medi-cal grade compressed air with mass flow controllers to produce final propane concentrations in the range of 10–100 ppm, which spanned the total VOC concentra-tion presented to the catalyst in the diluted sample flow. Based on the tenfold dilution of the bioreactor effluent and accounting for the three carbons in propane, this experiment produced a test matrix that was equivalent to total bioreactor VOC concentration of 300–3000 ppm C. Overall, the platinum catalyst and CO2 detector meas-urement agreed with the gas standard for conversion of propane to CO2 by the platinum catalyst to within 5 % for the four measured values, and created a line with a slope of 0.95 and an R2 value of 0.9991 when measured concen-tration was plotted against expected concenconcen-tration. The catalyst exhibited near complete conversion efficiency for propane concentrations up to 50 ppm of propane, which decreased to 95 % at the highest, 100 ppm test point. This experiment established the effective maximum
working concentration of the employed catalyst system at 1500 ppm C after adjusting for dilution. Catalyst systems employing higher temperatures and greater amounts of catalyst could be used to achieve higher maximum work-ing concentrations. Similar catalyst systems have been used previously to confirm concentrations of calibration gases with high accuracy (Baasandorj et al. 2015; Veres et al. 2010).
Bioreactor measurements
The reactor off-gas flow path was alternated with a valve on a 3 h timer to run either directly to the CO2 detector or through the platinum catalyst to oxidize VOCs to CO2 before the CO2 detector. By alternating the air stream either around or through the platinum catalyst every 3 h, a near-continuous record of respiratory CO2 and total gas phase carbon (CO2 and VOC) production was created for each experiment. The CO2 detector measurement was recorded once per second during the experiments. Background CO2 and VOCs measurements for each tank of medical grade compressed air were subtracted from these values.
Proton transfer reaction‑mass spectrometry (PTR‑MS)
PTR-MS was used to provide compositional informa-tion about the VOCs in the reactor off-gas. PTR-MS uses H3O+ ions to protonate molecules (e.g. VOCs) with pro-ton affinities greater than water (Lindinger et al. 1998). The singly charged ions are then typically detected as protonated molecules (ions with a mass-to-charge ratio, m/z, equal to the molecular weight plus 1 for the pro-ton) by a quadrupole mass spectrometer (Lindinger et al. 1998). Identity is assigned based on the mass of the ion and prior knowledge of the likely products of a specific reactor system (Luchner et al. 2012). Constituents of air like O2, N2 and CO2 have proton affinities lower than water so are not protonated and do not interfere with measurements. Alkanes also have proton affinities lower than water, so PTR-MS does not efficiently detect alkanes (Lindinger et al. 1998).
(m45) and terpenes and terpenoids (m137) were used, respectively. The off-gas of the abiotic control and fungal cultures were both analyzed by the PTR-MS. The total VOCs measured in the abiotic control were subtracted from the fungal VOC production measurements.
Ethanol PTR‑MS calibration
Ethanol calibrations were performed using a calibrated permeation tube (KIN-TEK; La Marque, TX, USA) at a variety of humidity values approaching dry air as the experiments were performed with 90 % dry air. Com-pressed air (19.5 mL/min) was sparged through a tem-perature-controlled oven (50 °C) holding a calibrated ethanol permeation tube (emission rate 209 ng/min at 50 °C). Mass flow controllers were used to control medi-cal grade compressed air flowing through the permeation tube and a second dilution stream, introduced after the permeation tube, to produce concentrations of 101, 199, 484 and 924 ppb of ethanol based on the calibrated per-meation tube emission rate. The concentration of ethanol produced with the permeation tube was checked using the platinum catalyst system as described previously (Baasandorj et al. 2015) resulting in a line with a slope of 1.1 and an R2 value of 0.997 (data not shown). The tem-perature of the permeation tube was then increased to 80 °C to produce ethanol concentrations comparable to those observed in the fungal experiment (1.2–6.2 ppm). The humidity of the air was varied by utilizing a hydra-tion flask before the diluhydra-tion. Humidity was monitored via the ratio of the H3O+(H2O) to H3O+ ion intensities with calibration experiments performed under condi-tions that closely matched the humidity in the fungal experiments. At low humidity, the sensitivity factor had a relatively constant value of approximately 4.0. Calibra-tions were repeated after the experiments and yielded a sensitivity factor of approximately 3.9.
Results
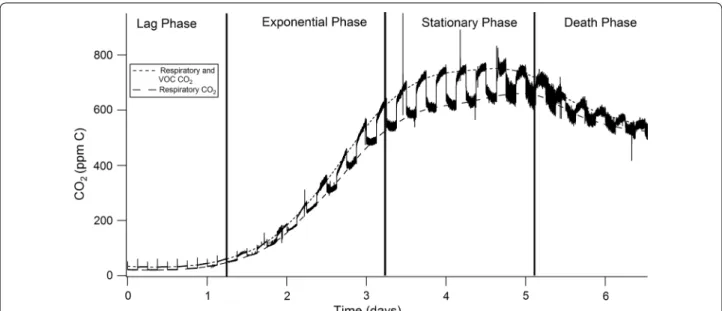
The record of respiratory CO2 and VOCs plus respiratory CO2 is shown as Fig. 2. The platinum catalyst oxidized these VOCs nearly completely to CO2 as demonstrated by the ±5 % conversion of propane to CO2 verification performed as described above. Additionally, no break-through was detected by the PTR-MS when the reactor off-gas was passed through the platinum catalyst, beyond decreasing system memory effects. The stair step shape of the CO2 data reflects the change of flow paths between going straight from the reactor to the CO2 detector, quantifying respiratory CO2 as the lower dashed line, and oxidation of VOCs to CO2 by the platinum catalyst before the CO2 detector, quantifying the sum of respira-tory and VOC CO2 as the upper dotted line. The LOESS function of IGOR 6 (Wavemetrics; Portland, OR), a
nonparametric regression method that smooths using locally weighted regression, was utilized to interpolate the lower line yielding a continuous respiratory CO2 record. The shape of the respiration lower line follows a typical growth curve and was used to estimate lag, expo-nential, stationary and death phases as shown in Fig. 2. Also, the lower line was integrated to determine the total amount of respiratory CO2 produced in parts per million carbon (ppm C) during each experiment and was then converted to the mass of carbon using the flow rate, tem-perature and pressure of the system. Similarly, the upper line, representing the sum of VOC production and res-piratory CO2 in ppm C, was interpolated with the LOESS function to yield a continuous upper line. The lower line was subtracted from the upper line at each point in time to determine the VOC production in ppm C (Fig. 3). The area under the VOC production curve can be integrated to find the total amount of VOCs produced during the experiment in ppm C, which can then be converted to the mass of carbon using the flow rate, temperature and pressure of the system.
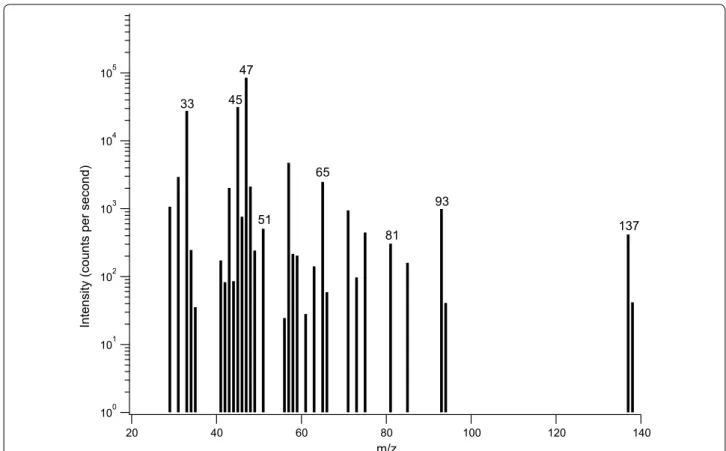
Figure 3 shows the total VOCs quantified by the plati-num catalyst and CO2 detector, which were extracted from Fig. 2 as described above. The sections of the bars displayed in Fig. 3 represent the relative carbon fractions of the major products as quantified by PTR-MS (as deter-mined from spectra such as Fig. 4): ethanol, methanol, acetaldehyde, monoterpenes, and terpenoids (see Addi-tional file 1: Table S1 for raw data). The predominant compound produced was ethanol in this and most of the samples. Total VOC production, as well as individual compound measurements, varied with growth phase of the fungus.
and small but increased amounts of several other ions (less than one percent of total ion intensity each) were detected in death phase spectra (data not shown).
The compounds quantified by the PTR-MS (acetalde-hyde, ethanol, methanol and terpenes) were multiplied by their carbon number and summed to determine the
total concentration of VOCs in ppm C. This concentra-tion was then divided by the total VOC producconcentra-tion in ppm C determined by the platinum catalyst and CO2 detector to calculate recovery as shown by the height of the bars compared to one on the right axis in Fig. 3. Ide-ally, recovery ratios would be 1.0 if the PTR-MS detected
Fig. 2 A representative CO2 profile of a fungal solid state reactor experiment after correcting for dilution. The lower line represents respiratory CO2
as indicated by the interpolated dashed line and the upper line is the sum of respiratory and oxidized VOC CO2 as represented by the interpolated dotted line. Values switch between respiratory CO2 and CO2 from both fungal metabolism and VOCs every 3 h. The graph is split into growth phases based on the shape of the respiratory CO2 curve
Fig. 3 VOC production in the fungal reactor based on platinum catalyst VOC conversion to CO2 during experiment 3 corrected for dilution. Phase
all carbon containing compounds in the headspace. The average recovery ratio observed here was 0.945 ± 0.047 (average and standard error; see Additional file 1: Table S1) indicating that any unidentified VOC products con-stitute only a small fraction of the total VOC production. Recovery ratios were furthest from 1.0 at lag and death phases. Total VOC production was also lowest dur-ing lag and death phases, so small inaccuracies in CO2 concentration differences between bypass and catalyst measurements likely contributed to the recovery ratio error. Additionally, multiple small intensity ion signals that were not quantified appeared in death phase, which is expected due to cellular degradation and changing metabolism (Hazelwood et al. 2008). Fungal production of small concentrations of alkanes, which are undetecta-ble by the PTR-MS, and small errors in calibration of the CO2 detector and PTR-MS may also contribute to errors in total quantification.
Two types of deviations from the anticipated response appeared in the CO2 detector signals later in the experi-ments. “Rolling” deviations in the CO2 signal were observed when switching between modes in which the signal exhibited some hysteresis and was slow to achieve
a steady measurement immediately following the change in flow paths. This is most readily apparent starting in late-exponential phase (about 60 h) as observed in Fig. 2. The rolling characteristic was observed only in this exper-imental set and is likely due to pressure variations that occurred when switching between lines. Yegneswaran et al. (1990) observed similar patterns of CO2 concentra-tions and determined they were caused by small pres-sure changes in the bioreactor, but quickly returned to steady state. This type of deviation could be avoided by using two CO2 detectors. Additionally, some noise was observed in the infrared based CO2 measurements start-ing in late stationary phase and increased until the end of the experiments, but no cause was determined for this deviation. While this deviation persisted in later experi-ments, a definitive cause has not been determined. The combined momentary inaccuracies are estimated at less than 5 % of the signal, and do not significantly influence total VOC calculations for the majority of each experi-ment. During death phase, these perturbations were larger compared to the total signal and may contribute to less accurate death phase VOC recovery results.
100 101 102 103 104 105
Intensity (counts per second
)
140 120
100 80
60 40
20
m/z 47
65
93
33 45
51 137
81
Fig. 4 PTR-MS spectrum for experiment 3 (119 h) where background VOCs, reactor off-gas air sampled through the catalyst, have been subtracted
Respiratory CO2, VOC production and reproducibility
Three biological replicate experiments were performed to assess the reproducibility of the system. Total respiratory CO2, total organic carbon in the headspace (from VOCs) and substrate percentage of carbon converted to VOCs and CO2 were very reproducible for the three experi-ments. The total amount of respiratory CO2 produced was 0.73 ± 0.040 carbon g with three biological
repli-cates (average and standard error) calculated by integrat-ing the lower respiratory CO2 line in Fig. 2 as described above. Total VOC production was calculated in an anal-ogous fashion by integrating data such as that shown in Fig. 3. Overall, 0.087 ± 0.0055 carbon g of total VOC
were produced in each experiment. The average amount of beet pulp carbon (43 % carbon) (Stoppok and Buch-holz 1985) converted to respiratory CO2 and VOCs was 3.8 ± 0.19 %. A biomass measurement assay was not
uti-lized in these experiments. Whole experiment headspace selectivity was calculated as 0.12 ± 0.0080 by dividing the
VOCs by the respiratory CO2 as measured by the CO2 detector throughout the experiment as described above.
Discussion
The combination of PTR-MS, platinum catalyst and sen-sitive CO2 detector allowed for real-time VOC sampling with a quantitative determination of the compounds pro-duced. The system described provides a robust measure-ment of the total VOC production as well as composition of major species produced by the non-homogenous solid state reactor system. To the best of our knowledge, this is the first time the total gas phase VOC content of a solid state reactor has been reported.
The platinum catalyst provides an accurate measure-ment of total headspace VOC production in complex microbial systems. Catalyst systems are effective at oxi-dizing nearly all the VOCs present in a sample, and are routinely used to purify air of VOCs for background measurements in PTR-MS (de Gouw and Warneke 2007) and to measure total organic carbon (Sugimura and Suzuki 1988). The platinum catalyst and CO2 detec-tor agreed with the propane gas standard to within 5 % in our verification, and similar systems used to verify gas calibration standards agree to within 4–5 % of standards (Baasandorj et al. 2015; Veres et al. 2010). Catalyst sys-tems are more accurate at measuring VOCs under many conditions than other detection systems currently avail-able, such as PTR-MS and GC–MS (Ammann et al. 2004; Baasandorj et al. 2015; de Gouw et al. 2003; Kajos et al. 2015; Veres et al. 2010). An accurate total VOC measure-ment allows confident determination of the fraction one compound represents in a VOC mixture. Also, the plati-num catalyst and CO2 detector are an affordable system to accurately quantify total headspace VOC carbon and
respiratory CO2 for carbon balances. However, the plati-num catalyst and CO2 detector do not provide any infor-mation on the identity of the VOCs present in a sample.
The platinum catalyst can also be used as an assess-ment tool to determine if the majority of VOCs produced are being detected, accurately identified and accurately quantified by the PTR-MS. A difference in the total VOC content determined by the platinum catalyst and CO2 detector from that provided by the PTR-MS can alert the user to check for issues such as the following: additional ions with significant carbon content may need to be quantified in the PTR-MS spectrum, some compounds (e.g. alkanes) are not being detected, sensitivity factors may be inaccurate, or identification of the VOC precur-sor responsible for part or all of an ion’s intensity may be incorrect. Ideally, all but one of these issues would be ruled out using prior system knowledge before using this assessment tool to identify discrepancies in PTR-MS VOC quantification. In this system, the PTR-MS total VOC content agreed on average to within 5.5 ± 4.7 % of that determined with the platinum catalyst and CO2 detector, which is considered to be excellent agreement. This level of agreement suggests that the PTR-MS quan-tification is providing an accurate measurement of VOC composition and that there are no significant errors in the calibration of the four major products, especially the detailed calibration of the major product, ethanol. The system described here is rapid and efficient at measur-ing the composition of VOCs with high confidence com-pared to other available measurement methods.
This total VOC quantification system can be applied in many different types of bioreactors. Bioremediation projects could utilize the detection system to quantify VOC removal in soil, water, or air samples. This system has applications in screening VOC producing organ-isms, VOC yield changes from varying process condi-tions, identifying appropriate target genes for genetic engineering and verifying increased VOC production in genetically engineered strains. The VOC measurement system could also be used for online process monitor-ing of bioreactors (Schmidberger et al. 2014), especially in solid state reactor systems where accurate and imme-diate online measurements are extremely difficult (Lui 2013). Similarly, many novel biological systems under study present challenges to traditional rapid monitoring methods, where complications with standard methods arise from a number of conditions such as complex car-bon sources, fungi growing with pellet morphology and biofilms. These systems can benefit from utilizing the method described here to provide additional metabolic data in real-time.
Authors’ contributions
WBK designed the experiments. HRS performed experiments and drafted the manuscript. All three authors interpreted data and edited the manuscript. All authors read and approved the final manuscript.
Author details
1 Department of Chemical & Biological Engineering, Montana State University, 305 Cobleigh Hall, PO Box 173920, Bozeman, MT 59717, USA. 2 Center for Bio-film Engineering, Montana State University, 366 Barnard Hall, P.O. Box 173980, Bozeman, MT 59717, USA. 3 Department of Chemistry and Biochemistry, Montana State University, 103 Chemistry and Biochemistry Building, PO Box 173400, Bozeman, MT 59717, USA.
Acknowledgements
This research was supported in part by the National Science Foundation (NSF) EFRI Program under Grant No. 0937613. Any opinion, findings and conclusions or recommendations expressed in this material are those of the authors and do not necessarily reflect the views of the NSF. Thank you to the Montana State University Center for Biofilm Engineering, the Chemistry and Biochemis-try Department and the Chemical and Biological Engineering Department for support. The authors would also like to thank Drs. Gary Strobel and Natasha Mallette for sound technical advice.
Competing interests
The authors declare that they have no competing interests.
Funding
This research was supported in part by the National Science Foundation (NSF) EFRI Program under Grant No. 0937613, as well as the Montana State University Chemistry and Biochemistry Department, Chemical and Biological Engineering Department, and Center for Biofilm Engineering.
Additional file
Additional file 1: Table S1. Ethanol, methanol, acetaldehyde and terpene quantification data as measured by PTR-MS for each experiment and the abiotic control. Recovery ratios are also provided for each set of measurements.
Ethical approval
This article does not contain any studies with human participants or animals performed by any of the authors.
Received: 25 September 2016 Accepted: 28 September 2016
References
Ammann C, Spirig C, Neftel A, Steinbacher M, Komenda M, Schaub A (2004) Application of PTR-MS for measurements of biogenic VOC in a deciduous forest. Int J Mass Spectrom 2–3:87–101. doi:10.1016/j.ijms.2004.08.012 Baasandorj M, Millet DB, Hu L, Mitroo D, Williams BJ (2015) Measuring acetic
and formic acid by proton-transfer-reaction mass spectrometry: sensitiv-ity, humidity dependence, and quantifying interferences. Atmos Meas Tech 3:1303–1321. doi:10.5194/amt-8-1303-2015
Biasioli F, Gasperi F, Yeretzian C, Märk TD (2011) PTR-MS monitoring of VOCs and BVOCs in food science and technology. TrAC Trends Anal Chem 7:968–977. doi:10.1016/j.trac.2011.03.009
Bradford MM (1976) A rapid and sensitive method for the quantitation of microgram quantities of protein utilizing the principle of protein-dye binding. Anal Biochem 1–2:248–254. doi:10.1016/0003-2697(76)90527-3 Bunge M, Araghipour N, Mikoviny T, Dunkl J, Schnitzhofer R, Hansel A, Schinner
F, Wisthaler A, Margesin R, Märk TD (2008) On-line monitoring of microbial volatile metabolites by proton transfer reaction-mass spectrometry. Appl Environ Microbiol 7:2179–2186. doi:10.1128/AEM.02069-07
Crespo E, Cristescu SM, de Ronde H, Kuijper S, Kolk AHJ, Anthony RM, Harren FJM (2011) Proton transfer reaction mass spectrometry detects rapid changes in volatile metabolite emission by Mycobacterium smegmatis after the addition of specific antimicrobial agents. J Microbiol Methods 1:8–15. doi:10.1016/j.mimet.2011.01.025
de Gouw J, Warneke C (2007) Measurements of volatile organic compounds in the earth’s atmosphere using proton-transfer-reaction mass spectrom-etry. Mass Spectrom Rev 26:223–257. doi:10.1002/mas.20119 de Gouw J, Warneke C, Karl T, Eerdekens G, van der Veen C, Fall R (2003)
Sensitivity and specificity of atmospheric trace gas detection by proton-transfer-reaction mass spectrometry. Int J Mass Spectrom. doi:10.1016/ S1387-3806(02)00926-0
Desgranges C, Vergoignan C, Georges M, Durand A (1991) Biomass estimation in solid state fermentation I. Manual biochemical methods. Appl Micro-biol Biotechnol 2:200–205. doi:10.1007/BF00184686
Ezra D, Hess WM, Strobel GA (2004a) New endophytic isolates of Muscodor albus, a volatile-antibiotic-producing fungus. Microbiology 12:4023–4031. doi:10.1099/mic.0.27334-0
Ezra D, Jasper J, Rogers T, Knighton B, Grimsrud E, Strobel G (2004b) Proton transfer reaction-mass spectrometry as a technique to measure volatile emissions of Muscodor albus. Plant Sci 6:1471–1477. doi:10.1016/j. plantsci.2004.01.022
Hazelwood LA, Daran J-M, van Maris AJ, Pronk JT, Dickinson JR (2008) The Ehr-lich pathway for fusel alcohol production: a century of research on Sac-charomyces cerevisiae metabolism. Appl Environ Microbiol 8:2259–2266. doi:10.1128/AEM.02625-07
Hung R, Lee S, Bennett JW (2015) Fungal volatile organic compounds and their role in ecosystems. Appl Microbiol Biotechnol 8:3395–3405. doi:10.1007/ s00253-015-6494-4
Kai M, Haustein M, Molina F, Petri A, Scholz B, Piechulla B (2009) Bacterial vola-tiles and their action potential. Appl Microbiol Biotechnol 6:1001–1012. doi:10.1007/s00253-008-1760-3
Kajos MK, Rantala P, Hill M, Hellén H, Aalto J, Patokoski J, Taipale R, Hoerger CC, Reimann S, Ruuskanen TM, Rinne J, Petäjä T (2015) Ambient measure-ments of aromatic and oxidized VOCs by PTR-MS and GC-MS: intercom-parison between four instruments in a boreal forest in Finland. Atmos Meas Tech 10:4453–4473. doi:10.5194/amt-8-4453-2015
Krishna C (2005) Solid-state fermentation systems—an overview. Crit Rev Biotechnol 1–2:1–30. doi:10.1080/07388550590925383
environmental research. Int J Mass Spectrom Ion Process 3:191–241. doi:10.1016/s0168-1176(97)00281-4
Luchner M, Gutmann R, Bayer K, Dunkl J, Hansel A, Herbig J, Singer W, Strobl F, Winkler K, Striedner G (2012) Implementation of proton transfer reaction-mass spectrometry (PTR-MS) for advanced bioprocess monitoring. Biotechnol Bioeng 12:3059–3069. doi:10.1002/bit.24579
Lui L (2013) Process engineering of solid-state fermentation. CRC Press, Boca Raton
Mallette N, Pankratz EM, Parker AE, Strobel GA, Busse SC, Carlson RP, Peyton BM (2014) Evaluation of cellulose as a substrate for hydrocarbon fuel production by Ascocoryne sarcoides (NRRL 50072). J Sustain Bioenergy Syst 01:33–49. doi:10.4236/jsbs.2014.41004
Mallette ND, Knighton WB, Strobel GA, Carlson RP, Peyton BM (2012) Resolu-tion of volatile fuel compound profiles from Ascocoryne sarcoides: a com-parison by proton transfer reaction-mass spectrometry and solid phase microextraction gas chromatography–mass spectrometry. AMB Express 1:23. doi:10.1186/2191-0855-2-23
Morath SU, Hung R, Bennett JW (2012) Fungal volatile organic compounds: a review with emphasis on their biotechnological potential. Fungal Biol Rev 2–3:73–83. doi:10.1016/j.fbr.2012.07.001
Nigg J, Strobel G, Knighton WB, Hilmer J, Geary B, Riyaz-Ul-Hassan S, Harper JK, Valenti D, Wang Y (2014) Functionalized para-substituted benzenes as 1,8-cineole production modulators in an endophytic Nodulisporium spe-cies. Microbiology 8:1772–1782. doi:10.1099/mic.0.079756-0
Romano A, Capozzi V, Spano G, Biasioli F (2015) Proton transfer reaction-mass spectrometry: online and rapid determination of volatile organic compounds of microbial origin. Appl Microbiol Biotechnol 9:3787–3795. doi:10.1007/s00253-015-6528-y
Schmidberger T, Gutmann R, Bayer K, Kronthaler J, Huber R (2014) Advanced online monitoring of cell culture off-gas using proton transfer reaction mass spectrometry. Biotechnol Prog 2:496–504. doi:10.1002/btpr.1853 Singer W, Gutmann R, Dunkl J, Hansel A (2009) PTR-MS technology for process
monitoring and control in biotechnology. J Process Anal Chem 1:1–4 Stoppok E, Buchholz K (1985) Continuous anaerobic conversion of sugar beet
pulp to biogas. Biotechnol Lett 2:119–124. doi:10.1007/BF01026682 Strobel GA (2014) Methods of discovery and techniques to study endophytic
fungi producing fuel-related hydrocarbons. Nat Prod Rep 2:259–272. doi:10.1039/C3NP70129H
Sugimura Y, Suzuki Y (1988) A high-temperature catalytic oxidation method for the determination of non-volatile dissolved organic carbon in seawater by direct injection of a liquid sample. Mar Chem 24:105–131. doi:10.1016/0304-4203(88)90043-6
Veres P, Gilman J, Roberts J, Kuster W, Warneke C, Burling I, Gouw Jd (2010) Development and validation of a portable gas phase standard genera-tion and calibragenera-tion system for volatile organic compounds. Atmos Meas Tech 3:683–691. doi:10.5194/amt-3-683-2010