Proceedings of the
5th International Workshop on
Formal Methods for Interactive Systems
(FMIS 2013)
Stochastic Modelling and Analysis of Driver Behaviour
Antonio Cerone Yishi Zhao
13 pages
Guest Editors: Judy Bowen, Steve Reeves
Managing Editors: Tiziana Margaria, Julia Padberg, Gabriele Taentzer
Stochastic Modelling and Analysis of Driver Behaviour
Antonio Cerone1 2∗ Yishi Zhao1 3 †
1UNU-IIST — International Institute for Software Technology
United Nations University, Macau SAR China
Dipartimento di Informatica, University of Pisa, Pisa, Italy
Abstract: Driver behaviour is considered a key factor in the majority of car ac-cidents. As a consequence driver behaviour has been receiving vast attention in different domain areas, such as psychology, transport engineering and computer science. Computer scientists are primarily interested in what and how computing means can be applied to understand the relation between driver behaviour and trans-port systems. In this paper, we adopt a stochastic approach to conduct a quantitative investigation of driver behaviour. We use the Markovian process algebra PEPA (Per-formance Evaluation Process Algebra) to describe the overall system model. The system component describing the topology and dynamic of the traffic is composed in parallel with the system component describing the driver state and its evolution due to experience. We illustrate our approach using a three-way junction as an ex-ample and present the numerical results of the system analysis.
Keywords:stochastic model, quantitative analysis, Markovian process algebra, Per-formance Evaluation Process Algebra (PEPA), driver behaviour.
1
Introduction
Driver behaviour has been widely studied for several decades, during which a plethora of em-pirical models have been developed. Although throughout the years there was a progression from skill-based models to motivational models, risk models [Sum96] up to more articulated models characterised by the cooperation of complementary cognitive processes, such as auto-maticity versus attention [Ran94], perception of task difficulty versus driver capability [Ful05] and intentionality versus actual behaviour [DT11], no convergence has been achieved toward a comprehensive driving model yet. Recently, empirical models of driver behaviour have been integrated with formal approaches. Shaikh and Krishnan [SK12] model the interactions between a driver and a semi-autonomous vehicle using the C programming language and verify the safety of such interaction using model checking. In another formal approach, Cerone [Cer11] proposes a process algebraic framework to characterise the interplay between automaticity and attention and apply it to driver behaviour.
∗now at IMT Institute for Advanced Studies, Lucca, Italy.
While the above models aim primarily to driver behaviour prediction for accident preven-tion, some recent models also investigate behavioural adaptation to be considered in the human-centered design of Intelligent Transport Systems (ITS). In this context, Schaapet al.[SHAB08] use a driving simulator to investigate the role of unexpected events in driver behavioural adap-tation, while Dia [Dia02] proposes an agent-based approach to model response of drivers to real-time travel information and the consequent effect on driver behaviour.
This paper proposes a formal approach to modelling driver behavioural adaptation as the effect of driver experience. We adopt a stochastic approach and focus on experiences, such as a possible collision, that tend to have just temporary effects on driver behaviour. We use the Markovian process algebra PEPA (Performance Evaluation Process Algebra) to describe the overall system model.
The remainder of this paper is organised as follows. In Section2we briefly introduce Marko-vian process algebra PEPA. In Section3we use a three-way junction as a case study to illustrate our modelling approach. In Section 4 we present and discuss numerical results of stochastic simulation and steady state analysis conducted using the PEPA Eclipse plug-in toolset [Tri07]. Finally, in Section5we draw our conclusion and propose directions for future work.
2
PEPA
PEPA [Hil96] is a Markovian Process Algebra. It supports actions that occur with rates that are negatively exponentially distributed. Specifications written in PEPA represent Markov processes and can be mapped to a continuous time Markov chain (CTMC). Population level metrics can be derived by a set of scalable analysis techniques.
Systems are specified in PEPA in terms of activities andcomponents. An activity (α,r) is described by an actionα, i.e. the type of the activity, and the rater of the associated negative
exponential distribution. This rate may be either specified by a positive real number or left unspecified by using symbol>.
The syntax for describing components is as follows.
(α,r).P|P+Q|P/L|PBC
L Q|A
Component(α,r).Pperforms actionαat raterand with delay or duration 1/rand then behaves
likeP. ComponentP+Qbehaves either likePor likeQ, the resultant behaviour being given by the first activity to complete. ComponentP/Lbehaves exactly likePexcept that the activities in the setLare concealed, their type is not visible and instead appears as the unknown typeτ.
Concurrent components can be synchronised,PBC
L Q, such that activities in the cooperation
setL involve the participation of both components. In PEPA the shared activity occurs at the slowest of the rates of the participants and, if a rate is unspecified in a component, the component is passive with respect to activities of that type.
3
Case Study
One Way
West East
South
Figure 1: Three-Way Junction
Let us consider the three-way junction in Figure 1, in which we assume right-hand traffic. The three-way junction consists of one two-way main road along the east-west direction and a south-ward one-way road. Cars from the West have two options when they arrive at the junction: go straight or turn right. Similarly, cars from the East have two options: go straight and turn left. The junction has no traffic light. Cars travelling along the east-west main road do not need to give way to turning traffic. Cars from the West turning right also do not need to give way. Cars from the East turning left must give way to cars travelling straight from the West along the east-west main road.
We assume that the probability for the driver from the East turning left to follow the give way rule depends on various factors such as maturity of the driver (e.g., novice or expert), situational conditions (e.g., being in a hurry or distracted), physical conditions (e.g., fatigue, stress, effects of alcohol [Ful05]).
3.1 Basic Model
In our basic model we consider a fixed number of cars for each of the two directions (from the East and from the West) and we “feed” each car back to the initial state after a certain time.
Cars travelling from the West on the main road are modelled in PEPA as follows.
CarW
def
= (arrivalW,Pstraight∗rarrivalW).CarW straight
+ (arrivalW,(1−Pstraight)∗rarrivalW).CarW right
CarW right
def
= (turnrightW,rturnrightW).CarW passed
CarW straight
def
= (enterW,renterW).CarW exit
CarW exit
def
= (exitW,rexitW).CarW passed
CarW passed
def
Initially cars coming from the West are in stateCarW. ActionarrivalWdenotes a car approaching
the junction from the West with probabilityPstraight to go straight by performing a transition to
stateCarW straight, and with probability 1−Pstraight to turn right by performing a transition to
stateCarW right.
In stateCarW right, a car turning right is modelled by actionturnrightWwith transition to state
CarW passed. This action models the fact that such a car turns right directly, without basically
entering the junction.
In state CarW straight, a car going straight does not need to give way when entering the
junction (actionenterW with transition to stateCarW exit). However, the driver is aware of cars
from the West waiting to turn left, and will drive through the junction with some degree of caution. The extent of caution depends on the value ofrenterW: the higher the renterW rate, the
lower the driver’s caution.
In stateCarW exit, the car exits the junction (actionexitW), with transition to stateCarW passed,
in which actionnop models all unspecified actions performed before the next approach to the junction (transition back to initial stateCarW). Rate rexitW associated with action exitW models
the average time 1/rexitW spent by the car within the junction; raternop associated with action nopmodels the period 1/rnopwith which the car approaches the crossing again.
Cars travelling from the East on the main road are modelled in PEPA as follows.
CarE
def
= (arrivalE,(1−Ple f t)∗rarrivalE).CarE straight
+ (arrivalE,Ple f t∗rarrivalE).CarE le f t
CarE straight
def
= (gostraightE,rgostraightE).CarE passed
CarE le f t
def
= (enterE,renterE).CarE exit
CarE exit
def
= (exitE,rexitE).CarE passed
CarE passed
def
= (nop,rnopE).CarE
Initially cars coming from the East are in stateCarE. ActionarrivalE denotes a car approaching
the junction from the East, with probability 1−Ple f t to go straight by performing a transition
to stateCarE straight, and with probabilityPle f t to turn left by performing a transition to state
CarE le f t.
In stateCarE straight, a car going straight is modelled by actiongostraightE, with transition
to stateCarE passed. This action models the fact that such a car goes straight without basically
entering the junction.
In stateCarE le f t, a car turning left is modelled by action enterE, with transition to state
CarE exit.
In stateCarE exit, the car exits the junction (actionexitE) by performing a transition to state
CarE passed, in which action nop models all unspecified actions performed before the next
approach to the junction (transition back to initial stateCarE). RatesrexitE andrnopplay the same
roles as ratesrexitW andrnopin the model of the car from the West.
ProcessesCarW andCarE describe the behaviour of the cars just in terms of their directions
with choices of routes dictated by probabilities (PstraightandPle f t). We now need to model
conditions. Therefore we introduce processJunctionmodelled as follows.
Junction =def (enterW,renterW).Junction busyW
+ (enterE,(1−Pgiveway)∗renterE).Junction busyE
Junction busyW
def
= (exitW,rexitW).Junction
+ (enterE,(1−Pbrake)∗renterE).PCollision
Junction busyE
def
= (exitE,rexitE).Junction
+ (enterW,(1−Pbrake)∗renterW).PCollision
PCollision =def (exitW,rexitW).(exitE,rexitE).Junction
+ (exitE,rexitE).(exitW,rexitW).Junction
Initially the junction is in stateJunction. The junction can be either entered by a car from the West with actionenterW and transition to stateJunction busyW or by a car from the East with
actionenterEand transition to stateJunction busyE. Since a car turning left must give way when
entering the junction, raterenterE, which is associated with actionenterE, is decreased by factor
1−Pgiveway, wherePgiveway∈(0,1)is the probability that the driver actually gives way. Which
action, between enterW andenterE, is more likely to occur (win the competition) depends on
the ratesrenterW and(1−Pgiveway)∗renterE. Thus, the higher the probabilityPgivewaythat the car
from the East gives way, the lower the probability that actionenterE wins the competition, that
is, the lower the probability that the car from the East enters the junction first and the higher the time spent by that car in the queue for turning left. There may be various reasons why the driver fails to give way: driver’s general attitude, being in a hurry or distracted, or abnormal physical conditions of the drivers such as stress, fatigue or effect of alcohol.
We assume that at most one car from each of the two directions, from the West going straight and from the East turnig left, can be inside the junction at one time. Alternatively we could model the junction as a buffer with a limited capacity, but this would make the model more complex without adding anything in terms of methodology and would possibly obscure important aspects of the model.
Under this assumption, in stateJunction busyW, either the car from the West exits the junction
(action exitW), with transition to the initial state Junction, or a car from the East enters the
junction (actionenterE), with transition to statePCollision. The second choice is less likely than
the first one and is due to the driver failing to brake after realising that there is a car from West already inside the junction. Such a behaviour of the driver may be due to distraction or abnormal physical conditions of the drivers such as stress, fatigue or effect of alcohol; certainly it cannot be due to driver’s attitude or being in a hurry. Moreover, automatic reaction by the driver normally tend to increase the probability to brake. Therefore, ifPbrake∈(0,1) is the probability that the
driver brakes, we normally assume Pbrake >Pgiveway. Thus rate renterE is decreased by factor
1−Pbrake, that is, the probability that the driver fails to brake.
In state Junction busyE, either the car from the East exits the junction (actionsexitE), with
transition to the initial stateJunctionor a car from the West enters the junction (actionenterW),
with transition to statePCollision. RaterenterW is decreased by factor 1−Pbrake.
collision exit the junction in any order as modelled by the interleaving of actionsexitW andexitE
in statePCollision, with a transition back to initial stateJunction. We are not modelling what would happen in case of collision; in fact our goal is to describe a continuous behaviour which includes states where collisions are possible and analyse the probabilities of these “unwanted” states to be reached under a variety of conditions.
The overall system consists ofNcars from the West andMcars from the East that synchronise with theJunctionprocess over actionsenterW,exitW,enterE andexitE.
System1
def
= (CarW[N]||CarE[M])BC
L Junction
whereL ={enterW,exitW,enterE,exitE}.
In terms of evaluation, we are interested in the probability of possible collisions, the average waiting time in a queue from arrival at the junction to finally passing the junction and the av-erage number of cars waiting in a queue (traffic load). Those metrics are derived respectively by analysing the probability of state PCollision, the average time from the occurrence of
ac-tion enterW (or enterE) and action exitW (or exitE), and the average number of cars in states
CarW straight andCarE le f t.
3.2 Modelling Driver’s Experience
The basic model described in Section3.1takes into account the status of the driver only in terms of fixed probabilities of giving way and failing to brake. In this section we extend the model by considering how experiences encountered while driving may affect the behaviour of the driver. In particular, we model the effect of an event in which the driver from the West is not given way by a driver from the East turning left and experiences therefore a possible collision. We can assume that the future behaviour of the driver from the West is affected by such an event with probabilityPa f f ected. In general the effect is that the driver will be more cautious when
approaching the junction next time. This is modelled by processDriverStateW as follows.
DriverStateW
def
= (enterW,renterW).FoundFreeW
+ (enterE,(1−Pgiveway)∗renterE).FoundBusyW
FoundFreeW
def
= (exitW,rexitW).DriverStateW
+ (enterE,Pa f f ected∗(1−Pgiveway)∗renterE).A f f ectedW
+ (enterE,(1−Pa f f ected)∗(1−Pgiveway)∗renterE).NotA f f ectedW
FoundBusyW
def
= (exitE,rexitE).DriverStateW
+ (enterW,Pa f f ected∗(1−Pbrake)∗renterW).A f f ectedW
+ (enterW,(1−Pa f f ected)∗(1−Pbrake)∗renterW).NotA f f ectedW
NotA f f ectedW
def
= (exitE,rexitE).(exitW,rexitW).DriverStateW
+ (exitW,rexitW).(exitE,rexitE).DriverStateW
A f f ectedW
def
= (exitE,rexitE).(exitW,rexitW).EvaluateW
EvaluateW def
= (enterW,(1−Pcautious)∗renterW).FoundFreeW
+ (enterE,(1−Pgiveway)∗renterE).AlertW
AlertW
def
= (exitE,rexitE).EvaluateW
+ (enterW,(1−Pcautious)∗Pa f f ected∗(1−Pbrake)∗renterW).A f f ectedW
+ (enterW,(1−Pcautious)∗(1−Pa f f ected)∗(1−Pbrake)∗renterW).NotA f f ectedW
Initially the driver from the West is in stateDriverStateW, may found the junction free and enter it
with actionenterW by performing a transition to stateFoundFreeW. Alternatively, a driver from
the East may enter the junction first with actionenterE, making it busy — hence a transition to
stateFoundBusyW.
In stateFoundFreeW there are three possible choices: the driver from the West exits the
junc-tion (acjunc-tionexitW), with transition to the initial stateDriverStateW; a driver from the East enters
the junction (actionenterE) with probabilityPa f f ected, affecting the future behaviour of the driver
from the West through transition to stateA f f ectedW; a driver from the East enters the junction
(actionenterE) with probability 1−Pa f f ected and transition to stateNotA f f ectedW, without any
effect on the future behaviour of the driver from the West.
In stateFoundBusyW there are three possible choices: the driver from the East exits the
junc-tion (acjunc-tion exitE), with transition to the initial state DriverStateW; the driver from the West
enters the junction (action enterW) with probability Pa f f ected and has an experience of
possi-ble collision affecting future behaviour — hence a transition to stateA f f ectedW; a driver from
the West enters the junction (action enterE) with probability 1−Pa f f ected and has an
experi-ence of possible collision without any effect on future behaviour — hexperi-ence a transition to state
NotA f f ectedW .
In states NotA f f ectedW andA f f ectedW drivers exit the junction in any order through the
interleaving of actionsexitWandexitE with transition to stateDriverStateWand stateEvaluateW,
respectively.
In state EvaluateW, the next entry of the driver from the West to the junction is modelled
by associating actionenterW with a decrease of raterenterW by factor 1-Pcautious∈(0,1), which
represents the extra caution of the driver (due to the possible collision experienced the previous time). Such extra caution consists in evaluating whether it is safe to allow a driver turning left to go first. If this driver is allowed to go first, then actionenterE occurs with transition to state
AlertW; otherwise the driver from the West enters the free junction with an occurrence of action
enterW and a transition to stateFoundFreeW.
In stateAlertW, the junction is busy with the driver from the East turning left. The cautious
driver from the West may enter the junction with actionenterW associated with a strong decrease
of rate renterW by (1-Pcautious)∗(1−Pbrake)∈(0,1), which represents the extra caution of the
driver (due to the possible collision experienced the previous time). Such extra caution consists in being alert to check for a possible driver turning left who is already in the junction. If the driver from the West manages to allow the turning driver to exit the junction first, then action
exitE occurs with transition to stateEvaluateW, in which the driver from the West may possibly
cautiously enter the junction.
The transition from stateEvaluateW to stateFoundFreeW ensures that the effect of the
the fact that a driver from the West, who enters the junction cautiously due to a previous expe-rience of possible collision and, at the same time, expeexpe-riences another possible collision, may (transition to stateA f f ectedW) or may not (transition to stateNotA f f ectedW) be affected next
time.
More realistically, we could assume that the effect of experiencing a possible collision lasts for a few re-entries to the junction, but gradually decreases at each re-entry until it totally dis-appears after a number k of re-entries without any further experiences of possible collisions. Therefore, we replace probabilityPcautiouswith a set of probabilities{Pi}i=1,...k⊆(0,1)such that
Pi>Pi+1for eachi=1, ...k−1 and processesFoundFreeW,EvaluateWandAlertW withktriples
of processesFoundFree(i)W,Evaluate(i)W andAlert(i)W, withi=1, ...k.
ProcessesDriverStateW is re-defined as follows.
DriverStateW
def
= (enterW,renterW).FoundFree(1)W
+ (enterE,(1−Pgiveway)∗renterE).FoundBusyW
ProcessesFoundBusyW is unchanged and processFoundFree(1)W is defined as follows.
FoundFree(1)W
def
= (exitW,rexitW).DriverStateW
+ (enterE,Pa f f ected∗(1−Pgiveway)∗renterE).A f f ectedW
+ (enterE,(1−Pa f f ected)∗(1−Pgiveway)∗renterE).NotA f f ectedW
ProcessNotA f f ectedW is unchanged and processA f f ectedW is re-defined as follows.
A f f ectedW
def
= (exitE,rexitE).(exitW,rexitW).Evaluate(1)W
+ (exitW,rexitW).(exitE,rexitE).Evaluate(1)W
For eachi=1, ...k−1, processEvaluate(i)W is defined as follows.
Evaluate(i)W
def
= (enterW,(1−Pi)∗renterW).FoundFree(i+1)W
+ (enterE,(1−Pgiveway)∗renterE).Alert(i)W
After the driver from the West enters the junction (actionenterW) with caution characterised by
probability 1−Pi, there is a transition toFoundFree(i+1)W in which the driver from the West
may exit the junction (action enterW) with transition to stateEvaluateW(i+1), in which
de-creased caution (Pi+1<Pi) is characterised by a higher probability (1−Pi+1>1−Pi) of entering
the junction.
For eachi=1, ...k, processAlert(i)W is defined as follows.
AlertW(i)
def
= (exitE,rexitE).Evaluate(i)W
+ (enterW,(1−Pi)∗Pa f f ected∗(1−Pbrake)∗renterW).A f f ectedW
+ (enterW,(1−Pi)∗(1−Pa f f ected)∗(1−Pbrake)∗renterW).NotA f f ectedW
Note that the transitions fromAlertW(i)toA f f ectedW and then toEvaluate(1)W reset the
For eachi=2, ...k−1, processesFoundFree(i)W is defined as follows.
FoundFree(i)W
def
= (exitW,rexitW).Evaluate(i+1)W
+ (enterE,Pa f f ected∗(1−Pgiveway)∗renterE).A f f ectedW
+ (enterE,(1−Pa f f ected)∗(1−Pgiveway)∗renterE).NotA f f ectedW
Finally, processEvaluate(k)W is defined as follows.
Evaluate(k)W
def
= (enterW,Pk∗renterW).FoundFree(1)W
+ (enterE,(1−Pgiveway)∗renterE).Alert(k)W
In stateEvaluate(k)WactionenterWis associated with the lowest probability factorPkand causes
a transition to stateFoundFree(1)W in which the driver from the West may exit the junction
(ac-tionexitW) with transition to stateDriverState, in which the caution induced by the experienced
possible collision has totally disappeared.
We must remark that we do not need to associate drivers with specific cars because we are investigating the average behaviour of drivers rather than behaviours of individual drivers.
The overall system that includes driver experience is defined as follows.
System2
def
=DriverStateW[N]BC
L (CarW[N]||CarE[M])BCL Junction
whereL ={enterW,exitW,enterE,exitE}.
We can observe that we could remove driver reactions from the Junction process by using pure rates (without probability factors 1−Pgiveway and 1−Pbrake associated with rates). In this
way, process Junctionwould just model topology and capacity of the junction, while process
DriverStateW would model all aspects of driver reaction and experience, but the overall
sys-tem behaviour would not change. Finally, we can observe that the first version of process
DriverStateW presented at page 6 is equivalent to the instantiation with k=1 of the general
model presented at page8.
4
Numerical Results and Discussion
In this section we present the evaluation of the overall modelSystem2, which includes driver’s experience, defined in Section3.2. In all experiments we instantiate the general model of process
DriverStateW presented at page8withk=3.
the fact that the time for cars to re-approach the junction is much longer than the duration of all actions performed to drive across the junction.
Probability factors are set as follows.
Pgiveway Pbrake Pa f f ected Pstraight Ple f t Pcautious P1 P2 P3
0.1–0.8 0.1–0.9 0.5 0.5 0.5 0.8 0.8 0.5 0.1
withPgiveway<Pbrake, normally instantiated asPgiveway=0.6 andPbrake=0.9.
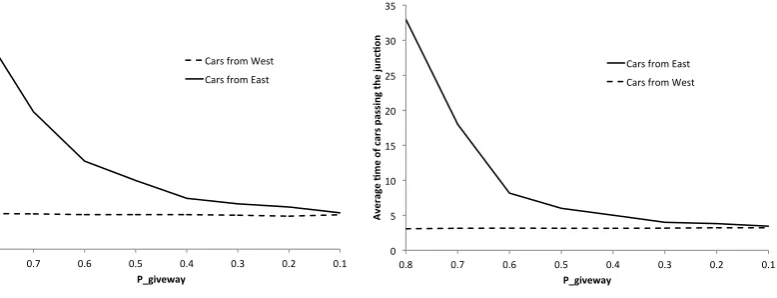
In Figures2and3we show the results of simulations with fixedN=M=30 andPbrake=0.9,
0 0.2 0.4 0.6 0.8 1 1.2 1.4 1.6 1.8
0.8 0.7 0.6 0.5 0.4 0.3 0.2 0.1
Num
be
r of
wai-ng c
ar
s
P_giveway
Cars from West Cars from East
Figure 2: Average number of waiting cars with variable probabilityPgivewayof giving way;
fixed parametersN=M=30 andPbrake=0.9. 0 5 10 15 20 25 30 35
0.8 0.7 0.6 0.5 0.4 0.3 0.2 0.1
Av
er
ag
e
(m
e
of
c
ar
s
pa
ss
in
g
th
e
ju
nc
(o
n
P_giveway
Cars from East Cars from West
Figure 3: Average waiting time at the junction with variable probabilityPgivewayof giving way;
fixed paramentersN=M=30 andPbrake=0.9.
and with variablePgiveway. We can observe that
• both the average number of waiting cars (Figure2) and the average waiting time at the junction (Figure3) are stable and very low for cars from the West going straight,
whereas, for cars from the East turning left,
• the average number of waiting cars (Figure2) rapidly decreases when probabilityPgiveway
of giving way decreases from 0.8 to about 0.4;
• the average waiting time (Figure3) rapidly decreases when probabilityPgivewaydecreases
from 0.8 to about 0.6, but then both only slightly decrease whenPgivewayfurther decreases.
In Figures4and5we show the results of simulations with fixedN=M=30 andPgiveway=0.6,
and with variablePbrake. The average number of waiting cars (Figure4) is
• almost stable and low for cars from the West going straight;
• moderately decreasing in an almost steady way for cars from the East turning left.
The average waiting time at the junction (Figure5) is
0 0.1 0.2 0.3 0.4 0.5 0.6 0.7 0.8 0.9 1
0.9 0.7 0.5 0.3 0.1
Num
be
r of
wai-ng c
ar
s
P_brake
Cars from West Cars from East
Figure 4: Average number of waiting cars with variable probabilityPbrake; fixed
parame-tersN=M=30 andPgiveway=0.6.
0 1 2 3 4 5 6 7 8 9
0.9 0.7 0.5 0.3 0.1
Av
er
ag
e
(m
e
of
c
ar
s
pa
ss
in
g
th
e
ju
nc
(o
n
P_brake
Cars from East Cars from West
Figure 5: Average waiting time at the junc-tion with variable probabilityPbrake; fixed
para-mentersN=M=30 andPgiveway=0.6.
These outcomes are quite obvious: it is the fact of giving way to increase the lenght of a queue and the waiting time rather than the braking reaction when observing a car already in the junction; moreover, if giving way occurs when it is not necessary, because the car is still too far (modelled by values ofPgiveway close to 1), as in the case of a novice, lenght of the queue and
waiting time increase quite rapidly.
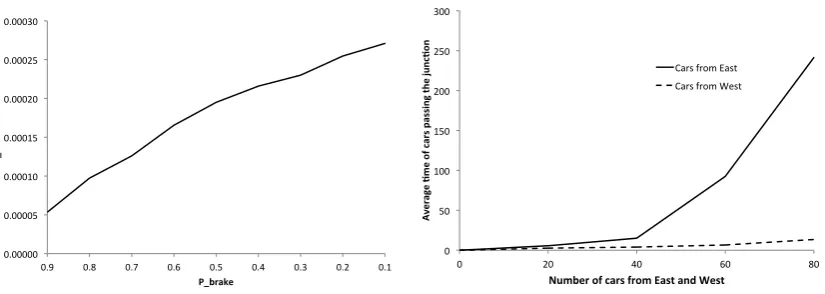
In Figure6we show the results of steady state analysis with fixedN=M=3 andPgiveway=
0.00000 0.00005 0.00010 0.00015 0.00020 0.00025 0.00030
0.9 0.8 0.7 0.6 0.5 0.4 0.3 0.2 0.1
P_P Co lli si on
P_brake
Figure 6: Probability of possible collision with variable probabilityPbrakeof braking; fixed
pa-rametersN=M=3 andPgiveway=0.6.
0 50 100 150 200 250 300
0 20 40 60 80
Av
er
ag
e
(m
e
of
c
ar
s
pa
ss
in
g
th
e
ju
nc
(o
n
Number of cars from East and West
Cars from East Cars from West
Figure 7: Average waiting time at the junction with variable number of cars M and N; fixed parametersPgiveway=0.6 andPbrake=0.9.
0.6, and with variablePbrake. We normally assumePbrake =0.9, which corresponds to 0.00005
probability of possible collision. However, such probability strongly increases under abnormal physical conditions of the drivers such as stress, fatigue or effect of alcohol. Our experiments show that whenPbrake=0.1, the probability of possible collision increases to 0.00026, that is,
0.00000787). This reflect the reality that abnormal physical conditions of drivers (especially ef-fect of alcohol) have a much higher impact on the likelihood of collision than frequent failures of giving way (which is a sort of “culturally endemic” in some areas).
In Figure 7 we observe that the waiting time is not significantly affected by the increased number of cars from the East when these are less than 40, but rapidly increases for number larger than 40. This shows that, if the topology and capacity of the junction are modelled accurately, our simulation approach may provide a way to predict the level of traffic that would cause congestion.
5
Conclusion and Further Work
In this paper, we have shown how quantitative aspects of driver behaviour can be modelled with Markovian process algebra PEPA and analysed using the PEPA Eclipse plug-in toolset. The methodology was applied to a case study given by a three-way junction consisting of a two-way main road with a diverging one-two-way road. The analysis was performed using stochastic simulation with 30 cars from each direction and steady state analysis with 3 cars from each direction. The results show a trade-off between junction performance (reflected in number of cars in a queue and waiting time) and safety (reflected in probability of possible collision) under certain conditions on driver behaviour.
One way to overcome the state space explosion encountered in steady state analysis with more than 3 cars for each direction is to parse the output of a sufficient number of stochastic simu-lations and extract probabilistic data concerning a given set of states. This is part of our future work. Furthermore, we plan to improve the scalability of the analysis using model simplification and approximation and adopting some scalable analysis techniques.
We have modelled the effects of driver’s experience in terms of state transitions associated with a finite number of pre-defined probability factors. In future work we aim to extend our model with the use of functional rate, that is, rate depending on the real time state of the overall system. This would support the modelling of behavioural adaptation as a continuous function of experience. Although none of the currently available tools directly support functional rate a number of techniques may be used to solve functional rate using PEPA Eclipse plug-in [ZT09].
Acknowledgements: This work has been supported by Macao Science and Technology Devel-opment Fund, File No. 07/2009/A3, in the context of the EAE project.
Bibliography
[Cer11] A. Cerone. Closure and Attention Activation in Human Automatic Behaviour: A Framework for the Formal Analysis of Interactive Systems. In Proceedings of the
4th International Workshop on Formal Methods for Interactive Systems. Electronic
Communications of the EASST 45. 2011.
[Dia02] H. Dia. An agent-based approach to modelling driver route choice behaviour under the influence of real-time information. Transportation Research Part C-emerging
[DT11] A. Doshi, M. M. Trivedi. Tactical Driver Behavior Prediction and Intent Inference: A Review. In14th International IEEE Conference on Intelligent Transportation Sys-tems. Pp. 1892–1897. 2011.
[Ful05] R. Fuller. Towards a General Theory of Driver Behaviour. Accident Analysis and
Prevention37:461–472, 2005.
[Hil96] J. Hillston.A Compositional Approach to Performance Modelling. Cambridge Uni-versity Press, 1996.
[Ran94] T. Ranney. Models of Driving Behaviour: A review of their evolution.Accid. Annal.
and Prev26(6):733–750, 1994.
[SHAB08] T. W. Schaap, A. R. A. van der Horst, B. van Arem, K. A. Brookhuis. Drivers’ reactions to sudden braking by lead car under varying workload conditions; towards a driver support system.IET Intelligent Transport Systems2(4):249–257, 2008.
[SK12] S. Shaikh, P. Krishnan. A Framework for Analysing Driver Interactions with Semi-Autonomous Vehicles. InProceedings First International Workshop on Formal
Tech-niques for Safety-Critical Systems. Electronic Proceedings in Theoretical Computer
Science 105, pp. 85–99. Kyoto,Japan, Nov. 2012.
[Sum96] H. Summala. Accident Risk and Driver Behaviour.Safety Science22:103–117, 1996.
[Tri07] M. Tribastone. The PEPA Plug-in Project. InProceedings of the 4th International
Conference on the Quantitative Evaluation of SysTems (QEST). Pp. 53–54. IEEE,
2007.
[ZT09] Y. Zhao, N. Thomas. Experiences of Using the PEPA Performance Modelling Tools with a non-repudiation protocol. In Al-Akaidi (ed.), The European Simulation and