ADSORPTION OF ARSENIC(V) ONTO METAL LOADED
CELLULOSE NANOCOMPOSITE BEAD (MCNB)-ISOTHERM
AND THERMODYNAMIC STUDY
Dhiman Santra,
[a]Rubi Ghosh,
[a]Mridula Das,
[b]Parshati Majumdar,
[a]Mitali Sarkar*
[a]Keywords: Metal loaded cellulose nanocomposite bead; batch study; arsenic adsorption; isotherm; water analysis.
Cellulose nanocomposite bead modified with metal (MCNB) such as Ce, Al and Fe is synthesized for selective adsorption of arsenate anions As(V) from drinking water in batch system. The adsorbent was characterized by FTIR, FESEM, EDS and EPR studies. In the present report arsenic(V) adsorption performance on cerium modified cellulose bead was described. The maximum adsorption of As(V) is near about 100 percent up to an initial arsenic load of 5.0 mg L-1 at the acidic pH of 3.0 and
the equilibrium is reached in 5 h. The much higher adsorption extent and quick equilibrium time compared to the other reported adsorbents makes the present adsorbent as efficient one. Among the three adsorption isotherm models used, Langmuir model fitted the experimental data best. The adsorption is found to be exothermic, spontaneous and random in nature. The process was applied for removal of arsenic from some real sample.
Corresponding Authors Tel: 091 033 2582 8750 Fax: 091 033 2582 8282
E-Mail: [email protected]; [email protected] [a] Department of Chemistry, University of Kalyani, Kalyani
741 235, INDIA
[b] Kalna College, Kalna, Burdwan, 713409, INDIA
Introduction
Arsenic (As) contamination in ground water is one of the most critical environmental problems today. Arsenic (atomic number 33) is ubiquitous and ranks 20th in natural abundance, comprising about 0.00005 % of the earth’s crust, 14th in the seawater, and 12th in the human body.1 Arsenic,
due to its toxic and carcinogenic effect, has been recorded by the World Health Organization as a first priority pollutant.2,3 Acute and chronic arsenic poisoning via
drinking water has been reported in many countries, especially Argentina, Bangladesh, India, Mexico, Mongolia, Thailand, and Taiwan, as a result of in groundwater4 arsenic
load at levels from 100 to over 2000 μg L-1.
Millions of people worldwide are exposed to naturally occurring arsenic contaminated groundwater, which they use as their sole source of drinking water. Increased use of groundwater as a source for drinking water has caused serious health problems such as neurological, dermatological, gastrointestinal, cardiac, and renal diseases. Factors such as anthropogenic activities, biological actions, and geochemical reactions accelerate arsenic mobilization into groundwater.1 Arsenic compounds are stable in the environment, have a tendency to bioaccumulate in the food chain, and can undergo biotransformation with an increase in toxicity. It is necessary to control the arsenic concentration in environmental samples, industrial wastes, biological materials, and foods.
Various treatment technologies have been used to remove arsenic from water such as oxidation,5 coagulation,6 ion
exchange,7 chemical precipitation,8 membrane separation,9
etc. However, adsorption is recognized as an effective technique due to availability of wide range of adsorbents including natural and synthetic materials. The high concentration efficiency, simple operation, and environmental friendly behavior10 of certain adsorbents
make the process quite popular. Cellulose, the most widely available and renewable biopolymer in nature, is a very promising raw material available at low cost for the preparation of various functional materials. Due to the presence of hydroxyl groups, cellulose may undergo surface modification.10,11 Cellulose beads show good adsorption
ability due to their unique hydrophilic and porous nature as well as high surface area. Beads made from cellulose and its derivative are commonly used as ion exchangers, packing materials for chromatography, adsorbents for heavy metal ions, and proteins, cosmetic additives, and carriers for immobilization of biocatalysts.12-14 However, studies on
cellulose beads as arsenic scavenger are still scarce. Adsorbents modified with metals such as Fe,15,16 Ce,17
Ti,18,19 Al,20 La,21,22 etc are found to have potential ability to
absorb arsenic from water under optimized condition. In the present investigation cerium loaded nanocomposite cellulose bead (CCNB) for As(V) adsorption is reported as a representative of the metal loaded nanocomposite cellulose bead.
Experimental
Materials
All the chemicals used are of analytical grade (Merck, India). The cellulose power used was procured from Loba Chemie, Mumbai, India
Preparation of CCNB
Cerium loaded cellulose nanocomposite bead was synthesized by the method described elsewhere23 following
sol gel techniques.
1 g of cellulose is esterified with carbon disulfide with shaking in alkaline medium. and stirred for 3 h.24 The sol
was allowed for ageing (syneresis) at room temperature for 72 h and the gel probably formed by condensation of the sol, was purged drop by drop into de-aerated methanol through a needle. A faint red colored beads initially formed were filtered and immediately washed several times with double distilled water. The cellulose beads appeared as snow white, were stored under de-ionized water.
The cellulose nanocomposite beads were next poured into a solution of 0.10 M cerium ammonium nitrate at pH 1.6 and shaken at a speed of 100 spm at room temperature for 2 h. A faint orange yellow colored cerium loaded cellulose nanocomposite bead, (CCNB) was formed, washed with distilled water, and stored under de-ionized water.
Characterization of CCNB
Field emission scanning electron microscope (FESEM) with a JEOL, JSM 6700F microscope was used to study surface morphology and energy dispersive spectroscopy (EDS, model FEI QUANTA FEG 250) was used for element detection. Electron paramagnetic resonance (EPR) study to identify the binding pattern of cerium in the bead was recorded in a Varian X-band EPR spectrometer (Model E-109). The Fourier transformed infrared (FTIR) spectral study was recorded in a Perkin Elmer L120–000A spectrophotometer.
Batch adsorption study
Batch adsorption experiment was performed using As(V) solution of known concentration, shaken with a specific amount of CCNB, and agitated at a constant shaking rate of 120 spm in a temperature controlled shaker. The initial solution pH was adjusted using 0.1 M HCl/NaOH. The As(V) concentration in solution was determined using atomic absorption spectroscopy (AAS, Varian AA240 model). Adsorption efficiency (in %), expressed as percent adsorption, was calculated using the following equation:
(1)
where,
C0 and Ce are the initial and equilibrium As(V) concentration (mg L-1), respectively in solution.
Result discussion
Characterization of CCNB
Physicochemical parameters such as bulk and material density were found to be 0.902 and 0.410 g cm-3
respectively. The degree of swelling was found to be 22 while the water content and porosity were found to be 95.120 and 89 % respectively.
Figure 1. FESEM at different magnification and physical image (inset)
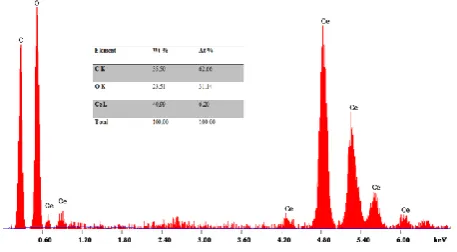
The surface structure of CCNB, as revealed from FESEM analysis, indicates the spherical nature of the bead with an average size in the range 28 to 61 nm (Fig. 1). The EDS shows peaks corresponding to the presence of ‘C’, ‘O’ and ‘Ce’ in the CCNB (Fig. 2).
Figure 2. EDS of CCNB with table of weight percentage of element
0 0
100C Ce
C
The EPR study conducted at room temperature (303 K) and lower temperature (77 K) shows similar signals having characteristics g values attributed to ge=2.03, g┴=1.98, gп =
1.93, (ge>g┴>gп)23 corresponding to Ce3+. The FTIR spectral
analysis of CCNB showing the characteristic bands of cellulose moiety with characteristic linkages25-27 is presented
in Table 1.
Table 1. FTIR spectral analysis of CCNB
Position, cm-1 Assignment 3402 O–H stretching 2918 C–H stretching
1642 molecular water bending 1424 C–O–H and C–C–H deformations 1375–1317 C–H flexure (symmetric) 1161, 1060 C–O stretching
898 C-H bending (β-anomeric link of cellulose) 769 C–C stretching
535 Ce-O linkage
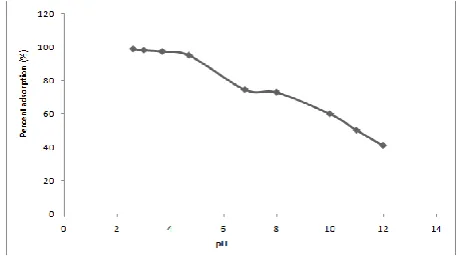
Effect of pH on As(V) adsorption
The effect of pH on As(V) adsorption by the CCNB is shown in Fig. 3 for the pH ranging between 2 and 12. It is observed that maximum adsorption of As(V) occurs at pH 3.0. pH dependent adsorption is significantly due to the specific arsenic species and the adsorbent surface charge. Speciation study indicates that the dominant species of arsenate are H3AsO4 (pH < 2), H2AsO4− (pH = 2–6.1),
HAsO42− (pH = 6.1–11.5), and AsO43− (pH > 11.5). It is
probable that H2AsO4− is the most suitable species of arsenic
for adsorption on CCNB.
Figure 3. Effect of pH on As(V) adsorption
Effect of contact time on As(V) adsorption
Fig. 4 illustrates the effect of time on the percent adsorption as well as the attainment of equilibrium. It is found that with increase of time the percent adsorption corresponding to each concentration of As(V) increases. After a certain time it reaches a maxima forming a plateau. The time corresponding to maximum adsorption is known as the equilibrium time. It is observed that equilibrium is reached at 5 h for all the concentrations studied.
Effect of initial concentration on As(V) adsorption
The decrease in the percentage of As(V) adsorbed due to the increase in initial As(V) concentration at fixed adsorbent dosage is presented in Fig. 5. The increase in arsenic
adsorption capacity with the decrease in initial concentration was due to the availability of more adsorption sites. However, as the initial arsenic concentration increases, the ratio of the number of arsenic ions to the available active sites on the adsorbent becomes high and the arsenic ions are difficult to get adsorbed, leading to a decrease in the removal percentage.
Figure 3. Effect of pH on As(V) adsorption
Figure 4. Effect of contact time on As(V) adsorption
Figure 5. Effect of initial concentration on As(V) adsorption
Effect of adsorbent dose on As(V) adsorption
Figure 6. Effect of adsorbent dose on As(V) adsorption
Adsorption isotherm
In an aim to describe the equilibrium adsorption for As(V)
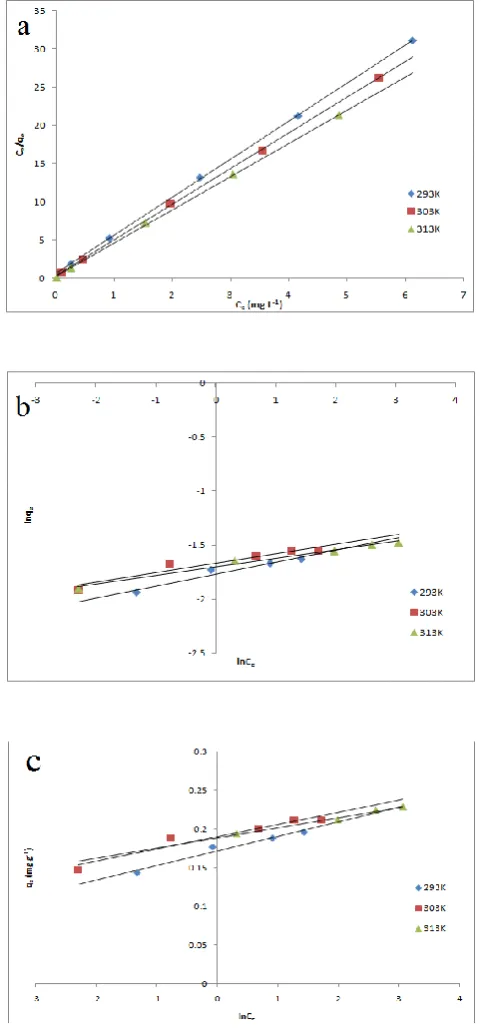
ions from aqueous solution on CCNB, three most popular isotherm models viz. Langmuir, Freundlich, and Temkin are tested.
The Langmuir isotherm, (Fig. 7a) applicable for the monolayer adsorption28 is expressed in its linear form as,
(2)
where,
Q (mg g-1) and b (L mg-1) are Langmuir isotherm
constants signifying the adsorption capacity and the energy of adsorption respectively.
The Freundlich isotherm, (Fig. 7b) assuming an exponentially decaying adsorption site energy distribution and applicable to non-ideal adsorption on heterogeneous surfaces showing multi-layer adsorption,29 is expressed by
the following linear equation:
(3)
where,
KF is the constant indicative of the relative adsorption
capacity of the adsorbent (mg g-1), and
1/nF is the constant indicative of the intensity of the
adsorption.
The Temkin isotherm,30 (Fig. 7c) that considers
solute/adsorbent interactions based on decaying heat of adsorption of the solute linearly with adsorbent surface coverage, is represented in linear form as,
(4)
where,
kTM is the isotherm constant and
bTM is related to heat of adsorption.
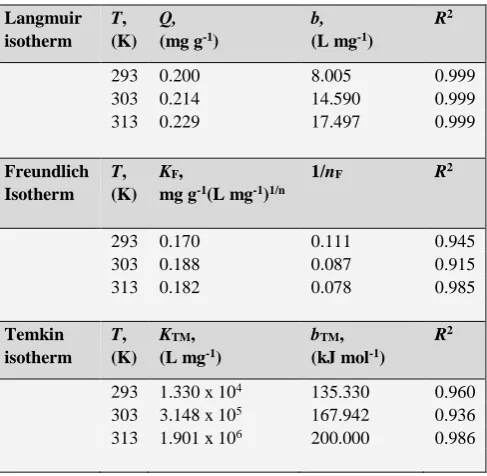
The adsorption equilibrium data for As(V) adsorption at three different temperatures were determined and fitted to the above three isotherm equations. The quality of data fit was judged from the R2 values. High R2 value describes the
most preferred situation. From Table 2 it is found that both the Q and b values increase with increase of temperature. This indicates that adsorption (Q) capacity increases with temperature. It is also supported by the fact that with higher temperature percent adsorption increase for each initial concentration of arsenic (Fig. 5). Among the three different isotherm models R2 value corresponding to Langmuir is of
higher magnitude than the Freundlich and Temkin model. Thus, Langmuir isotherm model most suitably describe the
As(V) adsorption on CCNB.
Figure 7. Isotherm data plots at different temperatures (a) Langmuir (b) Freundlich (c) Temkin
e
e e
1 1
C
C q QbQ
e F e
1 lnq lnK lnC
nF
e TM e
TM TM
ln ln
RT RT
q k C
b b
The applicability of Langmuir isotherm model was further tested by evaluating sf, the separation factor,31 a
dimensionless quantity as expressed by
(5)
where,
b is the Langmuir constant and
C0 is the initial concentration of As(V).
The parameter ‘sf’ indicates the nature of the isotherm as it
is given in Table 3.
Table 2. Isotherm parameters
Langmuir isotherm
T,
(K)
Q,
(mg g-1)
b,
(L mg-1)
R2
293 0.200 8.005 0.999 303 0.214 14.590 0.999 313 0.229 17.497 0.999
Freundlich Isotherm
T,
(K)
KF,
mg g-1(L mg-1)1/n
1/nF R2
293 0.170 0.111 0.945 303 0.188 0.087 0.915 313 0.182 0.078 0.985
Temkin isotherm
T,
(K)
KTM,
(L mg-1)
bTM,
(kJ mol-1) R2
293 1.330 x 10⁴ 135.330 0.960
303 3.148 x 10⁵ 167.942 0.936
313 1.901 x 10⁶ 200.000 0.986
Table 3. Feasibility and nature of isotherm study
sf Nature
sf>1 Unfavorable
sf = 1 Linear 0<sf<1 Favorable
sf = 0 Irreversible
The sf value at each temperature corresponding to each concentration of As(V) is calculated (Table 4).
Table 4. Temperature dependent separation factor
T
(K)
Sf, C0 (mg L-1)
6.0 8.0 10.0
293 0.020 0.015 0.012
303 0.011 0.008 0.006
313 0.009 0.007 0.005
It is found that the sf values lie within 0.012 to 0.020 at 293 K, 0.006 to 0.011 at 303 K and 0.005 to 0.009 at 313 K. As all values lie between 0 to 1, the adsorption of As(V) on CCNB indicates a favorable case of adsorption.
Thermodynamic study
The knowledge of thermodynamic parameters is of fundamental importance to test the spontaneous occurrence of a given process as well as the feasibility of operation at a given temperature. Thermodynamic parameters associated with the adsorption process, viz., standard free energy change (ΔG0), standard enthalpy change (ΔH0), and standard
entropy change (ΔS0) were calculated using the following
Eqs. 6 and 7.
ΔG0 = -RTlnK
c (6)
ΔG0 = ΔH0 – TΔS0 (7)
where,
T is the absolute temperature (K) and
R is the gas universal constant.
The equilibrium constant Kc for the adsorption was
evaluated from the slope and intercept of the Langmuir plot32 (Fig. 7a).
The magnitude and sign of ΔG0 depends on the value of
Kc. When the rates of the adsorption and desorption
processes are equal in magnitude, Kc becomes unity and ΔG0
= 0. The value of ΔG0is negative for K
c>1 and positive for
Kc<1. If adsorption occurs spontaneously, the rate of
adsorption being higher than desorption, ΔG0will always be
a negative quantity.33 Spontaneity of the adsorption process
is also affected by the thermodynamic parameters ΔH0, and
ΔS0.
Figure 8. Plot of ΔG0 versus temperature, T
A plot of ΔG0 versus temperature, T, will be linear
following equation (7) and the values of ΔH0, and ΔS0 are
determined from the slope and intercept of the plot Fig. 8. The values of Kc, ΔG0, ΔH0, and ΔS0 are presented in Table
5.
Table 5. Thermodynamic parameters
T,
(K)
Kc ΔG0,
(kJ mol-1)
ΔH0,
(kJ mol-1)
ΔS0,
(kJ mol-1 K-1) 293 8.005 -5.06705 29.63 0.119 303 14.59 -6.75215
313 17.49 -7.44677
Application
The efficiency of the present adsorbent is tested with the spiked samples. The results are shown in Table 6.
Table 6. Efficiency study with spiked sample
Sl. no.
As(V) concentration, (mg L-1)
Adsorption, (%)
Mean Spiked Found
1 0.5 0.0 0.51 ± 0.02 100 2 0.5 2.5 2.99 ± 0.02 100 3 0.5 5.0 5.44 ± 0.03 99 4 0.5 7.5 7.76 ± 0.04 97 5 0.5 10.0 8.56 ± 0.04 84
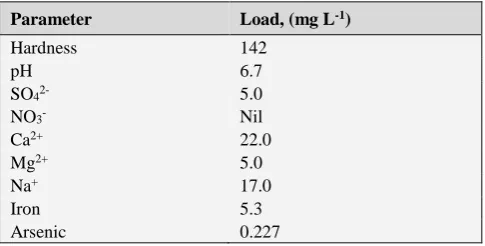
The applicability of the present method was judged with the field sample. The water sample was collected from some arsenic affected area of Deganga, North 24 Paragana, West Bengal, India. The composition of the field sample was presented in Table 7.
Table 7. Physicochemical parameters of the studied field sample
Parameter Load, (mg L-1)
Hardness 142
pH 6.7
SO42- 5.0
NO3- Nil
Ca2+ 22.0
Mg2+ 5.0
Na+ 17.0
Iron 5.3
Arsenic 0.227
The load of the arsenic after treatment with CCNB was found to reach below the detection limit.
Conclusion
Metal loaded cellulose nanocomposite bead is found to be effective for adsorptive removal of arsenic from water. The process is dependent significantly on the pH of the solution. At acidic pH range quantitative adsorption occurs. The process is found to follow the Langmuir isotherm than the Freundlich and Temkin model. The process is thermodynamically feasible as shown by negative free energy change and positive entropy change. The process is effective for removing arsenic from real sample.
Acknowledgement
One of the authors (D.S) is thankful to University of Kalyani for providing a research fellowship. Authors sincerely acknowledge the support and facilities provided under UGC-SAP, DST-FIST, and DST-PURSE program.
References
1Mohan, D. and Pittman, C. U. Jr., J. Hazard. Mater., 2007, 142,
1–53.
2EPA. Arsenic in drinking water: health effects research.
www.epa.gov/OGWDW/ars/ars10. html, 1999.
3WHO. Toxic effects of arsenic in humans.
www.who.int/peh-super/Oth.lec/Arsenic/series4/002. htm, 1999.
4Smedley, P. L. and Kinniburgh, D. G., Appl.Geochem., 2002, 17,
517-568.
5Martin, D. F., O’Donnell, L., Martin, B. B. and Alldredge, R., J.
Environ. Sci. Health A Tox. Hazard. Subst. Environ. Eng.,
2007, 42, 97–102.
6Moreno-Casillas, H. A., Cocke, D. L., Gomes, J. A. G.,
Morkovsky, P., Parga, J. R. and Peterson, E., Sep. Purif. Technol., 2007, 56, 204–211.
7Anirudhan, T. S. and Unnithan, M. R., Chemosphere, 2007, 66,
60–66.
8Mercer, K. L. and Tobiason, J. E., Environ. Sci. Technol., 2008,
42, 3797–3802.
9Iqbal, J., Kim, H. J., Yang, J. S., Baek, K. and Yang, J. W.
Chemosphere, 2007, 66, 970–976.
10Yu, X., Tong, S., Ge, M., Wu. L., Zuo, J., Cao, C. and Song.
W., Carbohydr. Polym., 2013, 92, 380-387.
11Habibi, Y., Lucia, L. A. and Rojas, O. J., Chem. Rev.,2010, 110,
3479–3500.
12Stamberg, J. and Peska, J., React. Polym., 1983, 1, 145-147. 13Boeden, H. F., Pommerening, K., Becker, M., Rupprich, C. and
Holtzhauer, M., J. Chromatogr., 1991, 552, 389-414.
14Wolf, B. Int. J. Pharm.,1997, 156, 97-107.
15Guo, X., Du, Yonghua F. C., Park, H. and Xiev, Y., J. Colloid
Interface Sci.,2007, 314, 427–433.
16Ciftci, T. D., Yayayuruk, O. and Henden, E., Environ. Technol.,
2011, 32, 341–351.
17Sun, W., LI, Q., Gao, S. and Shang, J. K., Chem. Eng. J.,2012,
185-186, 136-143.
18Pena, M. E., Korfiatis, G. P., Patel, M., Lippincott, L. and Meng,
X. G., Water Res.,2005, 39, 2327-2337.
19Yabing, X., Jie, L., Shahua, Q. and Anqing L., Water Environ.
Res.,2007, 79, 1015.
20Masue, Y., Loeppert, R. H. and Kramer, T. A., Environ. Sci.
Technol., 2007, 41, 837–842.
21Wasay, S. A., Haran, Md. J. and Tokunaga, S., Water Environ.
Res., 1996, 68, 295-300.
22Jang, M., Park, J. K. and Shin E. W., Microporous Mesoporous
Mater., 2004, 75, 159-168.
23Santra, D., Joarder, R. and Sarkar, M., Carbohydr. Polym.,
(accepted for publication) CARBPOL-D-13-02852.
24Wang, D. M., Hao, G., Shi, Q. H. and Sun, Y., J. Chromatogr. A,
2007, 1146, 32–40.
25Jagtap, S., Thakre, D., Wanjari, S., Kamble, S., Labhsetwar, N.
and Rayalu, S., J. Colloid Interface Sci., 2009, 332, 280–290.
26Li, Z., Deng, S., Zhang, X., Zhou, W., Huang, J. and Yu, G.,
Front Environ. Sci. Eng. China,2010, 4, 414–420.
27Rocha, R. A. and Muccillo, E. N. S., Mater. Res. Bull., 2003, 38,
1979–1986.
28Ho, Y. S., Huang, C. T. and Huang, H.W., Process Biochem.,
29Al Duri, B. and Mckay, G., The Chem. Eng. J.,1988, 38, 23–31. 30Allen, S. J., Mckay, G. and Porter, J. F., J. Colloid Interface
Sci., 2004, 280, 322–333.
31Weber, T. W. and Chakrabarty, R. K., Am. Inst. Chem. Eng. J.,
1974, 20, 228-232.
32Khan, A. S. A., Turk. J. Chem., 2012, 36, 437–443.
33Munoz, J. A., Gonzalo, A. and Valiente, M., Environ. Sci.
Technol.,2002, 36, 3405-3411.