Prasad Krishnan IBM Linux Technology Centre
Abstract
The Hardware Breakpoint (also known as watchpoint or debug) registers, hitherto was a frugally used resource in the Linux Kernel (ptrace and in-kernel debuggers being the users), with little co-operation between the users. The role of these debug registers is best exem-plified in a) Nailing down the cause of memory cor-ruption, which be tricky considering that the symptoms manifest long after the actual problem has occurred and have serious consequences—the worst being a sys-tem/application crash. b) Gain better knowledge of data access patterns to hint the compiler to generate better performing code. These debug registers can trigger
ex-ceptions uponevents(memory read/write/execute
ac-cesses) performed onmonitoredaddress locations to
aid diagnosis of memory corruption and generation of profile data.
This paper will introduce the new generic interfaces and the underlying features of the abstraction layer for HW Breakpoint registers in Linux Kernel. The audience will also be introduced to some of the design challenges in developing interfaces over a highly diverse resource such as HW Breakpoint registers, along with a note on the future enhancements to the infrastructure.
1 Introduction
Hardware Breakpoint interfaces introduced to the Linux kernel provide an elegant mechanism to monitor mem-ory access or instruction executions. Such monitoring is very vital when debugging the system for data cor-ruption. It can also be done to with a view to understand memory access patterns and fine-tune the system for op-timal performance.
The hardware breakpoint registers in several processors provide a mechanism to interrupt the programmed ex-ecution path to notify the user through of a hardware
breakpoint exception. We shall examine the details of such an operation in the subsequent sections.
Possibly, the biggest convenience of using the hardware debug registers is that it causes no alteration in the nor-mal execution of the kernel or user-space when unused, and has no run-time impact. The most notable limitation of this facility is the fewer number of debug registers on most processors.
2 Hardware Breakpoint basics
A hardware breakpoint register’s primary (and only) task is to raise an exception when the monitored loca-tion is accessed. However these registers are processor specific and their diversity manifests in several forms— layout of the registers, modes of triggering the break-point exception (such as exception being triggered ei-ther before or after the memory access operation) and types of memory accesses that can be monitored by the processor (such as read, write or execute).
2.1 Hardware breakpoint basics—An overview of x86, PPC64 and S390
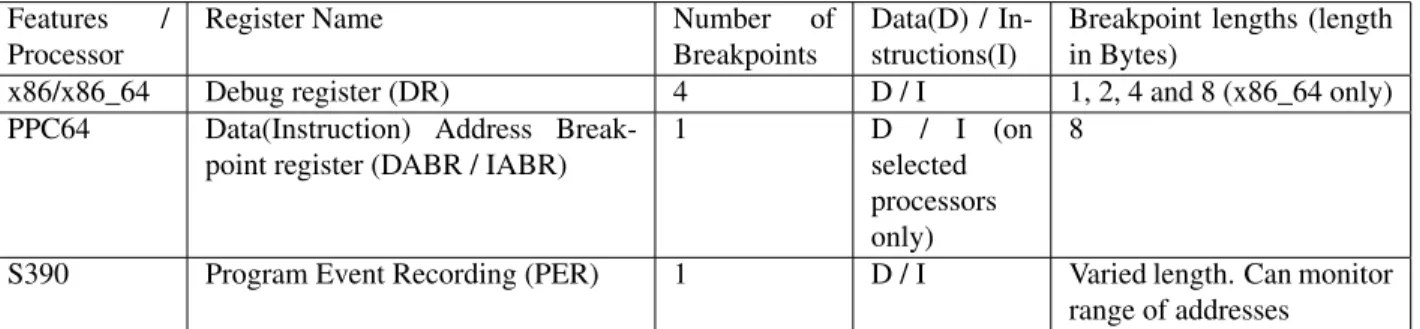
Table 1 provides a quick overview of the breakpoint fea-ture in various processors and compares them against each other [1, 2].
3 Design Overview of Hardware Breakpoint infrastructure
3.1 Register allocation for kernel and user-space requests
While debug registers would treat every breakpoint ad-dress in the same way, there is a fundamental dif-ference in the way kernel and user-space breakpoint
Features / Processor
Register Name Number of Breakpoints
Data(D) / In-structions(I)
Breakpoint lengths (length in Bytes)
x86/x86_64 Debug register (DR) 4 D / I 1, 2, 4 and 8 (x86_64 only) PPC64 Data(Instruction) Address
Break-point register (DABR / IABR)
1 D / I (on
selected processors only)
8
S390 Program Event Recording (PER) 1 D / I Varied length. Can monitor range of addresses
Table 1: Processor Support Matrix
requests are effected. A user-space breakpoint
be-longing to one thread (and hence stored in struct
thread_struct) will be active only on one
proces-sor at any given point of time. The kernel-space break-points, on the other hand should remain active on all processors of the system to remain effective since each of them can potentially run kernel code any time. This necessitates the propagation of kernel-space requests for (un)registration to all processors and is done through
inter-processor interrupts (IPI). The per-thread
user-space breakpoint takes effect only just before the thread
is scheduled. This means that a system at run-time
can have as many breakpoint requests as the number of threads running and the number of free (i.e., not in use by kernel) breakpoint registers put together (number of threads x number of available breakpoint registers) since they can be active simultaneously without inter-fering with each other.
On architectures (such as x86) containing more than one debug register per processor, the infrastructure arbitrates between requests from multiple sources. To achieve this, the implementation submitted to the Linux commu-nity (refer [3]) makes certain assumptions about the na-ture of requests for breakpoint registers from user-space through ptrace syscall, and simplifies the design based on them.
The register allocation is done on a come, first-serve basis with the kernel-space requests being accom-modated starting from the highest numbered debug reg-ister growing towards the lowest; while user-space re-quests are granted debug registers starting from the low-est numbered register. Thus in case of x86, the infras-tructure begins looking out for free registers beginning from DR0 while for kernel-space requests it will begin with DR3 thus reducing the scope for conflict of re-quests.
In order to avoid fragmentation of debug registers upon an unregistration operation, all kernel-space breakpoints are “compacted” by shifting the debug register values by one-level although this is not possible for user-space re-quests as it would break the semantics of existing ptrace implementation. This implies that even if a user-thread
downgraded its usage of breakpoints fromnton - 1,
the breakpoint infrastructure will continue to reserven
debug registers. A solution for this has been proposed in Section 8.1.
3.2 Register Bookkeeping
Accounting of free and used debug registers is essential for effective arbitration of requests, and allows multiple users to exist concurrently. Debug register bookkeeping is done with the help of following variables and struc-tures.
hbp_kernel[] – An array containing the list of
kernel-space breakpoint structures
this_hbp_kernel[] – A per-cpu copy of hbp_
kernelmaintained to mitigate the problem discussed
in Section 7.2.
hbp_kernel_pos– Variable denoting the next
avail-able debug register number past the last kernel
break-point. It is equal toHBP_NUMat the time of
initialisa-tion.
hbp_user_refcount[] – An array containing
re-fcount of threads using a given debug register number.
Thus a valuexin any element of indexnwill indicate
that there arexnumber of threads in user-space that
cur-rently usennumber of breakpoints, and so on.
A system can accommodate new requests for break-points as long as the kernel-space breakbreak-points and those
of any given thread (after accounting for the new re-quest) in the system can be fit into the available debug registers. In essence,
Debug registers >= Kernel Breakpoints + Max(Breakpoints in use by any given thread)
3.3 Optimisation through lazy debug register switching
The removal of user-space breakpoint, happens not im-mediately when it is context switched-out of the proces-sor but only upon scheduling another thread that uses
the debug register in what we term aslazy debug
regis-ter switching. It is a minor optimisation that reduces the overhead associated with storing/restoring break-points associated with each thread during context switch between various threads or processes. A thread that
uses debug registers is flagged withTIF_DEBUGin the
flagmember instruct thread_info, and such
threads are usually sparse in the system. If we must clear the user-space requests from the debug registers at the
time of context-switch (in__switch_to()itself), it
could be done either
• unconditionally on all debug registers not used by
the kernel or
• only if the thread exiting the CPU had TIF_
DEBUG flag set (which is false for a majority of
the threads in the system).
In both the cases, we would add a constant overhead to the context-switching code irrespective of any thread using the debug register.
4 The Hardware Breakpoint interface 4.1 Hardware Breakpoint registration
The interfaces for hardware breakpoint registration for kernel and user space addresses have signatures as noted in Figure 2.
A call to register a breakpoint is accompanied by a pointer to the breakpoint structure populated with cer-tain attributes of which some are architecture-specific.
int register_kernel_hw_breakpoint(struct hw_breakpoint *bp); int register_user_hw_breakpoint(struct task_struct *tsk, struct hw_breakpoint *bp);
Figure 2: Hardware Breakpoint interfaces for registra-tion of kernel and user space addresses
struct hw_breakpoint {
void (*triggered)(struct hw_breakpoint *, struct pt_regs *); struct arch_hw_breakpoint info; };
Figure 3: Hardware Breakpoint structure The generic breakpoint structure in the Linux kernel of -tip git tree presently looks as seen in Figure 3.
The triggeredpoints to the call-back routine to be
invoked from the exception context, whileinfo
con-tains architecture-specific attributes such as breakpoint length, type and address.
A breakpoint register request through these interfaces does not guarantee the allocation of a debug register and it is important to check its return value to determine suc-cess.
Unavailability of free hardware breakpoint registers can be most common reason since hardware breakpoint reg-isters are a scarce resource on most processors. The
re-turn code in this case is-ENOSPC.
The breakpoint request can be treated as invalid if one of the following is true.
• Unsupported breakpoint length
• Unaligned addresses
• Incorrect specification of monitored variable name
• Limitations of register allocation mechanism
4.1.1 Unsupported breakpoint length
While the breakpoint register can usually store one ad-dress, the processor can be configured to monitor ac-cesses for a range of addresses (using the stored address
User-space debuggers (GDB)
ptrace()
register_user_hw_breakpoint() register_kernel_hw_breakpoint()
CPU 0 CPU 1 CPU 2
CPU (NR_CPUS -1) In-kernel debuggers (ksym_tracer) struct thread_struct { ... ... Hardware breakpoint regs struct hw_breakpoint *hbp[HBP_NUM] ... ... }
arch_update_kernel_hw_breakpoint() arch_update_kernel_hw_breakpoint() arch_update_kernel_hw_breakpoint() IPI
arch_update_kernel_hw_breakpoint()
HBKPT HBKPT HBKPT HBKPT
IPI IPI IPI
on_each_cpu(arch_update_kernel_hw_breakpoint) arch_install_thread_hw_breakpoint() schedule() arch_install_thread_hw_breakpoint() schedule() arch_install_thread_hw_breakpoint() schedule() arch_install_thread_hw_breakpoint() schedule() Context Switch - switch_to() Context Switch - switch_to() Context Switch - switch_to() Context Switch - switch_to()
USER-SPACE KERNEL-SPACE
USER-SPACE BREAKPOINTS
KEY KERNEL-SPACE BREAKPOINTS IPI - Inter Processor InterruptsHBKPT - Hardware Breakpoint registers NR_CPUS - Number of CPUs in the system
arch_update_user_hw_breakpoint()
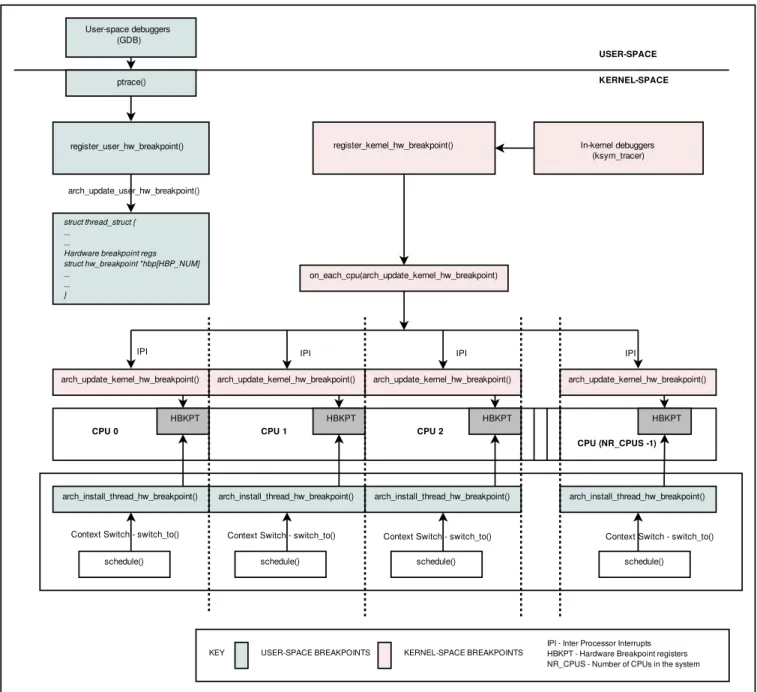
Figure 1: This figure illustrates the handling of requests from kernel and user-space by the breakpoint infrastructure
as a base). For instance, in certain x86_64 processor types, up to four different byte ranges of addresses can be monitored depending upon the configuration. They are byte length of 1, 2, 4, and 8. However on PPC64 ar-chitectures, this is always a constant of 8 bytes. Thus a given breakpoint request can be treated as valid or oth-erwise depending upon the host processor. The arch-specific structure is designed to contain only those fields that are essential for proper initiation of a breakpoint re-quest and all constant values are hard-wired inside the architecture code itself.
4.1.2 Unaligned addresses
Certain processors have register layouts that impose alignment requirements on the breakpoint address. The alignment requirements are in consonance with the breakpoint lengths supported on these processors. For instance, in x86 processors the supported lengths as we know are 1, 2, 4, and 8 bytes which in turn dictates that the addresses must be aligned to 0, 1, 3, and 7 bytes.
4.1.3 Incorrect specification of monitored variable name
The breakpoint interface is designed to accept kernel symbol names directly as input for the location to be monitored by the breakpoint registers. Invalid values can be the result of incorrect symbol name. Since user-space symbols cannot be resolved to their addresses in the kernel, their breakpoint requests would fail if accom-panied by a symbol name. As a means to resolve a con-flict, that may arise when incoherent kernel symbol and address are mentioned, the address is considered valid and the supersedes the kernel symbol name.
4.1.4 Limitations of register allocation mechanism
The register allocation mechanism (as discussed in the Design overview section above) may also result in fail-ure of registration due to lack of debug registers despite availability of a different numbered physical register. This is identified as a limitation of the present debug register allocation scheme, and virtualisation of debug registers is planned as a solution for the same.
At the end of a successful registration request the user can assume that the request for breakpoints are effected by storing kernel-space request on all CPUs and user-space requests only when the process is scheduled.
4.2 Hardware Breakpoint handler execution
Almost all of the hardware breakpoint exception han-dling code is in architecture specific code. This is due to the fact that each architecture handles the breakpoint exception in its handler code differently.
However a few operations are common to the han-dlers designed for x86 and PPC64. The primary ob-jective of the exception handler is to trigger the func-tion registered as a callback during breakpoint regis-tration, which requires access to the correct instance
of struct hw_breakpoint that was provided to
the breakpoint interface during registration. The correct breakpoint structure has to be deciphered from a set of user-space and kernel-space breakpoint requests.
4.2.1 Identification of stray exceptions
But before that, the handler execution code must be re-silient to recognise stray exceptions and ignore them. Such stray exceptions can be the result of one of causes detailed below.
Memory access operations on addresses that are outside the monitored variable’s address range but within the breakpoint length. For instance, on PPC64 processors
the DABR always monitors for memory access
opera-tions (as specified in the last two bits of DABR) in the double word (8 bytes) starting from the address in the register. However the user’s request would be limited to only a given kernel variable (whose size is smaller than a double-word). Hence any accesses in the memory re-gion adjacent to the monitored variable falling within the breakpoint length’s scope causes the breakpoint ex-ception to trigger.
Lazy debug register switching causes stale data to be present in debug registers (as discussed above in Sec-tion 3.3) and can give rise to spurious excepSec-tions. This typically happens when a process accesses memory lo-cations that were monitored previously by a different process but are not reset due to lazy switching.
4.2.2 Identification of breakpoint structure for in-vocation of callback function
The user-space breakpoint requests are thread-specific
and so, stored in the struct thread_struct,
while kernel-space breakpoints being universal are
stored in global kernel data structures, namely hbp_
kernelas noted above in Section 3.2.
On x86 processors, which provide four debug registers it is more challenging to identify the corresponding break-point structure, when compared to architectures that al-low only one breakpoint at any point in time. Upon encountering a breakpoint exception, the bit settings in
the status register for debugging DR6 is looked upon.
Based on the bits that are set, the appropriate breakpoint address register (DR0-DR3) is understood to have been the cause for the exception. Depending upon whether the register was used by the kernel or user-space the breakpoint structure is retrieved from either the kernel’s global data structure or the process’ instance of the per-thread structure respectively.
void unregister_kernel_hw_breakpoint(struct hw_breakpoint *); void unregister_user_hw_breakpoint(struct hw_breakpoint *, struct task_struct *);
Figure 4: Hardware Breakpoint interfaces for unregis-tration of kernel and user space addresses
Using such architecture-specific methods to identify the appropriate breakpoint structure, the user-defined call-back function is invoked.
This will be followed by post processing, which may include single-stepping of the causative instruction in architectures where the breakpoint exception is taken when the impending instruction will cause the memory operation monitored by the debug register.
Since the breakpoint handler is invoked through a noti-fier call chain, the return code is used to decide if the remaining handlers have to be invoked further. Detec-tion of multiple causes for the excepDetec-tion will then be required to choose the appropriate return code and will form part of the post processing code.
4.3 Hardware Breakpoint unregistration
Hardware breakpoint unregistration is done by invoking the appropriate kernel or user interface with a pointer to the instance of breakpoint structure. An invocation to the interface always results in successful removal of the breakpoint and hence doesn’t return any value to indi-cate success or failure. The interfaces are as shown in 4.
4.3.1 Need for per-cpu kernel breakpoint struc-tures
It is much safer and easier to remove user-space break-points, compared to kernel-space requests (refer to 7
section for a related issue). It requires updating of
the appropriate bookkeeping counters and per-thread data structures containing breakpoint information (apart from clearing the physical debug registers). While pro-cessing user-space unregistration requests, if the
break-point removal causes the any member ofhbp_user_
refcount[] to turn into zero (i.e., result in a state
where there are no threads using the debug register cor-responding to the array index of the member that turned
Sample output from ksym tracer
# t r a c e r : k s y m _ t r a c e r #
# TASK-PID CPU# Symbol Type Function # | | | | |
bash 30897 3 pid_max RW .do_proc_dointvec_minmax_conv+0x78/0x10c bash 30897 3 pid_max RW .do_proc_dointvec_minmax_conv+0xa0/0x10c bash 30897 3 pid_max RW .alloc_pid+0x8c/0x4a4
bash 30897 1 pid_max RW .alloc_pid+0x8c/0x4a4
Figure 5: Sample output from ksym tracer collected when tracing pid_max kernel variable for read and write operations
zero), it indicates the availability of one new free debug register since the last user of that debug register has re-leased the resource.
Kernel-space breakpoints are loaded onto all debug reg-isters to the obvious fact that the kernel-code may be executed on any and all processors at any given point of time unlike the thread-specific breakpoints which run only on one processor at any given instant.
Thus a removal request for kernel-space breakpoints should be propagated to all processors (in the same fash-ion as a registratfash-ion request) through inter-processor in-terrupts. The process of unregistration is complete only when the callbacks through the IPI in each of the CPU returns.
5 Beyond debugging of memory corruption— Ftrace, memory access tracing and data pro-filing
The ksym tracer is a plugin to the ftrace framework that allows a user to quickly trace a kernel variable for cer-tain memory access operations and collect information about the initiator of the access.
It provides an easy-to-use interface to the user to accept the kernel variable and a set of memory operations for which the variable will be monitored. While, it is cur-rently restricted to trace only in-kernel global variables, the ksym_tracer’s parser can be extended to accept mod-ule variables and kernel-space addresses as input. These traces can help in profiling memory access oper-ations over data locoper-ations such as read-mostly or write-mostly.
Operation / Machine register_kernel unregister_kernel System A System B System A System B Trial 1 5066 5770 244 24 Trial 2 5319 6279 204 21 Trial 3 5309 6193 228 20 Trial 4 6068 6092 206 18
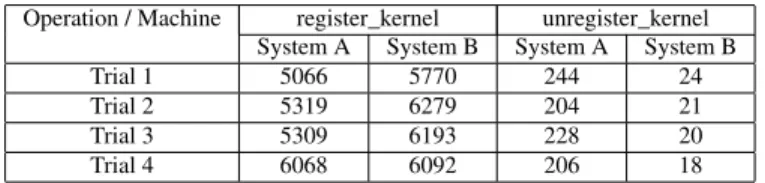
Table 2: Time taken for (un)register_kernel operation in micro-seconds
6 Overhead measurements of triggering breakpoints
Readings of the following measurements have been tab-ulated.
• Table 2 – Contains overhead measurements for
reg-ister and unregreg-ister requests on two systems.
• Table 3 – Average time taken for the breakpoint
handler execution with a dummy trigger in four dif-ferent trials on two systems.
The trials were conducted on two machines, System A and B whose specifications are as below.
System A – 24 CPU x86_64 machine Intel(R) Xeon(R) MP 4000 MHz
System B – 2 CPU i386 Intel(R) Pentium(R) 4 CPU 3.20GHz
These systems, chosen for tests are sufficiently diverse in the number of CPUs in them to expose the overhead
caused by of IPIs in the (un)register_kernel_
hw_breakpoint() operations. The readings were
taken without any true workload on the systems. While the overhead for unregister operations is greater in System A (with many CPUs), interestingly this be-haviour does not manifest during the register operations (Refer to Table 2).
7 Challenges
Among the the goals set during the design of the hard-ware breakpoint infrastructure, a few to mention are:
• provide a generic interface that abstracts out
the arch-specific variations in breakpoint facility and allowing the end-user to harness this facility through a consistent interface
Operation / Machine Breakpoint handler System A System B Trial 1 2230 4677 Trial 2 1980 4255 Trial 3 1805 4224 Trial 4 1644 4035
Table 3: Time taken for breakpoint handler with a dummy callback function (in nano-seconds)
• provide a well-defined breakpoint execution
han-dler behaviour despite the nuances in such as trigger-before-execute and trigger-after-execute (which are dependant on the type of breakpoint and the host processor)
• balance between the the need for a uniform
be-haviour and exploitation of unique processor fea-tures
The implementation of such goals gave rise to chal-lenges, some of which are discussed here.
7.1 Ptrace integration
The user-space has been the most common user of hard-ware breakpoints through the ptrace system call. Ptrace interface’s ability to read or write from/into any phys-ical register has been exploited to enable breakpoints for user-space addresses. While it required little or no knowledge about the host architecture’s debug registers, it remained the responsibility of the application invoking ptrace (such as GNU Debugger GDB) to be a knowl-edgeable user and activate/disable them through appro-priate control information.
For instance, on x86 processors containing multiple de-bug registers and dedicated control and status registers (unlike in PPC64 where the control and debug address registers are composite), operations such as read and write become non-trivial—i.e., every request for a new breakpoint must require one write operation on the de-bug address register (DR0 - DR3) and one for the control register.
Since ptrace is exposed to the user-space as a system call it is important to preserve its error return behaviour. Achieving this becomes complicated because of the fact that ptrace and its user in the user-space assumes exclu-sive availability of the debug registers and are ignorant
of any kernel space users. Hence, the number of avail-able registers may be lesser than the ptrace user’s as-sumption and may result in failure of request when not expected.
On architectures like x86 where the status of multiple breakpoint requests can be modified through one ptrace call (using a write operation on debug control register DR7), care is taken to avoid a partially fulfilled request to prevent the debug registers from gaining a set of val-ues that is different from the ptrace’s reqval-uested valval-ues and its past state. Consider a case where, among the four debug registers, one was active and the remaining three were disabled in the initial state. If the new re-quest through ptrace was to de-activate the single active breakpoint and enable the rest of them, then we do not effect the breakpoint unregistration first but begin with the registration requests and this is done for a reason. Supposing that one of the breakpoint register operation fails (due to one of the reasons noted above in Section 4.1) and if it was preceded by the unregister operation the result of the ptrace call is still considered a failure. The state of the debug registers must now be restored to its previous one which implies that the breakpoint un-registration operation must be reversed. Under certain conditions this may not be possible leaving the debug registers with an altogether new set of values.
Thus all breakpoint disable requests in ptrace for x86 is processed only after successful registration requests if any. This prevents a window of opportunity for debug register grabbing by other requests thereafter leading to a problem as described above.
7.2 Synchronised removal of kernel breakpoints
A kernel breakpoint unregistration request would re-quire updating of the global kernel breakpoint structure and debug registers of all CPUs in the system (similar to the process of registration). However every processor is susceptible to receive a breakpoint exception from the breakpoint that is pending removal although the related global data structures may be cleared by then causing indeterminate behaviour.
This potential issue was circumvented by storing a per-cpu copy of the global kernel breakpoint structures which would be updated in the context of IPI process-ing. It enables every processor to continue to receive and
handle exceptions through its own copy of the break-point data until removed. Although this generates mul-tiple copies of the same global data, it is much preferred over the alternatives such as global disabling of break-points (through IPIs) before every unregister operation, due to the overhead associated with processing the IPIs (Refer Table 2 for data containing turnaround time for register/unregister operations).
8 Future enhancements
Enhanced abstraction of the interface to include defini-tions of attributes that are common to several architec-tures (such as read/write breakpoint types), widening the support for more processors, improvements to the
ca-pabilities, interface and output ofksym_tracer;
cre-ation of more end-users to support the breakpoint infras-tructure such as “perfcounters” and SystemTap in inno-vative ways are just a few enhancements contemplated at the moment for this feature.
Virtualised debug registers was a feature in one of the versions of the patchset submitted to the Linux commu-nity but was eventually dropped in favour of a simplified approach to register allocation. The details of the feature and benefits are detailed below.
8.1 Virtualisation of Debug registers
In processors having multiple registers such as x86, re-quests for breakpoint from ptrace are targeted for spe-cific numbered debug register and is not a generic re-quest. While this mechanism works well in the absence of any register allocation mechanism and when requests from user-space have exclusive access to the debug reg-isters, their inter-operability with other users is affected. The hardware breakpoint infrastructure discussed here, mitigates this problem to a certain extent by using the
fact that requests from ptrace tend to grow upwards—
i.e., starting from the lower numbered register to the higher ones.
A true solution to this problem lies in creating a thin layer that maps the physical debug registers to those re-quested by ptrace and allow the any free debug ter to be allocated irrespective of the requested regis-ter number. The ptrace request can continue to access
through thevirtual debug registerthus
8.2 Prioritisation of breakpoint requests
Allow the user to specify the priority for breakpoint re-quests to be handled. If a breakpoint request with a higher priority arrives, the existing breakpoint yields the debug register to accommodate the former. An accom-paniment to this feature would be the callback routines that are invoked whenever a breakpoint request is pre-empted or regains the debug registers on the processor. This is done at the time of every new registration to bal-ance the requests and accommodate requests based on their priorities.
This feature was a part of the original patchset but was subsequently removed based on community feedback [4].
9 Conclusions
The Hardware Breakpoint infrastructure and the as-sociated consumers of the infrastructure such as
ksym_tracer makes available a hitherto scarcely
used hardware resource to good use in newer ways such as profiling and tracing apart from their vital roles in de-bugging. The overhead in taking a breakpoint, as our results in Section 6 show are tolerable even in produc-tion environments and if any would be the result of the user-defined callback function. It is hoped that when the patches head into the mainline kernel, a wider user-feedback and testing will help evolve the infrastructure into a more powerful and robust one than the proposed.
10 Acknowledgements
The author wishes to thank his team at Linux Technol-ogy Centre, IBM and the management for their encour-agement and support during the creation of the hardware breakpoint patchset and the paper.
The profound work done by Alan Stern, whose patch-set and ideas were the foundation for the present code in -tip tree, and an earlier patchset from Prasanna S Pan-chamukhi need a mention of thanks from the author. The design of this feature is heavily influenced by sug-gestions from Ingo Molnar and code was vetted by Ananth N Mavinakayanahalli, Frederic Weisbecker and Maneesh Soni; also benefiting from the in-depth review
of the patches by Alan Stern. The author gratefully ac-knowledges their contribution.
Special thanks to Balbir Singh for initiating the author into the creation of this paper and being a great source of encouragement throughout.
The author wishes to thank Naren A Devaiah and the IBM management who generously provided an oppor-tunity to work on this feature and paper, without which its presentation at the Linux Symposium 2009 wouldn’t have been possible.
11 Legal Statements
c
International Business Machines Corporation 2007. Per-mission to redistribute in accordance with Linux Symposium submission guidelines is granted; all other rights reserved.
This work represents the view of the author and does not nec-essarily represent the view of IBM.
IBM, IBM logo, ibm.com are trademarks of International Business Machines Corporation in the United States, other countries, or both.
Linux is a registered trademark of Linus Torvalds in the United States, other countries, or both.
Other company, product, and service names may be trade-marks or service trade-marks of others.
References in this publication to IBM products or services do not imply that IBM intends to make them available in all countries in which IBM operates.
INTERNATIONAL BUSINESS MACHINES CORPORA-TION PROVIDES THIS PUBLICACORPORA-TION “AS IS” WITH-OUT WARRANTY OF ANY KIND, EITHER EX-PRESS OR IMPLIED, INCLUDING, BUT NOT LIM-ITED TO, THE IMPLIED WARRANTIES OF NON-INFRINGEMENT, MERCHANTABILITY OR FITNESS FOR A PARTICULAR PURPOSE. Some states do not al-low disclaimer of express or implied warranties in certain transactions, therefore, this statement may not apply to you. This information could include technical inaccuracies or ty-pographical errors. Changes are periodically made to the in-formation herein; these changes will be incorporated in new editions of the publication. IBM may make improvements and/or changes in the product(s) and/or the program(s) de-scribed in this publication at any time without notice.
References
[1] Intel Corporation.Intel 64 and IA-32 Architectures
Software Developer’s Manual, 2008.
www.intel.com/Assets/PDF/manual/
253669.pdf.
[2] International Business Machines Corporation.
Power ISATMVersion 2.05, 2007.
http://www.power.org/resources/
reading/PowerISA_V2.05.pdf.
[3] K. Prasad. Hardware breakpoint interfaces, June 2009.
http://lkml.org/lkml/2009/6/1/282.
[4] K. Prasad. Introducing generic hardware
breakpoint handler interfaces, March 2009. http:
Linux Symposium
July 13th–17th, 2009
Montreal, Quebec
Andrew J. Hutton,
Steamballoon, Inc., Linux Symposium,
Thin Lines Mountaineering
Programme Committee
Andrew J. Hutton,
Steamballoon, Inc., Linux Symposium,
Thin Lines Mountaineering
James Bottomley,
Novell
Bdale Garbee,
HP
Dave Jones,
Red Hat
Dirk Hohndel,
Intel
Gerrit Huizenga,
IBM
Alasdair Kergon,
Red Hat
Matthew Wilson,
rPath
Proceedings Committee
Robyn Bergeron
Chris Dukes,
workfrog.com
Jonas Fonseca
John ‘Warthog9’ Hawley
With thanks to
John W. Lockhart,
Red Hat
Authors retain copyright to all submitted papers, but have granted unlimited redistribution rights to all as a condition of submission.