Water Level Data Preprocessing Method Based on Savitzky-Golay Filter
Xiaoxiong Wang
1, Mingyang Pan
2,*and Chunxiao Xia
3 Dalian Maritime University, Dalian 116026, China*Corresponding author
Keywords: Savitzky-Golay filter, Water level data, Time series, LSTM.
Abstract. Using historical water level data to establish a model to estimate the future water level is a common means of water level prediction. In this type of method, the accuracy of water level prediction is closely related to the quality of historical water level data. However, due to measurement accuracy and system deviations, water level data collected by real-time water level observatories often have abnormal or erroneous data. Aiming at this situation, this paper studies the water level data preprocessing method based on Savitzky-Golay filter. This method removed the noise of historical water level data and smoothed the data, which could better establish the water level prediction model. This paper used the water level prediction model established by LSTM to verify the water level data preprocessing method. The results showed that this method can improve the accuracy of the prediction model.
Introduction
Water level is the key factor affecting the scale of inland waterway, the bearing capacity of waterway and the safety of ship navigation. Water level prediction, especially short time prediction, has become the focus of attention of many scholars. Because of the influence of many factors, such as topography, weather, confluence and shunt, the characteristics of seasonal and periodic variation of inland waterway are large, so the prediction of inland water level is always a problem, so it is difficult to establish a mathematical model with good applicability. Using historical water level data to establish a model to calculate the water level in the future has become a common means of water level prediction at present. Especially with the large-scale promotion of real-time water level observatories, people have mastered a large number of fine-grained historical water level data.
Historical water level data is essentially time series data. Time series usually refers to a sequence formed by arranging the values of certain statistical indicators in chronological order. The time series data itself contains enough information, from which it can find its timing and regularity, obtain the development process, direction and trend reflected by it, and further use such push or extension to predict the statistical indicators for a period of time. The level that can be reached. This time series analysis method can achieve better results in the prediction of inland water levels [1].
However, due to measurement accuracy, system deviations, processing deviations, and sudden phenomena, these historical water level data often have abnormalities or even deviations. When analyzing the time series, the quality of the data has a great influence on the analysis results. A low-quality time series data is difficult to achieve the desired analysis effect no matter how clever the time series model is. Therefore, these data anomalies will seriously affect the accuracy of subsequent water level prediction. How to scientifically and effectively preprocess these historical water level data, so that the water level prediction based on them can be more accurate is an important problem that needs to be solved.
Many scholars have come up with corresponding approaches. In 2009, Xue-yu Li proposed the calculation method of the average value of the water level weighting coefficient. The water level correction can be carried out point by point using the plane position of the water level station and the measuring point, which can effectively improve the overall accuracy of the water depth measurement [2]. In 2017, Hou-yong Li et al. used a time-weighted recursive method, a fitting curve method and an artificial line to calculate the processing system, which can eliminate the instantaneous water level collected before the automatic reporting [3]. In 2018, Liu Ju et al. proposed a method for pretreating
the water level data by using a semi-parametric model to eliminate the jitter caused by the deviation of the pressure gauge data [4].
Different from these existing researches, this paper designs a water level data based on the Savitzky-Golay filter (referred to as SG filter) algorithm for the need to establish a water level prediction model using LSTM (Long Short-Term Memory) network. Pre-processing methods to provide good training data to improve the accuracy of the water level prediction model.
Deviation Analysis of Inland Water Level Data
The current water level data mainly comes from water level observation stations including artificial observation stations and automatic observation stations. It is well known that any measured data may have certain deviations, and such data with deviations will inevitably affect subsequent prediction results. Therefore, it is very necessary to perform targeted preprocessing based on the deviation characteristics of the data to improve the accuracy of the prediction.
For the data collected by the water level observation station, there are three main sources of deviation: systematic deviation, random deviation, and coarse deviation.
1) System deviation
The traditional manual observation method using water gauge, stylus or overhanging water level gauge, the deviation comes from the accuracy of the observation equipment. Similarly, the automatic water level observation method includes the use of a float type water level gauge, a bubble pressure water level gauge and an ultrasonic water level gauge, etc., and any measurement equipment may cause systematic deviations. For such systematic deviations, weighting and other methods are needed to reduce the influence of deviations.
2) Random Deviation
Random deviation refers to when a Hydrologic object is measured multiple times under the same conditions, the absolute value of the deviation and the change of the symbol or the time is small or time positive, and there is no definite law available for inquiry, which has randomness.
For random deviations, the data deviation values obtained by multiple measurements generally do not exceed a certain limit and conform to the laws in statistics. Therefore, it can be processed by statistical principle to reduce the impact of random deviations.
3) Gross deviation
Gross deviation means that the collected data obviously exceeds the measurement result and is a major deviation that distort the measurement result.
For inland water levels, gross deviations usually refer to deviations of >4 cm-6 cm with accurate water levels. Generally, the method of culling data will be taken.
Water Level Data Preprocessing Based on SG filter
As mentioned above, there are various deviations in the current historical water level timing, including a large amount of noise, and sometimes the data cannot be collected in time due to equipment failure, and the timing data is incomplete.
In this paper, a cleaning method based on SG filter is proposed to preprocess the water level data to remove the noise in the data and eliminate the influence of deviations, especially coarse deviations and random deviations.
Basic Theory of SG Filters
SG filter, also known as least squares or data smoothing polynomial filter, originally proposed by Savitzky and Golay, and widely used in data stream smoothing and denoising, is a filtering method based on local polynomial least squares fitting [5]. The biggest feature of the SG filter is that it can filter out the noise while ensuring the shape and width of the signal, and can effectively suppress the random fluctuations contained in the time series data.
The SG filtering method uses the least squares fitting principle to filter through moving windows. Take the M sample points around x in the original data, and set xi to the origin, that is, construct an array of windows containing 2M+1 sample points centered on xi, and then constructs a p-Order polynomial q(n)k0ak p nk To be an array, MnM,p2M1 [6-7]. Define functions: C (q(n)x(n)) ( aknkx(n) k0 p
) nM M
nM M
(1) When the formula (1) takes the minimum value, the fitting effect is best, and then all the fitting points of the original data can be obtained by moving the window array. During the fitting process, the noise portion that deviates too far from the normal trend curve is discarded, so the method can smooth the data.SG Filter Window Width Selection
The filtering effect of the SG filter varies with the selection of the window width and can meet the needs of many different occasions [8]. In this paper, different window widths will be selected for denoising and smoothing of water level data.
The data window size and the fitting order have a great influence on the processing effect of the SG filtering algorithm [9]. For the above water level data, in order to obtain a better smoothing effect, the signal-to-noise ratio (SNR) and the mean square deviation (MSE) are used. The evaluation method examines the influence of the data window and the fitting order on the smoothing effect and selects the parameters suitable for the water level data by rating comparison.
The fitting order is 3, and the meaning of the SG filtering algorithm shows that the width of the data window can only select odd numbers of positive values. According to the water level data characteristics, the odd-numbered data window width between 5-20 is selected to evaluate the relationship between the smoothing denoising index and the data window. The experimental results are shown in Fig. 1.
Figure 1. Relationship between smoothing denoising indicators and data windows
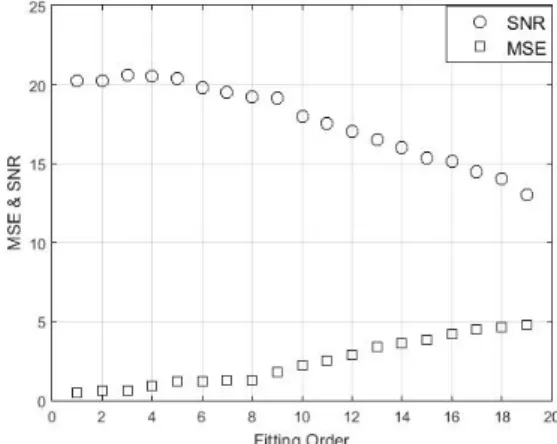
Figure 2. Relationship between smoothing denoising index and the fitting order
It can be seen from Fig. 1 that the signal-to-noise ratio increases as the data window increases, and the mean square deviation decreases as the data window increases. It stabilizes when the data window increases to 17. It shows that the low frequency component contains the main information of the signal, while the high frequency component is mainly noise. As the window increases, the high frequency component gradually decreases, the low frequency component is prominent, and when the data window continues to increase, the high frequency component is weakened. The effect is no longer obvious.
Fig. 2 shows the relationship between the smoothing denoising index and the fitting order when the data window is fixed (17).
It can be seen from Fig. 2 that when the fitting order is 0~4, the denoising effect is ideal. At 5~14, the signal-to-noise ratio shows a significant decreasing trend, while the mean square deviation shows an increasing trend, indicating the fitting. The increase of the order does not significantly suppress the high-frequency noise component. On the contrary, the lower limit of the high frequency is reduced due to the increase of the fitting order, so that the noise is not well suppressed.
Water Level Data Denoising Based on SG Filter
This paper uses historical water level data of a water level station in the lower reaches of the Yangtze River as experimental data. Fig. 3 shows the raw data for 762 days.
Figure 3. Raw water level data of a water station for 762 days
It can be seen from Fig. 3 that due to the influence of gross deviation, there are a lot of noise and fluctuations in the original water level data of 762 days, and even there is negative water level data, which is definitely contrary to reality. The main performance of the quality of this part of the original data is the existence of a small number of vacancy values and outliers.
When the signal is filtered by the SG filter, the low frequency components in the signal are actually fitted, and the high frequency components are smoothed out. If the noise is at the high frequency end, the result of the filtering is to remove the noise. According to the above SG window selection analysis, first, an SG filter having a window width of 17 and an order of 3 is used to perform noise removal processing on the water level data. Fig. 4 is a comparison of data trends before and after denoising processing.
Figure 4. Comparison of water level data trend before and after SG filter denoising
It can be seen from Fig. 4 that the water level data curve after denoising preprocessing is obviously smoother than the unprocessed, the data quality is higher, and the characteristics of the time series are more prominent.
Water Level Data Smoothing Based on SG Filter
The SG filter has an obvious effect on eliminating noise, and at the same time, through the adjustment of the window wideband, it can also have a good effect on the smoothing of small fluctuations due to random deviations.
Fig. 5 is an enlarged view of the 112-day water level data in Fig. 4, from which it can be seen that the water level data still has small fluctuations after denoising.
Figure 5. 112 days of water level data Figure 6. Trend comparison of water level data before and
after smoothing
The denoised data is further smoothed by the SG filter. It is found through experiments that when the width of the window is increased to 25 and the order is 3, the higher frequency noise can be further suppressed, and the experimental data image is smoothed. The processing result is shown in Fig. 6.
It can be seen from Fig. 6 that the water level data waveform smoothed by the SG filter with a window width of 25 orders is more stable, which is more conducive to revealing the nature of the time series data, thereby effectively reducing the influence of random deviations on the final prediction result.
Water Level Data Preprocessing Effect Verification
In order to verify the deviation suppression effect of the SG filter based on water level data preprocessing method, this paper establishes an LSTM based water level prediction model for experimental verification.
LSTM, a long-term and short-term memory network, is a time recursive cyclic neural network widely used in translation language, image analysis, document abstraction, speech recognition, disease prediction, stock prediction, ship trajectory analysis and other tasks [10]. This paper uses Google's TensorFlow deep learning framework to rely on the TFTS library to program the LSTM-based water level prediction model.
Firstly, a set of water level data that has not been processed by the SG filter is selected for experiment. The LSTM algorithm is used for training. Fig. 7 is the predicted image without data deviation processing (the image after the dotted line is the predicted image). It is very messy and seriously affects the prediction effect, which leads to too much deviation between the predicted result and the actual value.
Figure 7. Unprocessed water level data predicted by LSTM data
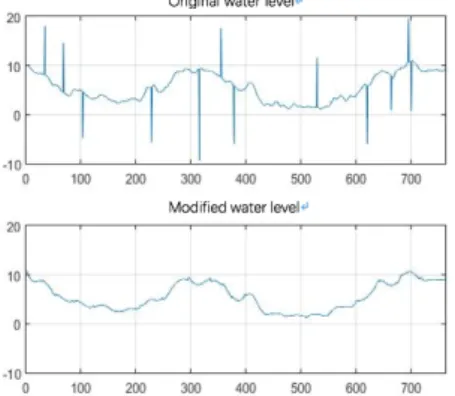
Figure 8. The processed water level data is predicted by LSTM data
Next, the set of water level data is processed by the SG filter. As shown in FIG. 8, the LSTM model simultaneously trains and predicts the set of data, and still obtains the calculated graph and the predicted graph. During the training process, the graphics of the training and the graphics of the original observation data are basically consistent. From the deviation analysis point of view, the
calculation graph is in good agreement with the original graph, and the deviation analysis in the next step can be performed.
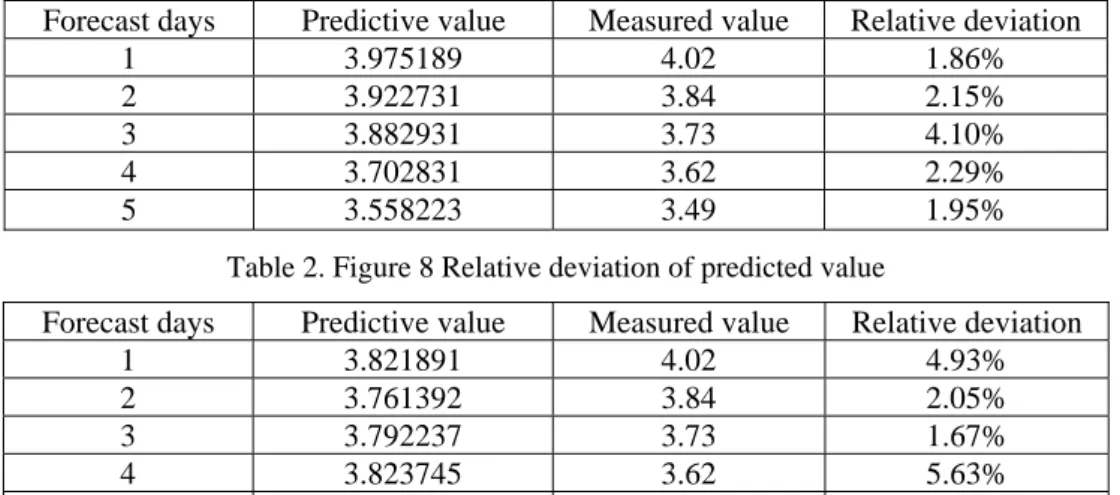
Take the predicted values and measured values of the first five days of the prediction results of the two models in Fig. 7 and Fig. 8 to establish Tables 1 and 2, and analyze the predicted results, as shown in Table 1 and Table 2 below:
Table 1. Figure 7 Relative deviation of predicted value
Forecast days Predictive value Measured value Relative deviation
1 3.975189 4.02 1.86% 2 3.922731 3.84 2.15% 3 3.882931 3.73 4.10% 4 3.702831 3.62 2.29% 5 3.558223 3.49 1.95%
Table 2. Figure 8 Relative deviation of predicted value
Forecast days Predictive value Measured value Relative deviation
1 3.821891 4.02 4.93% 2 3.761392 3.84 2.05% 3 3.792237 3.73 1.67% 4 3.823745 3.62 5.63% 5 3.887462 3.49 11.39%
The average deviation between the five-day predicted and measured values in Table 1 is 5.13%, while the average deviation in Table 2 is 2.47%. From the deviation data, the deviation of the prediction result of the processed data of Fig. 8 is less than half of the deviation of the prediction result of the unprocessed data of Fig. 7. From the image, the training image of Fig. 8 is significantly closer to the original image than the image of Fig. 7. Therefore, the water level data processing method can effectively process the water level data, making it more in line with the time series data form, and is helpful for the next prediction work.
Summary
The water system in the Inner River Basin is complex, and each water level site is affected by different factors, and the water level change law is difficult to find. The use of historical water level data to model the future water level has become a common means of water level prediction. However, the quality of the original water level data is uneven, and for accurate modeling, these raw data needs to be preprocessed.
This paper first analyzed the deviation sources of inland water level data, and summarizes several different deviations such as systematic deviation, gross deviation and random deviation. According to the characteristics of water level data, the method of water level data preprocessing was studied by SG filter, and the window width and order parameters of SG filter suitable for water level data were analyzed. Different window width and order parameters were determined for different processing of noise and small waveform smoothing. The water level data processed by the SG filter has better data quality and can highlight the characteristics of the time series.
At the end of the paper, the LSTM-based water level prediction model was built to verify the water level data prediction method. The results of deviation comparison show that the water level data processed by the SG filter significantly improves the prediction accuracy compared with the unprocessed raw data, so that the trained water level prediction model has better prediction effect.
Acknowledgement
This research was financially supported by the National Science Foundation of China (61772102), the Fundamental Research Funds for the Central Universities (3132016322).
References
[1] Li Xue yu, Processing method and programming of water level data for bathymetric survey[J]. Port & Waterway Engineering, (2009)07-0154--03:154-156.
[2] Li Hou yong, Research and application of self-recording water level data post-processing system[J]. Yangtze River, (2017)Vol.48:81-83.
[3] Liu Ju, Bao Jingyang, et al. Research on Tidal Data Pre-processing Method Based on Semi-parametric Model [J]. Hydrographic Surveying and Charting, (2018),38(02):16-20.
[4] Yi Yunfei, Sheng Kang, Time series analysis based short-term forecasting model simulation of water level[J]. Computer Engineering and Design, (2016), 37(5):1332-1334.
[5] Savitzky A. Smoothing and differentiation of data by simplified least squares procedures[J]. Anal. Chem. (1964), 36.
[6] Cai Tianjing, A Survey of the Least Squares Fitting Principle of Savitzky-Golay Smoothing Filter [J]. Digital Communication. (2011), 38(1):63-68.
[7] Zengguang Z, Ping T. VI-Quality-Based Savitzky-Golay Method for Filtering Time Series Data[J]. Remote Sensing Technology and Application, 2013.
[8] Li peisheng, et al. Coal DTG curve denoise based on savitzky-golay method[J]. J. Huazhong Univ. of Sci . & Tech (Nature Science Edition). 2005, 33(7):61-64.
[9] Zhou Z G,Tang P. VI-Quality-Based Savitzky-Golay method for filtering time series data[J]. Remote Sensing Technology and Application,2013,28(2):232-239.
[10]Quan bo, et al. Prediction Model of Ship Trajectory Based on LSTM [J]. Computer Science,2005, 33(7): 61-64.