Managing
Circular Debt
Table of Contents
Contents
Executive Summary __________________________________________________________ 1 Strategic Highlights _________________________________________________________ 1 Introduction _________________________________________________________________ 5 History since 2013 __________________________________________________________ 5 Major Contributors to Circular Debt _____________________________________________ 7 Government Objectives and Strategy for Tackling CD ______________________________ 8 Dealing with Sector Inefficiencies ________________________________________________ 9 Technical and Non-technical Losses ____________________________________________ 9 Low Collections by DISCOs from Private and Government Consumers _______________ 10 QESCO and K-Electric Tube-Wells ____________________________________________ 11 Discrepancies in Tariff Regime _________________________________________________ 13 Policy Induced Debt ________________________________________________________ 13 Late Payment Surcharge ____________________________________________________ 14 Delays in Tariff Determination ________________________________________________ 15 Fiscal Requirements and Government Inefficiencies ________________________________ 16 Tariff Differential Subsidy ___________________________________________________ 16 GST Non Refunds _________________________________________________________ 16 Azad Jammu and Kashmir (AJ&K) ____________________________________________ 17 FATA ___________________________________________________________________ 18Table of Tables
Table of Tables
Table 1: Year on Year Circular Debt Flows (FY 2015-2018) ... 2
Table 2: Year on Year Circular Debt Stock (FY 2015-2018) ... 2
Table 3: Quarter on Quarter Circular Debt Flows (FY 2015-2018) ... 3
Table 4: Quarter on Quarter Circular Debt Stock (FY 2015-2018) ... 3
Table 5: Outstanding PHCL Debt ... 4
Table 6: Flow Buildup Scenarios ... 4
Table 7: Comparison of Losses in FY2014 and FY2015 ... 9
Table 8: Expected Reduction in CD Flows From Improved DISCO Performance ... 10
Table 9: Plan for Reduction of Government Receivables ... 11
Table 10: Reduction in CD Flows from QESCO Area and Tube wells ... 12
Table 11: Plan for Reduction of PHCL Debt ... 13
Table 12: Flow of CD Resulting from Policy Induced Debt Costs... 13
Table 13: Stock of Policy Induced Debt Service Costs ... 14
Table 14: Year on Year Stock Position ... 14
Table 15: Expected Reduction in CD Flows From Delays in Tariff Determination ... 15
List of Abbreviations
Abbreviations
ATC Aggregate Technical And Commercial Losses
CPPA Central Power Purchasing Agency
CD Circular Debt
CCI Council of Common Interests
DISCOs Distribution Companies
ECC Economic Coordination Committee
GENCOs Generation Companies
GOP Government of Pakistan
IPP Independent Power Producer
MDT Minimum Determined Tariff
MOWP Ministry of Water and Power
MYT Multi-Year Tariff
NTDC National Transmission & Despatch Company
PHCL Power Holding Company Limited
TDS Tariff Differential Subsidy
IESCO Islamabad Electricity Supply Company Limited
FESCO Faisalabad Electricity Supply Company Limited
LESCO Lahore Electricity Supply Company Limited
QESCO Quetta Electricity Supply Company Limited
GEPCO Gujranwala Electricity Supply Company Limited
MEPCO Multan Electricity Supply Company Limited
PECO Peshawar Electricity Supply Company Limited
TESCO Tribal Electricity Supply Company Limited
HESCO Hyderabad Electricity Supply Company Limited
Pg. 01
Executive Summary
Executive Summary
Strategic Highlights
The Government of Pakistan (GOP) under a circular debt management plan intends to reduce circular debt (CD) from Rs. 314 billion (as of end June 2015) to Rs. 212 billion by Financial Year Ending June 30, 2018 (FY2018) while keeping within the targets of 0.4% of GDP for subsidies to the power sector (about Rs. 128 billion) and 4% fiscal deficit. At the end of each month, the CD will be maintained below the cap of Rs. 314 billion. The circular debt
management plan (or capping mechanism) will include reducing the increase of CD (flow) as well as the stock (outstanding amount). Policy induced public sector power entity debt
including Power Holding Company Limited (PHCL) debt will be reduced from Rs 335 billion to Rs 220 billion by FY2018. Public sector power companies’ collections are planned to increase by 5% by FY2018 and losses are planned to reduce by 1.7% by FY2018 through efficiency gains, privatization, and private sector participation. Collection from government customers will be rationalized and subsidies will be on actual basis and paid according to schedule.
GOP will continue to take measures to rationalize the tariff which covers all cost including debt servicing and ensure sufficient budgetary provision of subsidies for Baluchistan tube-wells, FATA and AJK consumers. A summary forecast of yearly CD flows and stock in the most likely case is shown in Table 1 and Table 2 respectively outlining the contributing factors and their respective contributions. A more detailed quarterly forecast of CD flows and stock for last quarter of FY2015 and FY2016 in the most likely case is shown in Table 3 and Table 4.
Pg. 02
Executive Summary
Table 1: Year on Year Circular Debt Flows (FY 2015-2018)
Flow Summary Actual Projected
(Rs. In Million) FY2015 FY2016 FY2017 FY2018
Sector Inefficiencies
Excess line losses
49,937 31950 17,948 10,533
QESCO and K-Electric tube-wells 33,504 2,328 2,377 2,253 Private receivables including FATA 41,058 41,398 25,937 21,280 Discrepancies in tariff regime
Late payment surcharge
8,272 4,971 3,950 1,658
Debt Service for Policy Incurred Debt 22,558 - - - Delay determinations 10,600 7600 4,560 1,824 Fiscal requirements and government inefficiencies AJK supplies 15,238 - - - GST Non Refund 14,296 - - - Other government receivables 13,831 3,420 1,893 1,454 Total 209,294 91,668 56,664 39,002
Table 2: Year on Year Circular Debt Stock (FY 2015-2018)
Stock Summary Actual Projected
(Rs. In Million) FY2015 FY2016 FY2017 FY2018
Sector Inefficiencies
Excess line losses 81,657 96,732 108,430 112,713
QESCO and K-Electric tube-wells 54,688 49,016 43,393 37,646 Private receivables including FATA 43,249 30,647 31,584 30,363 Discrepancies in tariff regime
Late payment surcharge 13,388 1,079 - -
Debt Service for Policy Incurred Debt 34,015 22,203 17,828 13,453 Delay determinations 17,220 11,320 10,880 7,704 Fiscal requirements and government inefficiencies AJK supplies 24,372 17,872 11,372 4,872 GST Non Refund 22,899 1,899 - - Other government receivables 22,130 17,551 11,443 4,898 Total 313,618 248,318 234,930 211,649
Pg. 03
Executive Summary
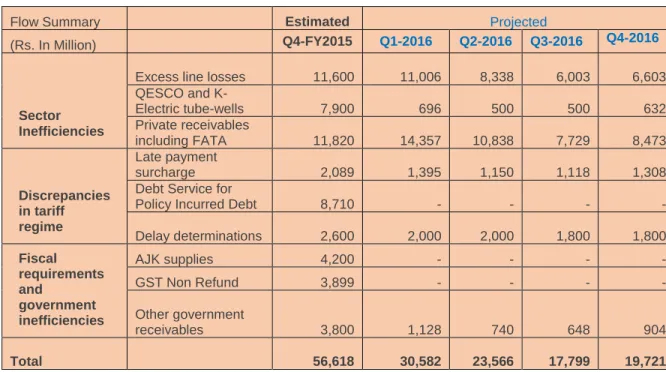
Table 3: Quarter on Quarter Circular Debt Flows (FY 2015-2018)
Flow Summary Estimated Projected
(Rs. In Million) Q4-FY2015 Q1-2016 Q2-2016 Q3-2016 Q4-2016
Sector Inefficiencies
Excess line losses 11,600
11,006 8,338 6,003 6,603 QESCO and K-Electric tube-wells 7,900 696 500 500 632 Private receivables including FATA 11,820 14,357 10,838 7,729 8,473 Discrepancies in tariff regime Late payment surcharge 2,089 1,395 1,150 1,118 1,308
Debt Service for
Policy Incurred Debt 8,710 - - - -
Delay determinations 2,600 2,000 2,000 1,800 1,800 Fiscal requirements and government inefficiencies AJK supplies 4,200 - - - - GST Non Refund 3,899 - - - - Other government receivables 3,800 1,128 740 648 904 Total 56,618 30,582 23,566 17,799 19,721
Table 4: Quarter on Quarter Circular Debt Stock (FY 2015-2018)
Stock Summary Estimated Projected
(Rs. In Million) Q4-FY2015 Q1-2016 Q2-2016 Q3-2016 Q4-2016
Sector Inefficiencies
Excess line losses 81,657 92,663 90,875 93,503 96,732
QESCO and K-Electric tube-wells 54,688 47,384 47,884 48,385 49,016 Private receivables including FATA 43,249 57,606 41,444 35,674 30,647 Discrepancies in tariff regime Late payment surcharge 13,388 14,783 5,133 852 1,079
Debt Service for Policy Incurred Debt
34,015 30,472 22,203 22,203 22,203 Delay determinations 17,220 19,220 14,470 12,895 11,320 Fiscal requirements and government inefficiencies AJK supplies 24,372 17,872 17,872 17,872 17,872 GST Non Refund 22,899 1,899 1,899 1,899 1,899 Other government receivables 22,130 15,258 15,998 16,646 17,551 Total 313,618 297,156 257,779 249,928 248,318
Pg. 04
Executive Summary
Expected Sale Proceeds: The expected sale proceeds will be used/adjusted to pay off principal amount of PHCL debt.
The amount of outstanding PHCL debt after principal repayments from privatization proceeds will be as follows:
Table 5: Outstanding PHCL Debt
Stock Summary Actual Projected
(Rs. In Million) FY2015 FY2016 FY2017 FY2018
Policy induced Public Sector Power Entity
Debt 335,000
335,000 272,500 220,000
Privatization may envisage that if any write-offs are required then they may be handled with the advice of Financial Advisors (FAs) and would take care of outstanding liabilities of the
company.
We have examined various scenarios for flow buildup. The most likely scenario is as follows:
Table 6: Flow Buildup Scenarios
Scenarios - Flow Buildup Projected
(Rs. In Million) FY2016 FY2017 FY2018
Pg. 05
Introduction
Introduction
This working paper addresses the CD issue in the Pakistan power sector and describes a mechanism to: (i) maintain a cap of Rs. 314 billion1 on the CD (ii) reduce circular debt from Rs. 314billion (as of end June 2015) to Rs 212 billion by FY2018 and (iii) reduce PHCL debt from Rs 335 billion to Rs 220 billion by FY2018. CD is the amount of payables within the Central Power Purchasing Agency (CPPA) that it cannot pay to power generation companies (Independent Power Producer (IPP), government owned thermal generation companies (GENCOs), the hydropower producer (WAPDA Hydel) and National Transmission & Despatch Company (NTDC). The revenue shortfall cascades through the entire energy supply chain, from electricity generators to fuel suppliers, refiners, and producers; resulting in a shortage of fuel supply to the GENCOs and IPPs and thereby reduce power generation and thus increase in load shedding.
History since 2013
CD first emerged in FY 2007 as an outstanding overdue liability to power supply companies (GENCOs, IPPS and their fuel suppliers). The tariffs determined by NEPRA were increased while government notified customer tariffs were not raised to the same level. Tariff differential subsidies, the difference between these two tariffs, were not paid in a timely manner
exacerbating the financial situation of the power sector while the increasing dependence on imported fuel and its rising cost multiplied the effect. Since that time, CD has restricted utilization of the power sector in Pakistan, suppressing utilization of existing generation capacity as well as investment in new capacity. Issues related to litigation with power producers, and non-payment on several accounts to power generation companies are
attributable to this phenomenon. Various governments have tackled or tried to tackle the issue of CD. Most of these efforts were restricted to injection of cash into the sector to ease the liquidity crunch that was the result of CD. The standalone approach of cash injection gave only
1
This is the gross amount of payables owed to power generation companies and National Transmission Despatch Company (NTDC) including the due and overdue amounts at the end of each month. The end of month figure is quoted in this paper because it is a close
Pg. 06
Introduction
a temporary relief, and the issue emerged again with larger impact. The reforms attempted did not have the full intended effect.
The current government has adopted a different approach. When it took charge in May 2013 the CD stood at Rs. 503 billion. Power sector entities were at the brink of financial collapse and the entire sector was touching levels of financial meltdown. The logical approach was to immediately ease the liquidity crunch. That was done through a cash injection of Rs. 480 billion. But the issue was not left at this level. While the sectoral entities were eased of the financial crunch, parallel diagnostics and analysis were initiated to understand the dynamics and causes of the buildup of the CD. The outcome of the exercise was to understand the reasons, their contribution, their solution and a reduction in the buildup and elimination of CD.
The stock of CD, however, continued to accumulate and had reached Rs. 244 billion by July 2014, an average monthly increase of Rs 18 billion compared with the FY 2013 accumulation of Rs 20 billion per month. In FY 2015 the stock had increased to Rs. 321 billion by November 2014, showing an average addition in the flow of Rs. 15 billion each month. Had this trend of a monthly Rs. 15 billion increase continued, the CD at the end of March 2015 would have been Rs. 382 billion. A tariff increase and surcharges which would decrease CD, scheduled in July 2014 were delayed to October 2014 and January 2015.
In December 2014, the CD stood at Rs. 280 billion, Rs. 102 billion less than would otherwise have accrued, for the following reasons:
i. Merit-Order dispatch of power generation plants reduced the generation cost by Rs. 21 billion in the months of November and December 2014. Efficient plants were dispatched first and thus expensive power generated by inefficient GENCOs was dispatched last.
ii. Vigilant monitoring by the Ministry of Water and Power (MOWP) improved
recoveries of current dues from 86% in November 2013 to 91% in December 2014. iii. Targets were given to public sector distribution companies (DISCOs) for recovery
of past receivables from both the private and government consumers which stood at Rs. 5.8 billion in January 2015 and Rs. 5.3 billion in February 2015.
The improvements in transparency of merit order, planned structural reforms to increase accountability by separating CPPA from NTDC, overseen by a strengthened NEPRA will support improved performance in the short term. GOP will continue, as owner, to enforce the terms of NTDC and DISCOs’ performance contracts and report to the public in its regular
Pg. 07
Introduction
quarterly monitoring reports. MOWP has introduced a rigorous system for monitoring daily, weekly and monthly performance under the personal supervision of the Secretary.
In addition the following two factors also reduced the stock of CD during FY 2015:
i. Commercial borrowing of Rs. 25 billion in December 2014 and Rs. 40 billion in January 2015, which was done through PHCL.
ii. The falling prices of oil reduced the value of electricity lost.
Now the total payables to power generation companies has decreased further and as of end March 2015, the CD stood at of Rs 279 billion.
History has shown that these measures alone are likely to be insufficient to bring the flows to zero until the actual performance of all of the DISCOs matches the levels considered by the regulator to be efficient. Moreover, alternative revenue provisions are needed where DISCOs cannot recover their costs from tariffs including proper fiscal provisions that cover all subsidies.
Major Contributors to Circular Debt
The major sources and contributors of buildup of CD are as follows.
• Sector inefficiencies
The sector’s inefficiencies stem from DISCOs having higher levels of losses and lower levels of collections than those allowed by the regulator. Some DISCOs are at or close to the NEPRA-determined levels of losses and collections. Less well performing DISCOs experience levels of losses that are up to 5-10% worse than those allowed, and of collections that are up to 20-30% lower than the 100% recovery assumed by the regulator, as owner of these entities. In FY 2014, sector inefficiencies added Rs. 88 billion to CD and accounted for Rs. 60 billion for FY 2015 up to March 2015.
• Discrepancies in tariff regime
Beside sector inefficiencies noted above, tariffs do not capture the full cost of supply of electricity. Factors include delay in determination by NEPRA. Until recently the late payment surcharge charged by IPPs due to late or short payment of invoiced amounts but not allowed to be collected in the tariff and service of debt incurred to pay for operational inefficiencies
beyond the NEPRA target were also not permitted to be collected in the tariff.
Pg. 08
Introduction
Some costs are imposed on the DISCOs by virtue of government policy. These include the subsidy for those who consume less than 300kWh/month. In addition, government has agreed a special tariff for electricity supply to AJK which does not reflect cost. To compensate, the government provides subsidies to DISCOs. However, these subsidies are sometimes under budgeted or provided late which increases the CD. Furthermore, Federal and Provincial government departments often fail to pay their bills, which adds to the stock of payables, imposing further costs on the DISCOs. In addition, GST collected by the tax authorities on unpaid bills is not refunded to the DISCOs, leaving them out of pocket.
Government Objectives and Strategy for Tackling CD
The objective of the GOP is to have a financially self-sustaining power sector to support economic growth which implies the elimination of the CD. To that end, GOP will pursue the following strategies:- Improved Efficiencies. The strategy for improving efficiency is based on a gradual decrease in the losses and increase in the collections from consumers. Working on the same strategy, collections have seen an improvement in FY 2015 in the range of 89.2% as opposed to the previous rate of recoveries in FY 2014 of 87%. Losses stabilized at 18.7% in the same period. The plan for management of CD until the end of FY 2018 is based on the same strategy and principles.
- Surcharges: Surcharges are levied under Section 31(5) of the Regulation of Electricity Generation, Transmission and Distribution Act 1997 (the NEPRA Act). Surcharges will be set at the level that will rationalize subsidies and allow recovery of full cost of supply of electricity.
- Privatization Receipts: With the majority of DISCOs in the privatization plan of the GOP, the receipts from privatization will be partially used to reduce/offset the stock of the PHCL debt and will reduce the need for budget to finance costs that cannot be met from other revenue sources. The CD management plan is thus dependent on the privatization of the DISCOs and GENCOs.
Pg. 09
Dealing with Sector Inefficiencies
Dealing with Sector Inefficiencies
Technical and Non-technical Losses
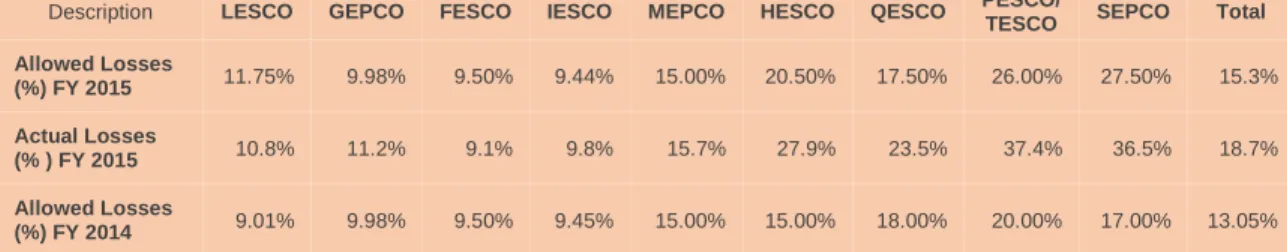
The FY2015 tariff determination process was completed in the second week of April 2015 when the last determination of a DISCO was issued. Table 7 shows a comparison of losses that the regulator has allowed in the determination for each company.
Table 7: Comparison of Losses in FY2014 and FY2015
Description LESCO GEPCO FESCO IESCO MEPCO HESCO QESCO PESCO/
TESCO SEPCO Total
Allowed Losses (%) FY 2015 11.75% 9.98% 9.50% 9.44% 15.00% 20.50% 17.50% 26.00% 27.50% 15.3% Actual Losses (% ) FY 2015 10.8% 11.2% 9.1% 9.8% 15.7% 27.9% 23.5% 37.4% 36.5% 18.7% Allowed Losses (%) FY 2014 9.01% 9.98% 9.50% 9.45% 15.00% 15.00% 18.00% 20.00% 17.00% 13.05%
Action Plan: NEPRA issued the tariff determinations for FY 2014 for most of the DISCOs in January 2014. Allowed losses for DISCOs for 2013-14 were 13.02% compared to 18.7%. The 5.6% difference between determined loss and actual loss accumulated as CD of Rs 33.6 billion in FY 2014. The determinations for FY 2015 allowed 15.3% compared with expected losses of 18.70%, narrowing the gap between allowed and actual losses but will still result in
accumulation of CD of Rs. 32 billion due to increase in generation. In the short term there is little that can be done about the flow because the tariffs have been determined. NEPRA as a condition of its determinations requires DISCOs to conduct a study on technical losses to justify the need for increase and to set out future loss reduction initiatives, to be conducted by independent consultants but the results are unlikely to show an effect until FY2016
determinations. For the purposes of this CD management plan, it is assumed that reductions in losses will reduce the flow of CD from Rs. 32 billion to Rs. 11 billion as per Table 8.
The privatization program will also be likely to reduce excess line losses, to the extent of the companies that will be privatized. With expected privatization of three DISCOs in FY2016, multi-year tariff (MYT) will have been determined instead of annual tariff determinations and this will give incentivizes to the new owners to improve losses against NEPRA benchmarks; in any event, the costs of any underperformance will be the responsibility of the new owner. For the DISCOS not privatized, the surcharge mechanism will still be used to rationalize subsidies
Pg. 10
Dealing with Sector Inefficiencies
and recover costs of service. Table 8 shows the expected reduction in flows of circular debt as a result of this part of the management plan.
Table 8: Expected Reduction in CD Flows From Improved DISCO
Performance
Excess Losses (Rs. In Million)
Actual
FY2015 FY2016 FY2017 FY2018
Per Annum Build Up of Flow 31,950 17,948 10,533
Low Collections by DISCOs from Private and Government
Consumers
Collections from private sector in most of the DISCOs have been an issue which contributed to the buildup of CD. Actual recovery fluctuates between 89-91% for the current financial year, whereas tariff determinations assume 100%. Low collections have created a shortfall of Rs. 114 billion from private consumers since the clearance of CD in July 2013. This less than 100% collection is more pronounced in the five poorest performing DISCOs namely PESCO, TESCO, HESCO, SEPCO and QESCO.
Action plan: The plan is divided into three parts. For all five distribution companies,
recoveries will be managed through power rationing. Experience in K-Electric has shown that this kind of approach can improve collections significantly and quickly. For all DISCOs, the aggregate technical and commercial losses (ATC) for each feeder will be categorized by feeder into four: low (<10% ATC), medium (11-20% ATC), high (21-40% ATC) and very high (>40% ATC). The second part of the plan is to outsource to the private sector collections of bills in areas where recoveries are weakest, based on the same categorization mentioned in the preceding paragraph. This will build on experiences in K-Electric, LESCO, MEPCO and PESCO areas. Tender for further outsourcing in MEPCO, PESCO, TESCO, HESCO, SEPCO QESCO and MEPCO will be advertised within next three months, with a view to contracts being in place by the start of November 2015.
The third part will address collection of Federal and Provincial government bills. For all Federal accounts, MOWP will notify DISCOs that non-payment beyond the billing cycle of 45 days should result in disconnection, per commercial procedures. MOWP will move a summary to the Council of Common Interests (CCI) proposing more stringent requirements for Provincial
Pg. 11
Dealing with Sector Inefficiencies
departments. It will request CCI to approve 100% deduction at source in the case of non-payment and disconnection for non-non-payment beyond normal commercial terms. MOWP will require DISCOs to take more rigorous action following disconnection, requiring prepayment for electricity before reconnection is approved.
The Government has already started action of collection from private consumers including initiation of revenue based load shed mechanism based on feeder wise AT&C losses. If the recovery is not affected, then the recovery will be ensured through law enforcement agencies (NAB and FIA) and incentive packages. The rationing system was introduced from August 1, 2015.
Current Portion of Stock: The current portion of stock on the account of government entities is Rs. 22 billion and will be adjusted to Rs. 5 billion from at-source deductions as well as improved recoveries during the period FY 2016-FY2018.
Current Portion of Flow: Given that the practice of deducting at source is to be further strengthened, such that all current billing is either to be covered by payments from Federal and Provincial agencies, or from source, the flow will reduce to zero as soon as the CCI decision is implemented. Table 9 shows the plan for reducing government receivables.
Table 9: Plan for Reduction of Government Receivables
Other Government Receivables (Rs. In Million) FY2016 FY2017 FY2018
Yearly Energy Supplies (GWh) 2,080 2,163 2,250
Annual Billing 22,803 25,236 29,083
Per Annum Build Up of Flow 3,420 1,893 1,454
QESCO and K-Electric Tube-Wells
History: There are around 29,000 tube-well customers in QESCO and K-Electric licensed areas covering Baluchistan. Between 2001 and 2010, tube-well owners were charged a flat rate of Rs. 4,000 per month/tube-well, which was increased to Rs. 6,000 per customer per month in 2012. Amounts between Rs. 6,000 and 75,000 per month are shared in the
proportion of 60:40 between the Government of Baluchistan and the Federal Government. The owner is responsible for all payments above Rs. 75,000 in any one month.
Pg. 12
Dealing with Sector Inefficiencies
Action Plan: The customer contribution has been further increased to Rs. 10,000 per customer per month for initial consumption at the start of FY2016. The balance up to Rs. 75,000 will continue to be covered by the Baluchistan and Federal Governments. Customers not paying their share either up to Rs. 10,000 or above Rs. 75,000 will be disconnected on normal commercial terms and will not be reconnected until arrears have been paid and meter has been installed for the connection. In order to curtail further buildup of flow, supply of electricity will be limited to billing of Rs. 75,000/tube well/month in QESCO licensed tube-well areas consequently ensure that flow buildup does not increased more than amounts projected in Table 10 below.
Table 10: Reduction in CD Flows from QESCO Area and Tube wells
Tube-Wells in QESCO Area
Amounts in Rs. Millions FY2016 FY2017 FY2018
Pg. 13
Discrepancies in Tariff Regime
Discrepancies in Tariff Regime
Policy Induced Debt
History: Leading up to 2008, DISCOs borrowed for operational costs which NEPRA did not allow to be recovered through the tariff. This debt is now in the process of being transferred to DISCO balance sheets in the total amount of Rs. 335 billion. The loans have tenors ranging from 5 to 7 years with reschedule and rollover options and interest payment rebates if payments are made promptly. NEPRA continues to disallow the cost of debt service in the tariff.
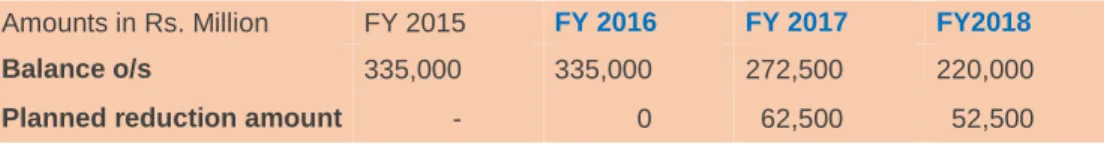
Action Plan: The government intends to reduce the PHCL debt from Rs. 335 billion to Rs. 220 billion by end of FY 2018. Principal will be paid from proceeds of privatization of power sector assets. To the extent possible privatization receipts will be used to cover the full outstanding amount. The projected reduction is shown in Table 11 below:
Table 11: Plan for Reduction of PHCL Debt
Amounts in Rs. Million FY 2015 FY 2016 FY 2017 FY2018
Balance o/s 335,000 335,000 272,500 220,000
Planned reduction amount - 0 62,500 52,500
Current portion of flow: The amount to be recovered through debt servicing surcharge is estimated at Rs. 30 billion and is sufficient to curtail further buildup of CD on this account. Table 12 shows that with principal repayments of Rs. 0, Rs 62.5 billion and Rs. 52.5 billion in
FY2016, FY2017 and FY2018 respectively, the accrued mark-up on outstanding loans will decrease from Rs. 30 billion in FY2016 to Rs. 20 billion in FY2018. The surcharge will be adjusted periodically to ensure complete elimination of flow on account of debt servicing cost beginning FY2016. The debt servicing amount is dependent on many factors including interest rate and utilization of privatization proceeds and therefore adjustments will be made on an annual basis to meet zero flow target for each year.
Table 12: Flow of CD Resulting from Policy Induced Debt Costs
Pg. 14
Discrepancies in Tariff Regime
PHCL Loans Outstanding
335,000 272,500 220,000
Markup on Outstanding Loans
30,150 24,225 19,800
Total Units Available for Sale (Gwh) 79,924 85,498 93,087
Privatization Proceeds to Pay PHCL Loans 0
62,500
52,500
Total Amount of Build Up
30,150 24,525 19,800
Amount Recovered Through Surcharges (adjusted for life line
and non-recoveries) 30,150 24,525 19,800
Per Annum Build Up of Flow 0 0 0
Stock of Debt: The total year-on-year outstanding CD stock after taking into account surcharge payments attributable to debt service will be reduced in the annual increments shown in Table 13 below.
Table 13: Stock of Policy Induced Debt Service Costs
Amount in Rs. Millions Actual Projected
FY2015 FY2016 FY2017 FY2018
Policy Induced Debt Service 34,015 22,203 17,828 13,453
Late Payment Surcharge
History: Another cost not considered by the regulator while determining the cost of service is the late payment interest (Kibor + 4%) imposed by the IPPs as per their power purchase agreements. It becomes due if payments for capacity or energy components are below invoiced amounts. Since the sector recoveries are to the tune of 89.2% from consumers, IPPs have often received short payments. For FY2015 the regulator has allowed the cost of late payment surcharges to be recovered from the consumer tariff. An estimated Rs. 13.0 billion of the stock of CD remains to be recovered.
Action plan: Taking into account buildup of flow as well as stock settlement, year on year CD figures will be as shown in Table 14.
Table 14: Year on Year Stock Position
Actual Projected
Rs. In Million FY2015 FY2016 FY2017 FY2018
Pg. 15
Discrepancies in Tariff Regime
Current portion of flow: Owing to the regulatory change, it is expected that by FY2017, there will be no or minimum flow of late payment surcharge.
Delays in Tariff Determination
History: Delays in the annual tariff determination for DISCOs stem from late submission of tariff petitions by DISCOs and the time it takes for NEPRA to conduct the determinations. The slow determination process has been made worse by poor quality petitions, the one-year tariff cycle and the need for all determinations to be conducted at once which has effectively resulted in the need to go at the pace of the slowest.
Action plan: The privatization program in which three DISCOs will be privatized in FY2016 is expected to reduce the problem because the cost of delays is shifted to the new owner which should be better positioned to manage the regulatory delay. Over the plan period seven DISCOs will be privatized. In addition by the end of the plan period, all DISCOS will have shifted to the MYT procedure, with the first three to five Discos expected to move in the first year. The MYT procedure reduces the workload in NEPRA in the longer run, thus allowing faster determinations, and in intermediate years adjustments to tariffs are formula-based and thus do not require lengthy determination periods.
For its part, GOP will increase its supervision of those DISCOs it continues to own to ensure that they are prompt in submitting tariff petitions and are responsive to any further
requirements of NEPRA.
Flows: A residual flow of about Rs. 1.8 billion is expected to remain from delays in tariff determination and it will be reduced as shown in Table 15. Late determinations can have a positive or a negative effect. A delay when costs are falling will bring forward revenues when costs are rising they will defer revenues. The flow projections in this plan assume rising costs of generation.
Table 15: Expected Reduction in CD Flows From Delays in Tariff
Determination
Delay in Determinations (Amount in Rs. Millions) FY2016 FY2017 FY2018
Delay in Determinations-Current Flow Build Up Per Annum 7,600 4,560 1,824
Pg. 16
Fiscal Requirements and Government Inefficiencies
Fiscal Requirements and Government
Inefficiencies
Tariff Differential Subsidy
History: Late payment of subsidies impacts buildup of CD. Subsidies which are under budgeted or where the budget amounts are breached due to external factors like court cases, add to the buildup of CD. It is government policy to focus tariff differential subsidy (TDS) on residential connections consuming up to 300 kWh/month which now account for about 76% of the TDS and for which GOP intends to budget fully.
The balance of the TDS has historically been used to maintain uniform tariff for all DISCOs and the NEPRA determined average tariff cannot be reached unless surcharges are allowed. NEPRA does not allow for charging of tariff above the determined tariff. Thus under uniform tariff, only the minimum determined tariff can be charged. Without the surcharge, the tariff differential subsidy increases.
Action Plan: The government intends to shift the cost of the uniform tariff from the TDS budget. For all tariff categories where subsidies are zero, an equalization surcharge has been levied the proceeds of which are used to fund the uniform tariff policy. The surcharges are consolidated into a “Universal Obligation Fund” to cross subsidize those DISCOs who have determined tariffs above the uniform tariff.
Flow: The government is committed to fully budget for the TDS, including any amount that may be needed until surcharges for the Universal Obligation Fund can be reinstated. There will thus be no incremental flow to the CD from this source.
Stock: There is no stock of CD attributable to late or non-payment of TDS.
GST Non Refunds
GOP levied Tariff Rationalization Surcharge in order to meet the NEPRA Determined Revenue Requirement of DISCOs by reducing the budget of Tariff Differential Subsidy within the limit of 0.3% of GDP. The levying of surcharges will also increase the tax revenue of Federal
Pg. 17
Fiscal Requirements and Government Inefficiencies
under Rules 14 (CHAPTER III) of Sales Tax Special Procedures Rules, 2007 for Collection and Payment of Sales Tax on Electric Power.
With the application of sales tax on the amount of tariff rationalization surcharges billed by DISCOs to consumers, the amount of output tax will increase accordingly as compared to the input tax charged on the cost of electricity by CPPA (G) which would then result in a
decreasing trend of circular debt stock from FY 2016 to 2018. Further, any variation in the fuel price is a pass through item and any adverse variation in cost of power purchase is recovered from consumer along-with sales tax as fuel price adjustment that also ensure recovery of increase in input cost from consumer as output tax.
Azad Jammu and Kashmir (AJ&K)
History: AJ&K receives power in bulk from three distribution companies: IESCO, PESCO and GEPCO. Currently AJ&K is paying Rs. 2.59/kWh against the GOP notified tariff of Rs.
11.87/kWh and the NEPRA determined tariff of Rs. 14.38/kWh. The concessional power tariff of Rs. 2.59/kWh for AJ&K tariff was determined by a subcommittee constituted under the Mangla Raising Agreement signed between Government of AJ&K and GOP in 2003. As of June 2015, AJ&K’s portion of stock is Rs. 24.4 billion to the total stock outstanding of Rs. 314 billion. In terms of flow, per annum build up on account of flow is Rs. 15.2 billion per annum or Rs. 1.3 billion per month. To stop increase in the flow of CD on account of AJ&K, two options, are under consideration. One option considers the possibility of lowering the supply and the other of increasing revenues from consumers; a combination of the two is also possible.
If neither option resolves the difference between AJ&K tariff and NEPRA determined tariff, GOP will pick up any remaining balance. It will make necessary budgetary adjustments in tariff cycle of FY 2016 which will completely eliminate buildup of flow of CD on account of AJ&K. The analysis in this paper has been made conservatively - on an assumption that in cases where options A and B fail, GOP will have to pick the entire flow on account of AJ&K. With AJ&K’s consumption steady in the range of 1400GWh per annum, the per annum impact on account of additional GOP support to AJ&K will range from Rs.12.8 to Rs. 13.7billion per annum. Table 16 shows the impact under this worst case.
Table 16: Impact of AJK Transfer on to Government Budget
AJ&K (Rs. In Million) FY2016 FY2017 FY2018
Number of Units Sold from Mangla (Gwh) 8,000 8,000 8,000
Pg. 18
Fiscal Requirements and Government Inefficiencies
NEPRA Determined Tariff (Rs./kWh) 11.54 11.98 12.65
AJK Consumer Tariff under Mangla
Agreement 2.84 3.09 3.34
Difference between NEPRA and AJK
Determined 8.70 8.89 9.31
Subsidy Per Annum (Rs. Million) 12,779 13,060 13,673
Subsidy from Federal Budget 100% 100% 100%
Subsidy from Federal Budget (worst
case) 12,779 13,060 13,673
Remaining Amount - - -
Per Annum Build Up Flow - - -
FATA
History: GOP has split out Tribal Electricity Supply Company Limited (TESCO) from the original company PESCO to determine its billing and subsidy requirements. TESCO is now an autonomous DISCO and manages its operations independently in that area. GOP policy is that the residential consumers of FATA should receive free electricity and hence, although there are tariffs determined and notified for all consumer categories, Federal Government budgets a subsidy to cover the cost of the residential consumers. FATA receivables are included within the private receivables category.
Action Plan: The government has decided to revisit its policy of provision of unlimited free electricity to residential consumers. It will ration electricity up to the quantity matching the budgeted subsidy. If collections can be improved, more electricity will be provided. Since most of the TESCO’s billing is domestic consumers (90%) and are entirely subsidized by the GOP, efforts will be made to recover 25% of the billing from TESCO consumers while the remaining 75% will be budgeted by the Federal government and paid for on behalf of consumers. Non-recoveries in FATA are projected at PKR 14.2 – 17.5 billion over FY16-18