* Email address: [email protected] 1 , [email protected] 2, [email protected] 3, [email protected]
An Efficient Three-phase Email Spam Filtering Technique
Tarek M. Mahmoud
1*, Alaa Ismail El-Nashar
2*, Tarek Abd-El-Hafeez
3*, Marwa Khairy
4*
1, 2, 3Faculty of science, Computer Sci. Dept., Minia University, El Minia, Egypt 4
Faculty of computers and Information Technology, Egyptian E-Learning University, Assuit, Egypt
ABSTRACT
Email spam is one of the major problems of the today’s Internet, bringing financial damage to companies and annoying individual users. Many spam filtering techniques based on supervised machine learning algorithms have been proposed to automatically classify messages as spam or legitimate (ham). Naive Bayes spam filtering is a popular mechanism used to distinguish spam email from ham email. In this paper, we propose an efficient three-phase email spam filtering technique: Naive Bayes, Clonal Selection and Negative Selection. The experimental results applied on 10,000 email messages taken from the TREC 2007 corpus shows that when we apply the Clonal selection and Negative selection algorithms with the naive Bayes spam filtering technique the accuracy rate is increased than applying each technique alone.
Keywords - Email spam, Machine Learning, naive Bayes Classifier, Artificial Immune System, Negative selection and Clonal Selection.
1. INTRODUCTION
The problem of spam (unwanted) electronic mails is nowadays a serious issue. The average of spams sent per day is 94 billion in 2012 representing more than 70% of all incoming e-mails [1], it turns out they add up to a $20 billion cost to society , according to a new paper called “The Economics of spam [2],”. Spam causes misuse of traffic, storage space and computational power. It causes also legal problems by advertising for a variety of products and services, such as pharmaceuticals, jewellery, electronics, software, loans, stocks, gambling, weight loss, and pornography, as well as phishing (identity theft) and malware distribution attempts [3], [4]. Many spam filtering techniques have been proposed to automatically classify messages as spam or legitimate (ham). Spam filtering in its simple form can be considered as a text categorization problem where the classes to be predicted are spam and legitimate [5]. A variety of supervised machine-learning algorithms have been successfully applied to email filtering task. A nonexhaustive list includes: naive Bayes classifiers [6], support vector machines [7], memory-based learning [8] AdaBoost [9], and a maximum entropy model [10].
White, black and grey listings of domain names, keyword-based filtering, heuristic-based filtering, etc are other filtering techniques that can be used to filter spam emails. All of these techniques, however, require heavy maintenance and cannot achieve very high overall accuracy. Goodman et al. [11] presented an overview of the field of anti-spam protection, giving a brief history of spam and anti-spam and describing major directions of development.
Artificial Immune System (AIS) is an area of research that bridges the disciplines of immunology, computer science and engineering [12][13][14]. The immune system has drawn significant attention as a potential source of inspiration for novel approaches to solving complex computational problems. The AIS concepts can be adapted to solve the email spam problem [15].
In this paper, a spam identification system that identifies and segregates spam messages from legitimate ones is proposed. The proposed system is based on both the classical naive Bayes approach and two of the artificial immune system models (Clonal Selection and Negative Selection). The paper is organized as follows: Section 2 describes naive Bayes approach to spam detection; The Artificial Immune System (AIS) approach to spam filtering is described in section 3; Section 4 describes the steps of the proposed spam
* Email address: [email protected] 1 , [email protected] 2, [email protected] 3, [email protected] filtering technique; Section 5 discusses the results of using the proposed spam filtering technique; and Section 6 draws conclusions from the work presented here.
2. NAIVE BAYES CLASSIFIER
Naive Bayes spam filtering is a popular mechanism used to distinguish spam email from ham email and it is based on machine-learning algorithms. Sahami et al. built a naive Bayes classifier for the domain of spam filtering [6]. In this classifier a probabilistic method is used to train a model of classification by using features (keywords) extracted from messages. Give two classes C = {C1 = spam, C2 = ham} and features f1, f2 , …, fn the probability that these features belong to a certain class using naive Bayes can be expressed as follows:
|1, 2, . . . , = ,,… ,|,,… , (1)
Assuming conditional independence, one can compute P (f1, f2, ... , fn|C) as follows: Pf1, f2, . . . , fn|C = ∏pf|C (2)
To classify an email message as spam, one can check if it exceeds a specific threshold: PC1 = spam|f1, f2, . . . , fn
PC2 = non − spam|f1, f2, . . . , fn>= β, 0 < β < 1 3
3. ARTIFICIAL IMMUNE SYSTEM
Biological Immune System (BIS) has been successful at protecting the human body against a vast variety of foreign pathogens. A role of the immune system is to protect our bodies from infectious agents such as viruses, bacteria, fungi and other parasites. BIS based around a set of immune cells called lymphocytes comprised of B and T cells. On the surface of each lymphocyte is a receptor and the binding of this receptor by chemical interactions to patterns presented on antigens which may activate this immune cell. Subsets of the antigens are the pathogens, which are biological agents capable of harming the host (e.g. bacteria). Lymphocytes created in the bone marrow and the shape of the receptor determined by the use of gene libraries [16].
AIS is a paradigm of soft computing which motivated by BIS. It based on the principles of the human immune system, which defends, as discussed above, the body against harmful diseases and infections. To do this, pattern recognition tasks are performed to distinguish molecules and cells of the body (self) from foreign ones (non-self). AIS inspire the production of new ideas that could be used to solve various problems in computer science, especially in security field.
The main role of a lymphocyte in AIS is encoding and storing a point in the solution space or shape space. The match between a receptor and an antigen may not be exact and so when a binding takes place it does so with strength called an affinity. If this affinity is high, the antigen included in the lymphocyte’s recognition region [17][18].
AIS contains many algorithms such as Negative selection algorithms, artificial immune network, Clonal selection algorithm, Danger Theory inspired algorithms, dendritic cell algorithms. Throughout this paper we used Clonal and Negative Selection algorithms:
3.1 Clonal selection algorithm
Clonal selection and expansion is the most accepted theory used to explain how the immune system copes with the antigens. In brief, the Clonal selection theory states that when antigens invade an organism, a subset of the immune cells capable of recognizing these antigens proliferate and differentiate into active or memory cells. The fittest clones are those, which produce antibodies that bind to antigen best (with highest affinity). The main steps of Clonal selection algorithm can be summarized as follows [14].
Algorithm 1: Clonal selection Step 1: For each antibody element
Step 2: Determine its affinity with the antigen presented
* Email address: [email protected] 1
3.2 Negative selection algorithm
Negative selection algorithm is one of the important techniques in this paradigm that is widely applied to solve two-class (self and non-self) classification problems. Many advances to Negative Selection Algorithms (NSA) occurred over the last decade. This algorithm uses only one class (self) for training resulting in the production of detectors for the complement class (non
anomaly detection problems in which only one class is available for train
traffic and its detection problem [20]. The main steps of Negative selection algorithm can be summarized as follows [19]:
Algorithm 2: Negative Selection
input : Sseen = set of seen known self elements output : D = set of generated detectors
begin repeat
Randomly generate potential detectors and place them in a set P
Determine the affinity of each member of P with each member of the self set Sseen
If at least one element in S recognizes a detector in P according to a recognition threshold, Then
the detector is rejected, otherwise it is added to the set of available detectors D until Stopping criteria has been met
end
4. THE PROPOSED EMAIL S
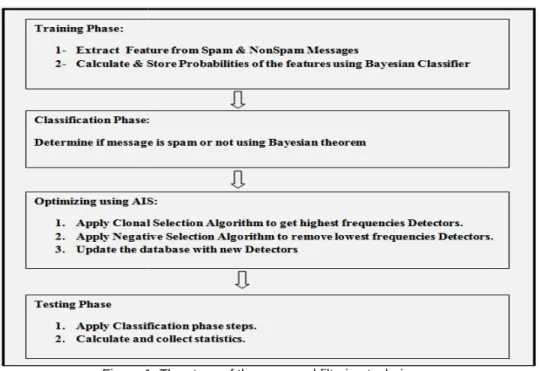
The proposed Filtering technique consists of four phases: Training phase, Classification phase, Optimization phase and Testing phase. In the Training phase, we use 2500 spam messages and 2500 non spam messages to train the system. In the Classification pha
and Negative selection algorithms to classify the email messages. In the Optimization phase, we try to improve the performance of the system via combine the three considered algorithms. In the Testing phase, we randomly choose dataset consists of 10000 messages from the TREC 2007.
Figure 1: The steps of the proposed filtering technique
1
, [email protected] 2, [email protected] 3, [email protected] Negative selection algorithm is one of the important techniques in this paradigm that is widely applied to
self) classification problems. Many advances to Negative Selection the last decade. This algorithm uses only one class (self) for training resulting in the production of detectors for the complement class (non-self). This paradigm is very useful for anomaly detection problems in which only one class is available for training, such as intrusive network . The main steps of Negative selection algorithm can be summarized as Algorithm 2: Negative Selection
: Sseen = set of seen known self elements : D = set of generated detectors
Randomly generate potential detectors and place them in a set P
Determine the affinity of each member of P with each member of the self set Sseen
If at least one element in S recognizes a detector in P according to a recognition threshold, otherwise it is added to the set of available detectors D
until Stopping criteria has been met
THE PROPOSED EMAIL SPAM FILTERING TECHNIQUE
The proposed Filtering technique consists of four phases: Training phase, Classification phase, Optimization phase and Testing phase. In the Training phase, we use 2500 spam messages and 2500 non spam messages to train the system. In the Classification phase, we use the Naive Bayes
and Negative selection algorithms to classify the email messages. In the Optimization phase, we try to improve the performance of the system via combine the three considered algorithms. In the Testing phase,
randomly choose dataset consists of 10000 messages from the TREC 2007.
Figure 1: The steps of the proposed filtering technique
[email protected] Negative selection algorithm is one of the important techniques in this paradigm that is widely applied to
self) classification problems. Many advances to Negative Selection the last decade. This algorithm uses only one class (self) for training self). This paradigm is very useful for ing, such as intrusive network . The main steps of Negative selection algorithm can be summarized as
If at least one element in S recognizes a detector in P according to a recognition threshold,
The proposed Filtering technique consists of four phases: Training phase, Classification phase, Optimization phase and Testing phase. In the Training phase, we use 2500 spam messages and 2500
non-Naive Bayes, Clonal selection and Negative selection algorithms to classify the email messages. In the Optimization phase, we try to improve the performance of the system via combine the three considered algorithms. In the Testing phase,
* Email address: [email protected] 1
4.1 Training phase
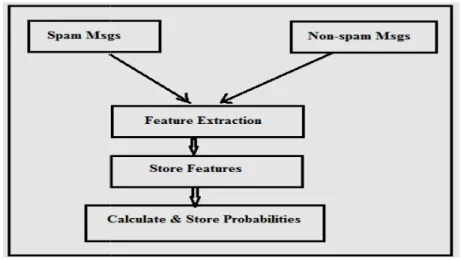
The proposed filtering technique classifies an email message into one of two categories: spam or non spam. A supervised learning approach (
of what spam and ham messages look like. Figure 2 describes the steps of the raining phase.
4.1.1 Features Extraction
An email message contains two parts: a header and a body. The header consists of fields usually including at least the following:
– From: This field indicates the sender’s email address. – To: This field indicates the receiver’s email address.
– Date: This field indicates the date and time of when the message was sent. – Subject: This field indicates a brief summary of the message’s content.
– Received: This field indicates the route the message took to go from the sender to the receiver. – Message-ID: This field indicates the ID of the message.
Every email message has a unique ID at a given domain name: id@senders
other hand, the body of an email message contains the actual content of the message. The header and the body of an email message are separated by an empty line. To extract the features (words) from an incoming email message, the following steps will be done:
Step1: Parse an email message and extract the header and the body parts.
Step 2: Remove the header fields described above from the messages since these fields appear in every email
message.
Step 3: Extract features from the header by tokenizing the header using the following delimiter:
+=-() ‘”*?:;<>
Step 4: Extract features from the body by tokenizing the body using the following delimiter:
\n\f\r\t\ ./&%# {}[]! +=-() ‘”*?:;<>
Step 5: Ignore features of size strictly less than 3 and digits. 4.1.2 Store Features
To store the extracted features yield from Each record stores the following information:
– Feature.
– Number of feature’s occurrences in spam messages (initialized to 0). – Number of feature’s occurrences in ham messages (initialized to 0). – Feature’s probability (initialized to 0).
Every time a feature is extracted, the email message is checked if it is spam or ham. If it is spam then the number of spam occurrences is incremented by one. Otherwise, the number of ham occurrences is incremented by one.
1
, [email protected] 2, [email protected] 3, [email protected] The proposed filtering technique classifies an email message into one of two categories: spam or non
supervised learning approach (Naive Bayes classifier) is used to enable the filter to build a history of what spam and ham messages look like. Figure 2 describes the steps of the raining phase.
Figure 2: The Steps of Training Phase
An email message contains two parts: a header and a body. The header consists of fields usually From: This field indicates the sender’s email address.
To: This field indicates the receiver’s email address.
Date: This field indicates the date and time of when the message was sent. Subject: This field indicates a brief summary of the message’s content.
Received: This field indicates the route the message took to go from the sender to the receiver. ID: This field indicates the ID of the message.
Every email message has a unique ID at a given domain name: id@senders-domain
other hand, the body of an email message contains the actual content of the message. The header and the an email message are separated by an empty line. To extract the features (words) from an incoming email message, the following steps will be done:
Parse an email message and extract the header and the body parts.
Remove the header fields described above from the messages since these fields appear in every email Extract features from the header by tokenizing the header using the following delimiter:
ct features from the body by tokenizing the body using the following delimiter: Ignore features of size strictly less than 3 and digits.
To store the extracted features yield from previous step, a SQL Server 2008 database table is used. Each record stores the following information:
Number of feature’s occurrences in spam messages (initialized to 0). Number of feature’s occurrences in ham messages (initialized to 0). Feature’s probability (initialized to 0).
Every time a feature is extracted, the email message is checked if it is spam or ham. If it is spam then the number of spam occurrences is incremented by one. Otherwise, the number of ham occurrences is
[email protected] The proposed filtering technique classifies an email message into one of two categories: spam or
non-classifier) is used to enable the filter to build a history of what spam and ham messages look like. Figure 2 describes the steps of the raining phase.
An email message contains two parts: a header and a body. The header consists of fields usually
Received: This field indicates the route the message took to go from the sender to the receiver.
domain-name. On the other hand, the body of an email message contains the actual content of the message. The header and the an email message are separated by an empty line. To extract the features (words) from an
Remove the header fields described above from the messages since these fields appear in every email Extract features from the header by tokenizing the header using the following delimiter: \n\f\r\t\ /&%# {}[]!
previous step, a SQL Server 2008 database table is used.
Every time a feature is extracted, the email message is checked if it is spam or ham. If it is spam then the number of spam occurrences is incremented by one. Otherwise, the number of ham occurrences is
* Email address: [email protected] 1 4.1.3 Compute and Store Probabilities
After extracting all the features and filling the database table with such features, we start enumerating through the elements of the table to compute the probability for each feature. To compute the probability (Pf) for a feature, the following formula is
Where s is the number of occurrences of feature f in spam messages, ts is the total number of spam messages in the training set, n is the number of occurrences of feature f in ham messages, tn is the total number of ham messages in the training set, and k is a number that can be tuned to reduce false positives by giving a higher weight to number of occurrences of ham features.
4.2 Classification phase
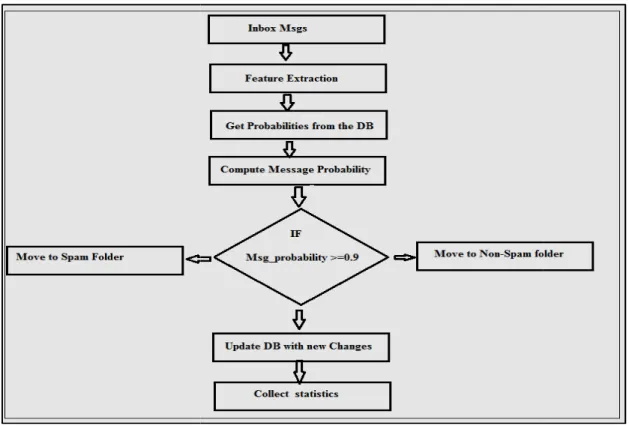
After the training step, the filtering system becomes capable of making
seen in the training set. Every time an email message is presented to the filter the following steps are done: Step 1: Parse the email message and extract both the header and the body parts.
Step 2: Extract features from the header and body using the feature extraction step described above.
Step 3: For each extracted feature retrieve the corresponding probability from the database DB. If the extracted
feature does not exist in DB, then assign it a probability of 0.5. Compute features according to the formula:
If = |0.5 − Pf |
Step 4: Extract the most interesting features from the list of features. Step 5: Calculate the total message probability (P) by c
features using Bayes theorem based on Graham’s assumptions
P =
(
The closer the P is to 0, the more likely the message is non
the message is spam. In our implementation the used threshold to determine whether a given email message is spam is 0.9, that is, if P >= 0.9 then t
classified as non-spam. Figure 3 summarizes the classification phase steps.
1
, [email protected] 2, [email protected] 3, [email protected] 4.1.3 Compute and Store Probabilities
After extracting all the features and filling the database table with such features, we start enumerating through the elements of the table to compute the probability for each feature. To compute the probability (Pf) for a feature, the following formula is used:
Pf = ) *) ) *) + ,- (4)
Where s is the number of occurrences of feature f in spam messages, ts is the total number of spam messages in the training set, n is the number of occurrences of feature f in ham messages, tn is the total messages in the training set, and k is a number that can be tuned to reduce false positives by giving a higher weight to number of occurrences of ham features.
After the training step, the filtering system becomes capable of making decisions based on what it has seen in the training set. Every time an email message is presented to the filter the following steps are done:
Parse the email message and extract both the header and the body parts.
header and body using the feature extraction step described above.
For each extracted feature retrieve the corresponding probability from the database DB. If the extracted feature does not exist in DB, then assign it a probability of 0.5. Compute the interestingness of the extracted
|
Extract the most interesting features from the list of features.
Calculate the total message probability (P) by combining the probabilities of the most interesting features using Bayes theorem based on Graham’s assumptions [21].
(./(.0(.1…(
.-(./(.0(.1...(.-+23(./3(.043(.1...3(.- 5
The closer the P is to 0, the more likely the message is non-spam and the closer P is to 1, the more likely the message is spam. In our implementation the used threshold to determine whether a given email message is spam is 0.9, that is, if P >= 0.9 then the email message is classified as spam otherwise it
spam. Figure 3 summarizes the classification phase steps.
Figure 3: The Steps of Classification Phase
[email protected] After extracting all the features and filling the database table with such features, we start enumerating through the elements of the table to compute the probability for each feature. To compute the probability
Where s is the number of occurrences of feature f in spam messages, ts is the total number of spam messages in the training set, n is the number of occurrences of feature f in ham messages, tn is the total messages in the training set, and k is a number that can be tuned to reduce false positives
decisions based on what it has seen in the training set. Every time an email message is presented to the filter the following steps are done:
header and body using the feature extraction step described above.
For each extracted feature retrieve the corresponding probability from the database DB. If the extracted the interestingness of the extracted
ombining the probabilities of the most interesting
spam and the closer P is to 1, the more likely the message is spam. In our implementation the used threshold to determine whether a given email he email message is classified as spam otherwise it
* Email address: [email protected] 1 , [email protected] 2, [email protected] 3, [email protected]
4.3 Optimizing phase using AIS
An immune system’s main goal is to distinguish between self and potentially dangerous non-self elements. In a spam immune system, we want to distinguish legitimate messages (as self) from spam message (as nonself) like biological immune system. The central part of the AIS engine is its Detectors, which are regular expressions made by combining information from training process. These regular expressions match patterns in the entire message. Each Detector acts as an antibody and consists of three associated weights (initialized to zero) detailing what has been matched by that particular detector [22]:
– Spam Frequency: the cumulative weighted number of spams matched – Ham Frequency: the cumulative weighted number of messages matched
– Affinity: is a measure that represents the strength of matching between antibody and message
The AIS engine applies on detectors (antibodies) dataset in two phases. Firstly, it determines the affinity ratio for all detectors with messages; secondly it rejects all detectors with low affinity value, so a clone of detectors with highest affinity is selected. The following algorithm illustrates the steps of the AIS engine:
Algorithm 4: AIS Engine
D input: set of detectors in the database
D' output: set of detectors have a highest affinity capable of classifying message. begin
Load a set of detectors D from database For all detectors in D do
Calculate the affinity for each message according to Naive Bayesmethod. end
For all detectors in D do
Reject the detector with low affinity. end
Select a clone of all detectors that have a highest affinity End
* Email address: [email protected] 1
Figure 4 illustrates the steps that implements in our system:
4.4 Testing phase
To make the testing of the proposed filtering technique easier, a built
can been seen in Figure 5, the filter takes as input a directory specified by the user that contains all email messages (spam and non-spam). When
directory and a non-spam directory. If the
it from the input directory to the spam directory. Similarly, if the spam then the filter copies it from the input directory to the non
Every message in the dataset has a letter in its file name: s if the email message is When the filter completes the classification process, it traverses the spam and non count:
True Positives (TP): The number of spam emails classified as spam. True Negatives (TN): The number of ham emails classified a
False Positives (FP): The number of ham falsely classified as spam. 1
, [email protected] 2, [email protected] 3, [email protected] Figure 4 illustrates the steps that implements in our system:
Figure 4: The Steps of AIS
To make the testing of the proposed filtering technique easier, a built-in testing functionality is included. As filter takes as input a directory specified by the user that contains all email spam). When the filter starts the classification, two directories are created: a spam spam directory. If the filter classifies a given email message as spam then the filter copies it from the input directory to the spam directory. Similarly, if the filter classifies a given email message as non
filter copies it from the input directory to the non-spam directory.
Figure 5: The Steps of Testing Phase
Every message in the dataset has a letter in its file name: s if the email message is spam and n otherwise. filter completes the classification process, it traverses the spam and non
True Positives (TP): The number of spam emails classified as spam. True Negatives (TN): The number of ham emails classified as ham. False Positives (FP): The number of ham falsely classified as spam.
[email protected] in testing functionality is included. As filter takes as input a directory specified by the user that contains all email filter starts the classification, two directories are created: a spam filter classifies a given email message as spam then the filter copies fies a given email message as
non-spam and n otherwise. filter completes the classification process, it traverses the spam and non-spam directories to
* Email address: [email protected] 1 , [email protected] 2, [email protected] 3, [email protected] False Negatives (FN): The number of spam falsely classified as ham.
After calculating the values of TP, TN, FP, and FN the Overall accuracy (OA) of the filter can be calculated as [24]:
Overall Accuracy (OA): (TP + TN) / (TP + FP + FN +TN). (6)
5. EXPERIMENTAL RESULTS
To train and test the proposed spam filter the TREC 2007 Spam Track Public Corpora which contains a large number of email messages is used [23].This corpus contains 75,419 email messages; 25,220 are spam messages and 50,199 are spam messages. The problem with the TREC corpus is that the non-spam and non-spam messages are not separated into two different directories. Both types of messages are placed in the same directory. The only way to know if a message is spam or non-spam is by looking at an index file which has the message number and its type. In our implementation we used C# code to separate the spam and non-spam messages into two directories.
5.1 Evaluation Strategy and Experimental Results
To determine the relative performance of the proposed filtering technique, it was necessary to test it against another continuous learning algorithm. The well-known Naive Bayes classifier was chosen as a suitable comparison algorithm. Our main goal is to analyze the detection capability of both the proposed filtering technique and Naive Bayes classifier on actual email messages. We randomly choose dataset consists of 10000 messages from the TREC 2007. This data set consists of 5000 spam and 5000 non spam messages 50 % of them appears in the training set and the other 50 % does not appear before. We apply 9 Test cases for each technique. Each test case consists of 1000 message selected randomly from the Testing dataset. Our threshold is 0.9.
We employed the measures that are widely used in spam classification. The common evaluation measures include true positive, true negative, false positive, false negative, Detection rate, False positive rate and overall accuracy. Their corresponding definitions are as follows [24] :
Detection Rate (DR): TP / (TP + FN). (7) False positive Rate (FPR): FP/ (TN + FP). (8) Overall Accuracy (OA): (TP+TN)/ (TP+FP+FN+TN). (6)
5.1.1 Experiment 1: Testing using Bayesian Spam Filtering Technique
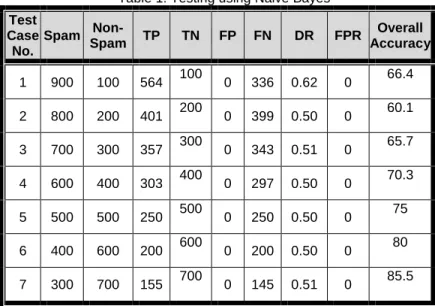
In this section we apply the Naive Bayes Method using dataset selected randomly from testing data set. We have 9 test cases every case have 1000 messages selected randomly from testing data set. At every test case we change the ratio between No. of spam messages and No. of non spam messages
Table 1: Testing using Naive Bayes
Test Case No. Spam Non-Spam TP TN FP FN DR FPR Overall Accuracy 1 900 100 564 100 0 336 0.62 0 66.4 2 800 200 401 200 0 399 0.50 0 60.1 3 700 300 357 300 0 343 0.51 0 65.7 4 600 400 303 400 0 297 0.50 0 70.3 5 500 500 250 500 0 250 0.50 0 75 6 400 600 200 600 0 200 0.50 0 80 7 300 700 155 700 0 145 0.51 0 85.5
* Email address: [email protected] 1 , [email protected] 2, [email protected] 3, [email protected]
8 200 800 100 800 0 100 0.5 0 90
9 100 900 50 900 0 50 0.5 0 95
Average of the measures 51.5% 0% 76.44%
As observed in Table (1) when we increase No. of non spam messages the Accuracy of the filter increase. Also we can observe that the false positive rate of our proposed system equal 0 this means that there is no Non Spam messages marked by mistake as Spam. This indicates higher better spam detection.
Based on Table (1) we can say that (on average) the detection rate, false positive rate, and overall accuracy are
51.5 %, 0%, 76.44%%.
5.1.2 Experiment 2: Testing using AIS (Clonal Selection Algorithm)
In this section we apply the Clonal selection algorithm using two different dataset. The first one is the same dataset that we used in the Naive Bayes technique. The second one is different dataset selected randomly from the testing dataset.
At first Table (2) we apply the Clonal selection algorithm on the same database resulted from the Training phase using the same dataset that used before in the Naive Bayes technique. Then Table (3) we apply the Clonal selection algorithm on and the database resulted from applying the Naive Bayes technique using the second dataset that selected randomly from the testing dataset.
* Email address: [email protected] 1 , [email protected] 2, [email protected] 3, [email protected]
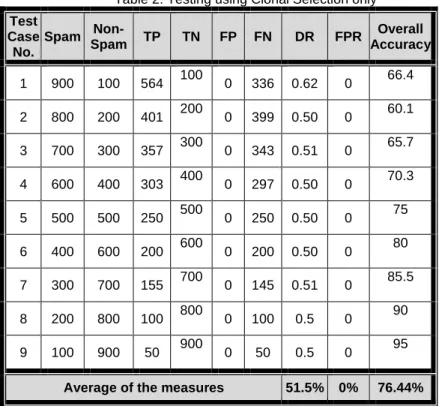
Table 2: Testing using Clonal Selection only
Test Case No. Spam Non-Spam TP TN FP FN DR FPR Overall Accuracy 1 900 100 564 100 0 336 0.62 0 66.4 2 800 200 401 200 0 399 0.50 0 60.1 3 700 300 357 300 0 343 0.51 0 65.7 4 600 400 303 400 0 297 0.50 0 70.3 5 500 500 250 500 0 250 0.50 0 75 6 400 600 200 600 0 200 0.50 0 80 7 300 700 155 700 0 145 0.51 0 85.5 8 200 800 100 800 0 100 0.5 0 90 9 100 900 50 900 0 50 0.5 0 95
Average of the measures 51.5% 0% 76.44%
Table 3: Testing using Clonal Selection with Naive Bayes technique
Test Cases No. Spam Non-Spam TP TN FP FN DR FPR Overall Accuracy 1 900 100 739 100 0 161 0.82 0 83.9 2 800 200 740 200 0 60 0.92 0 94 3 700 300 660 300 0 40 0.94 0 96 4 600 400 564 400 0 36 0.94 0 96.4 5 500 500 500 500 0 0 1 0 100 6 400 600 388 600 0 12 0.97 0 98.8 7 300 700 297 700 0 3 0.99 0 99.7 8 200 800 80 800 0 20 0.8 0 97.77 9 100 900 88 900 0 12 0.88 0 98.8
Average of the measures 91.87% 0 96.15%
As can be seen in Table (2) we have 9 test cases every case have 1000 messages this is the same test cases we use it in the Naive Bayes technique. As observed the result is the same as when we use the Naive Bayes technique.
* Email address: [email protected] 1 , [email protected] 2, [email protected] 3, [email protected] When we apply the Clonal selection algorithm after applying the Naive Bayes technique but with different dataset we obtain the results in table (3) .It shows an improvement in all the measures than using Naive Bayes technique alone.
Based on Table (3) we can say that (on average) the detection rate, false positive rate, and overall accuracy are 91.87 %, 0%, 96.15%.
5.1.3 Experiment 3: Testing using AIS (Negative Selection Algorithm)
In this section we apply the Negative selection algorithm using two different dataset. The first one is the same dataset that we used in the Naive Bayes technique. The second one is different dataset selected randomly from the testing dataset.
At first (Table 4) we apply the Negative selection algorithm on the same database resulted from the Training phase using the same dataset that used before in the Naive Bayes technique Then (Table 5) we apply the Negative selection algorithm on and the database resulted from applying the Naive Bayes technique using the second dataset that selected randomly from the testing dataset.
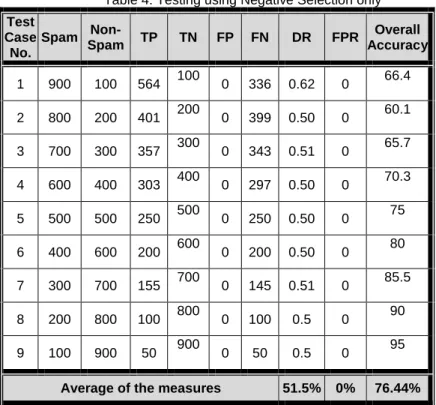
Table 4: Testing using Negative Selection only
Test Case No. Spam Non-Spam TP TN FP FN DR FPR Overall Accuracy 1 900 100 564 100 0 336 0.62 0 66.4 2 800 200 401 200 0 399 0.50 0 60.1 3 700 300 357 300 0 343 0.51 0 65.7 4 600 400 303 400 0 297 0.50 0 70.3 5 500 500 250 500 0 250 0.50 0 75 6 400 600 200 600 0 200 0.50 0 80 7 300 700 155 700 0 145 0.51 0 85.5 8 200 800 100 800 0 100 0.5 0 90 9 100 900 50 900 0 50 0.5 0 95
Average of the measures 51.5% 0% 76.44%
Table 5: Testing using Negative Selection with Naive Bayes
Test Case No. Spam Non-Spam TP TN FP FN DR FPR Overall Accuracy 1 900 100 741 100 0 159 0.82 0 84.1 2 800 200 740 200 0 60 0.92 0 94 3 700 300 660 300 0 40 0.94 0 96 4 600 400 564 400 0 36 0.94 0 96.4 5 500 500 500 500 0 0 1 0 100 6 400 600 388 600 0 12 0.97 0 98.8
* Email address: [email protected] 1 , [email protected] 2, [email protected] 3, [email protected]
7 300 700 297 700 0 3 0.99 0 99.7
8 200 800 80 800 0 20 0.80 0 97.77
9 100 900 88 900 0 12 0.88 0 98.8
Average of the measures 91.90% 0% 96.17 %
As can be seen in Table (4) we have 9 test cases every case have 1000 messages this is the same test cases we use it in the Naive Bayes technique and Clonal. As observed the result is the same as when we use the Naive Bayes technique.
When we apply the Negative selection algorithm after applying the Naive Bayes technique but with different dataset we obtain the results in table (5). It shows an improvement in all the measures than using Naive Bayes technique alone and with Clonal.
Based on Table (5) we can say that (on average) the detection rate, false positive rate, and overall accuracy are 91.9 %, 0%, 96.17%.
5.1.4 Experiment 4: Testing using AIS (Negative Selection &Clonal Algorithm) with Naive Bayes
technique
In this section we apply the Negative selection algorithm using different dataset than we used before in the previous experiments. This dataset selected randomly from the testing dataset.
We apply the Negative selection algorithm on the database resulted from applying the Clonal Selection Algorithm before but with different dataset selected randomly from the testing dataset. Table (6) illustrates the improvements that occurred by applying this proposed technique.
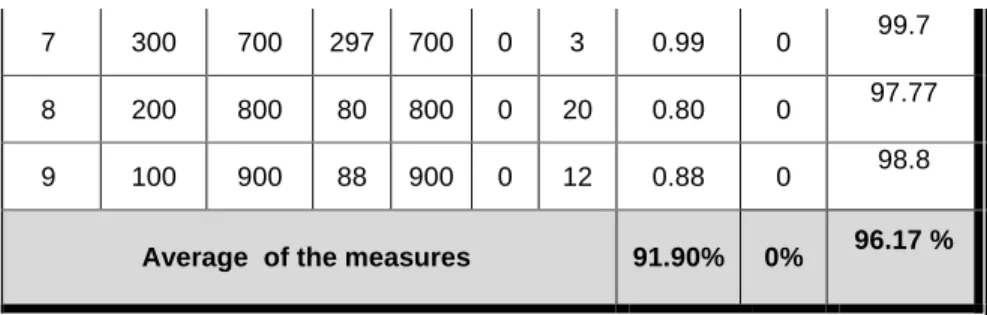
Table 6: Testing using Negative Selection & Clonal Selection & Naive Bayes Test Cases No. Spam Non-Spa m TP TN FP FN DR FPR Overall Accuracy 1 900 100 859 100 0 41 0.95 0 95.90 2 800 200 800 200 0 0 1 0 100.00 3 700 300 692 300 0 8 0.98 0 99.20 4 600 400 565 400 0 35 0.94 0 96.50 5 500 500 496 500 0 4 0.99 0 99.60 6 400 600 384 600 0 16 0.96 0 98.40 7 300 700 299 700 0 1 0.99 0 99.90 8 200 800 199 800 0 1 0.99 0 99.90 9 100 900 100 900 0 0 1 0 100.00
Average of the measures 98.09% 0% 98.82%
When we apply the Negative selection algorithm after applying the Clonal selection algorithm It shows an improvement in all the measures than using Naive Bayes technique alone and with Clonal and with negative.
Based on Table (6) we can say that (on average) the detection rate, false positive rate, and overall accuracy 98.09 %, 0%, 98.82%.
* Email address: [email protected] 1 , [email protected] 2, [email protected] 3, [email protected] 5.1.5 Some Statistics of the Proposed System
In this section we illustrate some evaluations about our proposed system. Table (7) gives a summary for the Overall Accuracy of the different techniques for each dataset. Table (8) gives a summary for the CPU Time taken by applying the different techniques for each dataset. Table (9) gives a summery for all detection rates for each test case tested by different techniques. Table (10) and Table (11) evaluates the different techniques with dataset consists of All messages spam and all messages non spam.
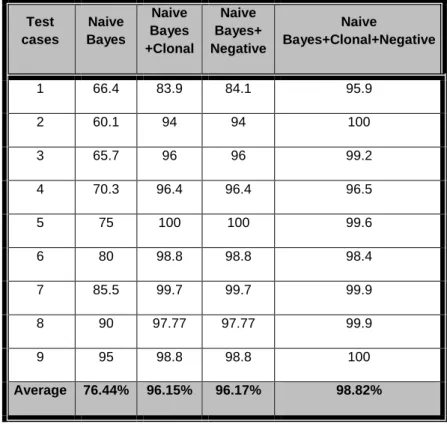
Table 7: Summery of Overall Accuracy for each technique
Test cases Naive Bayes Naive Bayes +Clonal Naive Bayes+ Negative Naive Bayes+Clonal+Negative 1 66.4 83.9 84.1 95.9 2 60.1 94 94 100 3 65.7 96 96 99.2 4 70.3 96.4 96.4 96.5 5 75 100 100 99.6 6 80 98.8 98.8 98.4 7 85.5 99.7 99.7 99.9 8 90 97.77 97.77 99.9 9 95 98.8 98.8 100 Average 76.44% 96.15% 96.17% 98.82%
Based on Table (7) we can say that (on average) the overall accuracy for Bayesian, Clonal+Naive Bayes, Negative+Naive Bayes, Naive Bayes+Clonal+Negative are 76.44 %, 96.15%, 96.17%, 98.82%. This means that the performance of the proposed technique is better than Naive Bayes technique.
Table8: A summary for the Time taken by applying the different techniques
Test cases Naive
Bayes NaiveBayes+ Clonal NaiveBayes+ Negative Naive Bayes+Clonal+Negative 1 2:00 3:26 5:15 4:45 2 2:35 6:53 6:04 9:15 3 3:21 6:23 6:58 8:19 4 3:54 7:03 7:15 9:02 5 3:45 6:13 8:13 8:00 6 5:20 10:02 11:14 12:34 7 7:13 9:56 11:47 12:22 8 5:36 8:28 8:37 10:14 9 5:57 9:10 11:01 11:10 Average(minute) 4:24m 7:30 m 8:29 m 9:31 m
* Email address: [email protected] 1 , [email protected] 2, [email protected] 3, [email protected] Based on Table (8) we can say that (on average) the time taken by applying Naive Bayes, Clonal+Naive Bayes, Negative+Naive Bayes, Naive Bayes+Clonal+Negative are 4:24, 7:30, 8:29, 9:31.
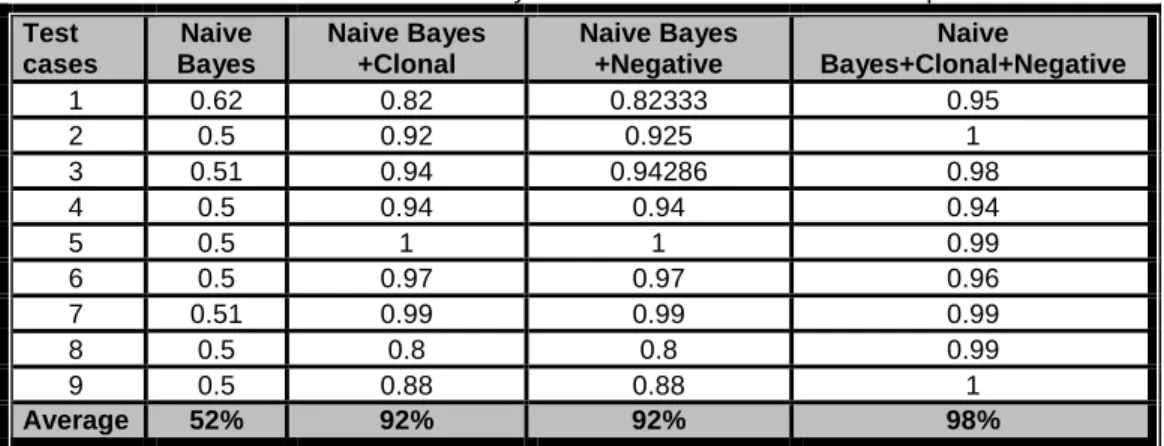
Table 9: Summery of Detection rate for each technique
Test cases Naive Bayes Naive Bayes +Clonal Naive Bayes +Negative Naive Bayes+Clonal+Negative 1 0.62 0.82 0.82333 0.95 2 0.5 0.92 0.925 1 3 0.51 0.94 0.94286 0.98 4 0.5 0.94 0.94 0.94 5 0.5 1 1 0.99 6 0.5 0.97 0.97 0.96 7 0.51 0.99 0.99 0.99 8 0.5 0.8 0.8 0.99 9 0.5 0.88 0.88 1 Average 52% 92% 92% 98%
Based on Table (9) we can say that (on average) the detection rate resulted by applying Naive Bayes, Clonal+Naive Bayes, Negative+Naive Bayes, Naive Bayes+Clonal+Negative 52%, 92%, 92%, 98%. This means that the performance of the proposed technique is better than Naive Naive Bayes technique.
Table10: Measures of performance using different techniques with dataset NonSpam.
Techniques Spam
Non-Spam TP TN FP FN DR FPR Overall Accuracy Naive Bayes 0 1000 0 1000 0 0 1 0 100 Naive Bayes+Clonal 0 1000 0 1000 0 0 1 0 100 Naive Bayes+Negative 0 1000 0 1000 0 0 1 0 100 Naive Bayes+Clonal+Negative 0 1000 0 1000 0 0 1 0 100
Table11: Measures of performance using different techniques with dataset Spam.
Techniques Spam
Non-Spam TP TN FP FN DR FPR Overall Accuracy Naive Bayes 1000 0 812 0 0 188 0.812 0 81.2 Naive Bayes+Clonal 1000 0 929 0 0 71 0.929 0 92.9 Naive Bayes+Negative 1000 0 929 0 0 71 0.929 0 92.9 Naive Bayes+Clonal+Negative 1000 0 971 0 0 29 0.971 0 97.1
As can be seen in Table (10) and Table (11) when we use a dataset contains Non-Spam Messages only we obtain overall accuracy of 100 % and false positive rate =0 % This means that our proposed system is accurate as the aim of any spam filtering technique is to decrease the number of false positives.
We can also observe that the Detection rate is increase when we use the AIS Clonal and Negative Selection algorithms with the Naive Bayes Classifier. This means that the performance of the proposed technique is better than using each technique alone.
* Email address: [email protected] 1 , [email protected] 2, [email protected] 3, [email protected]
6. CONCLUSION
An efficient email filtering approach which consists of three phases is presented. This new approach tries to increase the accuracy of a spam filtering via combine the well known Naive Bayes spam filter with the artificial immune system by using two of its algorithms the Clonal selection algorithm and the negative selection algorithm. Experimental results showed an improvement in the performance of the new spam filtering than using each technique alone as it always seek to get the highest and fastest detectors to reduce the false positive rate and get highest accuracy. The experimental results applied on 10,000 email messages shows a high efficiency with the less number of false positives (on average) 0%, High detection rate (on average) 98.09% and the overall accuracy (on average) 98.82%.
7. REFERENCES
[1] alt-n. Technologies and commtouch.(2012,Apr.) www.altn.com. Accessed Oct., 2013
[Available]. http://www.altn.com/Literature/SecurityThreatTrendReports/EmailThreatTrendReport-2012-Q1.pdf
[2] Rao J. M. , Reiley D. H., "The Economics of Spam," Journal of Economic Perspectives, vol. 26, no. 3, pp. 87–110, 2012.
[3] Chakraborty S. , Mondal B., "Spam Mail Filtering Technique using Different Decision Tree Classifiers through Data Mining Approach - A Comparative Performance Analysis," International Journal of Computer Applications, vol. 47, no. 16, pp. 26-31, Jun. 2012.
[4] DeBarr D., Wechsler H. , "Spam detection using Random Boost," Pattern Recognition Letters, vol. 33, no. 10, pp. 1237-1244, Jul. 2012.
[5] Zhang L., Zhu J. , Yao T., "An Evaluation of Statistical Spam Filtering Techniques," in ACM Transactions on Asian Language Information Processing, vol. 3, 2004, pp. 243-269.
[6] Sahami M., Dumais S., Heckerman D., Horvitz E., "A Bayesian approach to Filtering junk e-mail. In Learning for Text Categorization," in AAAI Technical Report WS-98-05, Madison, Wisconsin, 1998. Accessed Oct., 2013 [Available].ftp://ftp.research.microsoft.com/pub/ejh/junkfilter.pdf ,
[7] Drucker H., Wu D., Vapnik V., "Support vector machines for spam categorization," IEEE transactions on Neural Networks, vol. 10, no. 5, pp. 1048-1055, Sep. 1999.
[8] Androutsopoulos L., Koutsias J., Chandrinos K. V., Paliouras G., Spyropoulos C. D., "An evaluation of naïve Bayesian anti-spam filtering," in Proceedings of the Workshop on Machine Learning in the New
Information Age, 11th European Conference on Machine Learning, Barcelona, Spain, 2000a, 2000, pp. 9-17. Accessed Oct., 2013
[Available]. http://arxiv.org/pdf/cs/0006013v1.pdf ,
[9] Carreras X. , Ma'rquez L., "Boosting trees for anti-spam email Filtering," in Proceedings of RANLP-2001, 4th International Conference on Recent Advances in Natural Language Processing, 2001, pp. 58-64. Accessed Oct, 2013
[Available]. http://www.eecs.wsu.edu/~holder/courses/cse6363/spr04/present/Carreras01.pdf ,
[10] Zhang L. , Yao T., "Filtering junk mail with a maximum entropy model," in Proceeding of 20th International Conference on Computer Processing of Oriental Languages (ICCPOL03), 2003, pp. 446-453.
[11] Goodman J. J, Cormack G., Heckerman D., "Spam and the ongoing battle for the inbox," in Communication of the ACM, vol. 50, 2007, pp. 25-33.
[12] Dasgupta D., "An overview of artificial immune systems," Artificial Immune Systems and Their Applications,, pp. 3-19, 1998.
* Email address: [email protected] 1 , [email protected] 2, [email protected] 3, [email protected] [13] Timmis J., "Artificial immune systems: A novel data analysis technique inspired by the immune network theory," Ph.D Thesis, University of Wales, Aberystwyth., 2000.
[14]Timmis J., Castro L. N. D., Artificial Immune Systems: A New Computational Intelligence Approach. London, London .uk: Springer Veralg, 2002.
[15] Dasgupta D.,Yu S., Nino F., "Recent Advances in Artificial Immune Systems: Models and Applications," Applied Soft Computing Journal, vol. 11, no. 2, p. 1574–1587, Mar. 2011.
[16] Idris I., "Model and Algorithm in Artificial Immune System for Spam Detection," International Journal of Artificial Intelligence & Applications (IJAIA), vol. 3, no. 1, Jan. 2012.
[17] Somayaji A., Hofmeyr S., Forrest S., "Principles of a Computer Immune System," in New Security Paradigms Workshop, 1998, p. 75–82.
[18]Sarafijanovic S., L. Boudec, "Artificial Immune System For Collaborative Spam Filtering," in Proceedings of NICSO 2007, The Second Workshop on Nature Inspired Cooperative Strategies for Optimization, vol. 129, Acireale, Italy, 2007, pp. 39-51.
[19] Ji Z. , Dasgupta D., "Revisiting negative selection algorithms," Evolutionary Computation, vol. 15, no. 2, p. 223–251, 2007.
[20] Balachandran S., "Multi-Shaped Detector Generation Using Real Valued Representation for Anomaly Detection," Master Thesis, University of Memphis, December 2005.
[21] Graham P. (2003, Jan.) A plan for spam. Accessed Oct.,2012 [Available]. http://www.paulgraham.com/spam.html
[22]Oda T., White T., "Immunity from spam: An analysis of an artificial immune system for junk email detection," Lecture Notes in Computer Science , 3627, 2005.
[23]TREC 2007 Spam Track Public Corpora. Accessed Oct., 2013 [Available]. http://plg.uwaterloo.ca/~gvcormac/treccorpus07/
[24] Shih D. , Jhuan H., "A study of mobile SpaSMS filterig," in The XVIII ACME International Conference on pacific RIM management, Canada, July 24-July 26, 2008.