O R I G I N A L R E S E A R C H
Open Access
Fast image recognition of transmission
tower based on big data
Zhuangli Hu
1*, Tong He
1, Yihui Zeng
1, Xiangyuan Luo
1, Jiawen Wang
2, Sheng Huang
3, Jianming Liang
1,
Qinzhang Sun
1, Hengbin Xu
1and Bin Lin
1Abstract
Big data technology is more and more widely used in modern power systems. Efficient collection of big data such as equipment status, maintenance and grid operation in power systems, and data mining are the important research topics for big data application in smart grid. In this paper, the application of big data technology in fast image recognition of transmission towers which are obtained using fixed-wing unmanned aerial vehicle (UAV) by large range tilt photography are researched. A method that using fast region-based convolutional neural networks (Rcnn) convolutional architecture for fast feature embedding (Caffe) to get deep learning of the massive transmission tower image, extract the image characteristics of the tower, train the tower model, and quickly recognize transmission tower image to generate power lines is proposed. The case study shows that this method can be used in tree barrier modeling of transmission lines, which can replace artificial identification of transmission tower, to reduce the time required for tower identification and generating power line, and improve the efficiency of tree barrier modeling by around 14.2%.
Keywords:Big data, Deep learning, Image recognition, Transmission tower, Tree barrier modeling
1 Introduction
Big data technology has become a hot topic in recent years. It refers to the technical system or technology framework of extracting, discovering and analyzing data from large numbers of different types and sources, and extracting their value using economic methods [1–4]. The technology contained in big data is not only for collecting massive data but also for deep mining, processing and analyzing data, in order to achieve the maximum value of the data.
Modern power system is one of the important fields in the application of big data technology [5–10]. The ultim-ate goal of smart grid is to build a panoramic real-time system covering the whole production process of the power system, including power generation, transmission, transformation, distribution, consumption and dispatch-ing. Moreover, supporting the safe, self-healing, green, strong and reliable operation of smart grid requires real-time data acquisition, transmission and storage, and the rapid analysis for massive multi-source data [11,12].
Deep learning can accomplish artificial intelligence tasks that require highly abstract features, such as speech recognition, image recognition, and natural lan-guage understanding [13, 14]. The deep layers model is an artificial neural network containing multiple hidden layers, and the multilayer nonlinear structure that makes it has strong expressive power and modeling ability for complex tasks [15]. Training deep layers model is a long-term research problem. In recent years, hierarchical and layer after layer initialization methods have brought hope for training deep layers models, and have been ap-plied successfully in many application fields [16,17].
The main steps of deep learning include building the network architecture, identifying learning goals, and starting learning [18]. Deep learning for a neural network with many hidden layers is a continuous process. First, a standard parameter is defined, and then it is constantly corrected to get the weight between each node in the graph [19]. Machine deep learning can also be applied to image recognition by first making training sets using massive pictures, and then constantly training to get the weight of the neural network and finally form-ing the model. After the model is built, the machine can * Correspondence:[email protected]
1Foshan power supply bureau, Guangdong Power Grid Company, No. 1
South Road, Fenjiang, Foshan, China
Full list of author information is available at the end of the article
identify whether a picture has a target image when a new picture is entered into the machine.
Image recognition technology is widely used in power system. In the field of power distribution, image recogni-tion technology has been applied to identify poles and wires on the maps of distribution facilities [20, 21]. The safe and stable operation of substations plays a vital role in the stability of power grid, and image processing tech-nology is applied to automatic acquisition of power equipment and achieving real-time observation and analysis of substation equipment [22, 23]. In terms of power transmission, image recognition can be used to measure the icing thickness of transmission lines where the intuitive observation of ice coating on transmission lines can be realized by the image measuring method of ice thickness on remote online systems [24,25].
By the end of 2016, the length of transmission lines at 220 kV and above in China was about 642 thousand ki-lometers [26], and continued increasing rapidly. In 2017, the length of newly added transmission lines at 220 kV and above was 41,459 km in China [27]. Tree barrier modeling of transmission line is a cumbersome task as it has to recognize transmission towers to generate power lines to measure the distances between wires and trees. This paper proposed a method of fast image recognition of transmission towers based on big data, which can greatly improve the efficiency of large-scale tree barrier modeling.
The rest of the paper is organized as follows. Section2
proposes the use of fast region-based convolutional neural networks (Rcnn) convolutional architecture for fast feature embedding (Caffe) to get deep learning of the massive transmission tower images, extract the image characteristics of the tower, train the tower model, and quickly recognize transmission tower images. In Section 3, the process of tree barrier modeling is intro-duced and the method of fast image recognition of transmission towers is used to replace the traditional artificial identification to improve the efficiency of tree barrier modeling. Through field test case analysis, the feasibility of the proposed method and the efficiency im-provement of tree barrier modeling of transmission lines are verified in Section4. Finally, conclusion is drawn in Section6.
2 Method of image recognition of transmission tower
2.1 Training tools of image recognition
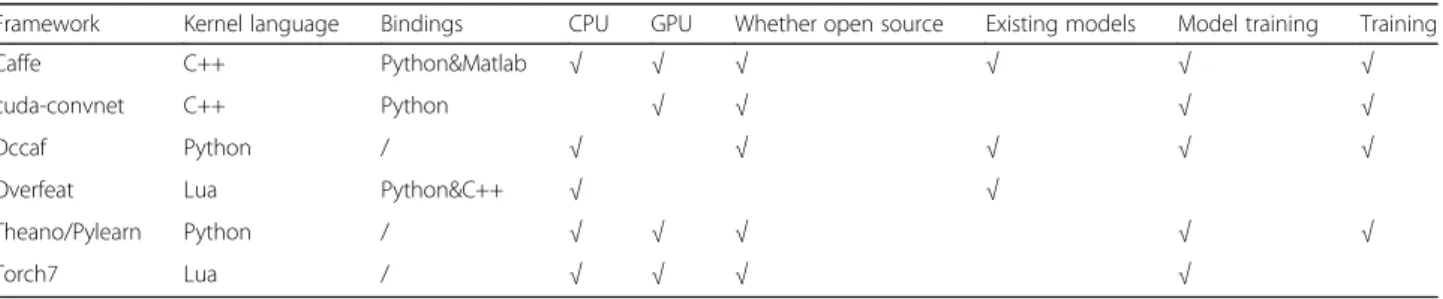
Caffe is a deep learning framework widely used in video and image processing. The deep learning of image rec-ognition can be achieved by applying Caffe in Windows environment. The comparison of the Caffe deep learning framework and other mainstream frameworks is shown in Table1.
As can be seen from Table 1, there are two main
differences between Caffe and other deep learning devel-opment tools.
(1) The code of Caffe is written by pure and efficient C ++ language, which has sophisticated modular coding, pure and independent network definition, and can be easily transplanted. Furthermore, Caffe has no hardware and platform limitations, and is suitable for commercial development and scientific research.
(2) Caffe offers a complete toolkit for training, testing, tuning and developing models. Through fine-tuning and trained models, the new applications can be developed quickly and efficiently.
CPU and GPU are the two operation modes of Caffe, thought faster computing speed can be achieved with GPU mode. More than 40 million images can be identi-fied by K40 or Titan GPU per day, which means that the speed of identification for a picture is only 2.5 ms, and more complex models can be processed quickly. Using fast Rcnn Caffe, the deep learning of numerous tower images of transmission line is trained, and the image fea-tures of the transmission tower is extracted. Finally, the model for transmission tower recognition is formed to realize fast image recognition of transmission tower by the machine.
2.2 Image recognition model
To model image recognition of transmission tower, the neuronal network architecture needs to be determined first. The computing process of a neuron in the neuronal network structure is shown as:
Table 1Deep learning framework comparison
Framework Kernel language Bindings CPU GPU Whether open source Existing models Model training Training
Caffe C++ Python&Matlab √ √ √ √ √ √
cuda-convnet C++ Python √ √ √ √
Dccaf Python / √ √ √ √ √
Overfeat Lua Python&C++ √ √
Theano/Pylearn Python / √ √ √ √ √
z ¼ n1w1þ…þnkwkþ…þnKwKþb ð1Þ
f zð Þ ¼a ð2Þ
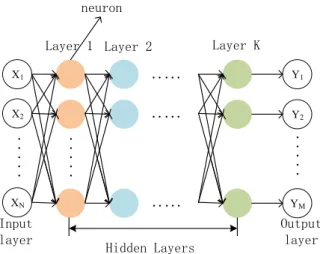
wheren1...nKare parameters, andw1...wKare the weights for each node in the numerous pictures of the transmis-sion towers, b is the deviation and f(z) is an incentive function. The computing result of a neuron in the neur-onal network is added to the deviation which is then assigned to an incentive function to form the calculation result of the neuron. Neurons are calculated once per layer, and Fig. 1 shows the results of the neurons after multi-level operation.
Multi-layer computing of neuron is convolution neural network and the dimension is multi-layer convolution. Compared with two-dimensional convolution, the num-ber of channel is increased and each channel is still
cal-culated according to two-dimensional convolution.
Multiple channels and multiple convolution kernels per-form two-dimensional convolution respectively to obtain multi-channel output, and the formula is expressed as:
Ymð Þ ¼l;k Xnð Þl;k ⋆Hnmð Þl;k
¼XN− 1
n¼0 XI−1
i¼0 XJ−1
j¼0
xnðlþi;kþjÞHnmð Þi;j
ð3Þ
It is assumed that the convolutional layer has M out-put channels and Ninput channels, as shown in Fig. 1, and MN convolution kernels are needed to achieve the conversion of the channel numbers. As seen in Fig. 1
and (3), Xn is the two-dimensional feature map of the nth(0≤n<N) input channel,Ym is the two-dimensional feature map of the mth(0≤m<M)output channel,Hnmis
the two-dimensional convolution kernel in the mth
column andnthrow. Assuming the convolution kernel is
I·J and the size of the transmission tower characteristic map of each output channel is L·K, the convolutional computation of the layer forward propagation for each sample is given as:
Calculations MACð Þ ¼IJLKNM ð4Þ
2.3 The training process of image recognition
As shown in Fig.2, the training algorithm of image rec-ognition of transmission towers consists two phases of the forward propagation phase and backward propaga-tion phase.
Step 1: stage of forward propagation
From the input unit to the first hidden layer H1 it is calculated as follows.
For each unitjin hidden layer H1,yj=f(zj),zj=∑iwijxi, where i traverses all input layer nodes and Zj is the weighted sum of all nodes in the previous layer. The nonlinear function f transforms Zj in the network to obtain the layer outputyj.
From H1 to H2 the calculations are as follows. For each unit k in hidden layer H2, yk=f(zk), zk =∑jwjkyj, wherejtraverses all nodes in hidden layer H1.
From H2 to the output layer, it is calculated as follows. For each unit l in the output layer, yl=f(zl), zl =∑kwklyk, where k traverses all nodes in hidden layer H2.
Step 2: stage of backward propagation
In the backward propagating process, each layer needs to calculate the error gradient of the output
Fig. 1Neuronal network architecture. It shows the result after multi-level operation of a neuronal network with hidden layers
Fig. 2Calculation process of forward propagation (left) and backward propagation (right). Forward propagetion calculates from the input unit to the output unit, backward propagation does the opposite and corrects the
node of this layer, that is, the weighted sum of all error gradients from the input nodes of the latter layer. Then, the error gradient is transmitted to the input nodes of this layer using chain rule, and the error gradient reaches the first layer through the backward propagation path layer by layer. All the weight layers are then updated together after the backward propagation. The error gradient of output units is derived from the loss function. Considering
the output layer unit l corresponding to the loss
function E, from the output unit to the second hid-den layer H2 it is calculated as follows.
For each unitkin hidden layer H2, the error gradient is ∂E
∂yk¼ P
l∂∂zEl ∂zl ∂yk¼
P
lwkl∂∂zEl , where l traverses all
output layer nodes.
Similarly, the error gradient of hidden layer H1 can be drawn as ∂E
∂yj¼ P
k∂∂zEk ∂zk ∂yj¼
P
k∂∂yEk ∂yk
∂zkwjk, where k tra-verses all nodes in hidden layer H2.
The error gradient of input layer is ∂E
∂xi¼ P
j∂∂yEj ∂yj ∂zj
∂zj ∂xi
¼Pj∂E
∂yj ∂yj
∂zjwij, where j traverses all nodes in hidden layer H1.
According to the equations, the backward propaga-tion can be applied repeatedly, and the gradients are obtained from the top level through all the modules to the input level. After all the intermediate gradients have been obtained, the gradient of the loss function relative to the internal weight of each module is calculated.
2.4 The training model and recognition accuracy of transmission tower with fast Rcnn
Intelligent image recognition of transmission tower from transmission line inspection photos needs train machine learning. After selecting transmission line inspection photos for making the data set and subsequent training of the data set, the model will be generated. Through de-tecting the generated model, changing the model and
iteration times and data ratio, and then conducting data training, the optimal model and data ratio are obtained after comparing the test results.
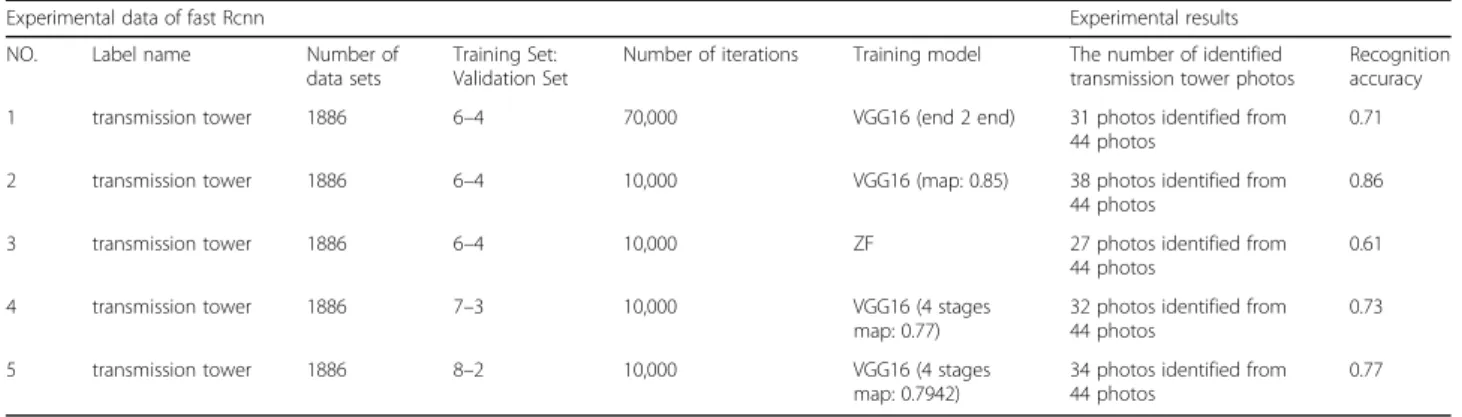
Making data sets needs a large number of transmission line inspection photos containing transmission towers. As can be seen from Table2, each data set has 1886 transmis-sion line inspection photos. Training machine to extract the feature values of the massive photos in the data sets, a model for identifying transmission tower is formed.
The experimental data of fast Rcnn and the experi-mental results are shown in Table 2. It can be seen that
Table 2The experimental data of fast Rcnn and experimental results
Experimental data of fast Rcnn Experimental results
NO. Label name Number of data sets
Training Set: Validation Set
Number of iterations Training model The number of identified transmission tower photos
Recognition accuracy
1 transmission tower 1886 6–4 70,000 VGG16 (end 2 end) 31 photos identified from 44 photos
0.71
2 transmission tower 1886 6–4 10,000 VGG16 (map: 0.85) 38 photos identified from 44 photos
0.86
3 transmission tower 1886 6–4 10,000 ZF 27 photos identified from 44 photos
0.61
4 transmission tower 1886 7–3 10,000 VGG16 (4 stages map: 0.77)
32 photos identified from 44 photos
0.73
5 transmission tower 1886 8–2 10,000 VGG16 (4 stages map: 0.7942)
34 photos identified from 44 photos
0.77
the model VGG16 with data ratio 6–4 is the best choice for training transmission tower recognition with fast Rcnn, and the recognition accuracy from transmission line inspection photos reaches 86%.
3 Large-scale tree barrier modeling of transmission line
3.1 Process of tree barrier modeling
For modeling tree barrier of power transmission lines, it needs take tilt photography photos of the transmission lines with fixed-wing UAV first, and then identifies the transmission towers from the photos and generates the power lines after obtaining the position of the towers. After generating power lines and point cloud classification, the distance between trees and wires is measured. The process of tree barrier modeling is shown in Fig.3.
3.2 Defect classification of tree barrier of high-voltage transmission lines
The horizontal and vertical distances between trees and high-voltage transmission lines affect the safe operation of the transmission lines, and different distances be-tween trees and different voltage levels of the transmis-sion lines lead to different levels of tree barrier defect. According to the grading principle and management and control requirements of tree barrier defect of Guang-dong Power Grid, the defect classification of tree barrier for different voltage levels of transmission lines is shown in Table3, wheredvis the vertical distance anddhis the horizontal distance.
3.3 Improving the efficiency of tree barrier modeling by image recognition of transmission tower based on big data
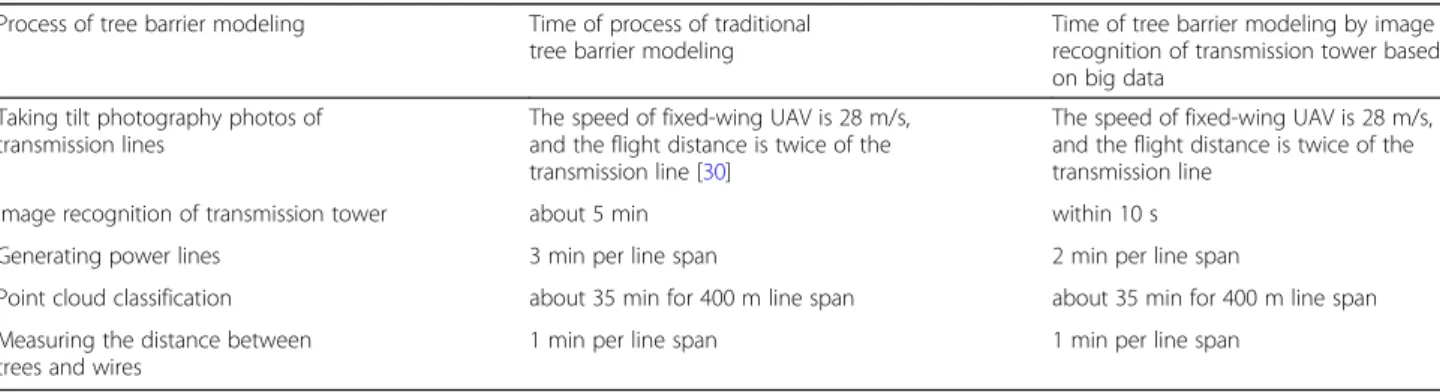
In 2017, the length of transmission lines at 220 kV and above in China was about 68.35 million kilometers, and the daily tree barrier modeling of transmission lines becomes a heavy workload. Image recognition of trans-mission tower is a key step in the process of tree barrier modeling, which takes significant time as shown in Table 4. The time of traditional tree barrier modeling is calculated as:
Tt ¼T1þT2þT3þT4þT5 ð5Þ
whereT1is the time of taking tilt photography photos of transmission lines,T2is the time of artificial identifica-tion of transmission tower,T3 is the time of generating power line, T4 is the time of point cloud classification
and T5 is the time of measuring the distance between
trees and wires.
Using the method of fast image recognition of trans-mission tower based on big data, the time of tree barrier modeling is calculated as:
Tb ¼T1þT2
0
þT3
0
þT4þT5 ð6Þ
where T’2 is the time of image recognition of
transmission tower and T’3 is the time of generating
power line by using the method proposed in this paper. In Table4, times of each step of traditional tree barrier modeling of Guangdong Power Grid including tilt photography are illustrated. According to Table 4, T1 andT4are calculated as:
Table 3Defect classification of tree barrier [29]
Voltage level Emergency defects Major defects General defects
vertical distance (m)
horizontal distance (m)
vertical distance (m)
horizontal distance (m)
vertical distance (m)
horizontal distance (m)
110 kV dv≤4 dh≤3.5 4 <dv≤7 3.5 <dh≤6.5 7 <dv≤13 6.5 <dh≤12.5
220 kV dv≤4.5 dh≤4 4.5 <dv≤7.5 4 <dh≤7 7.5 <dv≤13.5 7 <dh≤13
500 kV dv≤7 dh≤7 7 <dv≤10 7 <dh≤10 10 <dv≤16 10 <dh≤16
Table 4Time comparison of process of traditional tree barrier modeling and tree barrier modeling proposed in this paper
Process of tree barrier modeling Time of process of traditional tree barrier modeling
Time of tree barrier modeling by image recognition of transmission tower based on big data
Taking tilt photography photos of transmission lines
The speed of fixed-wing UAV is 28 m/s, and the flight distance is twice of the transmission line [30]
The speed of fixed-wing UAV is 28 m/s, and the flight distance is twice of the transmission line
Image recognition of transmission tower about 5 min within 10 s
Generating power lines 3 min per line span 2 min per line span
Point cloud classification about 35 min for 400 m line span about 35 min for 400 m line span
Measuring the distance between trees and wires
T1¼ Lls 2
ð Þ
2860 ð7Þ
T4¼ Lls 35
ð Þ
400 ð8Þ
where Lls is the line span. It can be seen that the artifi-cial identification of transmission tower takes more time, making up a larger proportion of the total time of trad-itional tree modeling. The method proposed in this paper can quickly recognize the transmission tower, so as to significantly reduce the times of image recognition of transmission tower and generating power lines, and improve the efficiency of tree barrier modeling. The
increase of efficiency of tree barrier modeling is calculated as:
η¼Tt−Tb
Tt ð
9Þ
4 Case study
In 2017, the flight mileage of fixed-wing UAV was over 200,000 km for tree barrier modeling with tilt photog-raphy in Guangdong Power Grid, and 80,000 km of ef-fective transmission line inspection was completed [28]. From these data, 20 transmission lines are selected ran-domly for case analysis.
4.1 Taking tilt photography photos of transmission lines
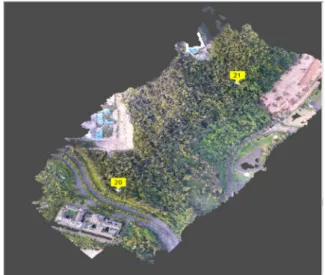
For tree barrier modeling, tilt photography photos of the transmission lines need to be taken using fixed-wing UAV to identify the transmission towers from the
Fig. 4A photograph with transmission towers. The yellow points represent transmission towers in this tilt photography photo of transmission line with fixed-wing UAV
Fig. 5A recognized transmission tower. The yellow point represents the transmission tower recognized by the proposed method
Fig. 6Adding control points and generating power lines. The purple quadrangles represent control points and the red line represents generated line
photos. Figure 4 is a photograph with transmission
towers and Fig. 5 shows a recognized transmission
tower. When selecting the tilt photography photos of transmission lines, the number of control points should be at least 5 in a transmission line with even distribution, and the corresponding two photos in two respective routes should be selected as far as possible.
4.2 Generating power lines after image recognition of transmission tower
As shown in Fig.6, after image recognition of the trans-mission towers, they are identified as the control points, and adding 5 control points evenly can generate the power lines. Using appropriate method of selected points for point cloud classification, the vegetation on the surface and houses of the visible points are classified as“ground”, and all these points are marked. The distances between trees and wires can then be measured, as shown in Fig.7.
4.3 Tree barrier modeling of transmission lines
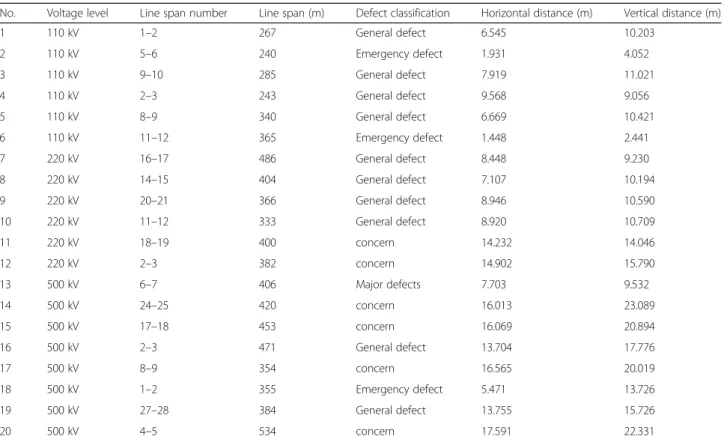
Twenty transmission lines are selected randomly for tree barrier modeling, which contain voltage levels of 110 kV, 220 kV and 500 kV. These twenty transmis-sion lines are generated according to the method pro-posed in this paper, and the distances between the trees and wires are measured. The measurement re-sults are shown in Table 5.
5 Results and discussions
After tree barrier modeling analysis of the 20 randomly selected transmission lines, it can be seen from Table5
that the numbers of emergency defects, major defects, general defects and concerns are 3, 1, 10 and 6, re-spectively, as further illustrated in Figs. 8 and 9. The concern cases refer to situations where the trees are
Table 5Results of tree barrier modeling
No. Voltage level Line span number Line span (m) Defect classification Horizontal distance (m) Vertical distance (m)
1 110 kV 1–2 267 General defect 6.545 10.203
2 110 kV 5–6 240 Emergency defect 1.931 4.052
3 110 kV 9–10 285 General defect 7.919 11.021
4 110 kV 2–3 243 General defect 9.568 9.056
5 110 kV 8–9 340 General defect 6.669 10.421
6 110 kV 11–12 365 Emergency defect 1.448 2.441
7 220 kV 16–17 486 General defect 8.448 9.230
8 220 kV 14–15 404 General defect 7.107 10.194
9 220 kV 20–21 366 General defect 8.946 10.590
10 220 kV 11–12 333 General defect 8.920 10.709
11 220 kV 18–19 400 concern 14.232 14.046
12 220 kV 2–3 382 concern 14.902 15.790
13 500 kV 6–7 406 Major defects 7.703 9.532
14 500 kV 24–25 420 concern 16.013 23.089
15 500 kV 17–18 453 concern 16.069 20.894
16 500 kV 2–3 471 General defect 13.704 17.776
17 500 kV 8–9 354 concern 16.565 20.019
18 500 kV 1–2 355 Emergency defect 5.471 13.726
19 500 kV 27–28 384 General defect 13.755 15.726
20 500 kV 4–5 534 concern 17.591 22.331
close to the transmission lines but not to reach the general defect level.
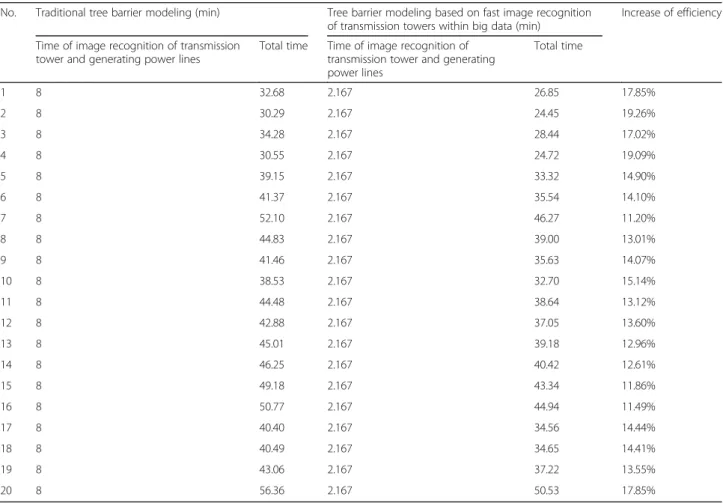
According to Table4, the times of traditional tree bar-rier modeling and tree barbar-rier modeling based on fast image recognition of the twenty transmission lines in the case study are calculated using (5) and (6) respect-ively, and the results are compared in Table6. According
to (9), the improved efficiency of tree barrier modeling can also be calculated.
It can be seen that the proposed fast image recognition based on big data can reduce the time of image recogni-tion of transmission tower and generating power lines, leading to significantly improved efficiency of tree barrier modeling. In the studied cases, the average improvement of efficiency of tree barrier modeling is around 14.2%.
6 Conclusions
Tree barrier modeling of transmission line is a demand-ing task, whereas identification of transmission tower is one of the necessary and time-consuming steps. In this paper, the application of big data technology in fast image recognition of transmission towers is researched. The use of fast Rcnn Caffe is proposed for image deep learning to train the transmission tower model for fast identification of transmission tower images. Although the artificial identification method is more accurate in tree barrier modeling than the proposed method, the case study shows that the proposed method of fast image recognition of transmission towers can replace
Fig. 9Times of traditional and proposed tree barrier modeling methods. X axial is the number of the case study and y axial is the time it uses
Table 6Comparison of traditional tree barrier modeling and tree barrier modeling based on fast image recognition of transmission towers
No. Traditional tree barrier modeling (min) Tree barrier modeling based on fast image recognition of transmission towers within big data (min)
Increase of efficiency
Time of image recognition of transmission tower and generating power lines
Total time Time of image recognition of transmission tower and generating power lines
Total time
1 8 32.68 2.167 26.85 17.85%
2 8 30.29 2.167 24.45 19.26%
3 8 34.28 2.167 28.44 17.02%
4 8 30.55 2.167 24.72 19.09%
5 8 39.15 2.167 33.32 14.90%
6 8 41.37 2.167 35.54 14.10%
7 8 52.10 2.167 46.27 11.20%
8 8 44.83 2.167 39.00 13.01%
9 8 41.46 2.167 35.63 14.07%
10 8 38.53 2.167 32.70 15.14%
11 8 44.48 2.167 38.64 13.12%
12 8 42.88 2.167 37.05 13.60%
13 8 45.01 2.167 39.18 12.96%
14 8 46.25 2.167 40.42 12.61%
15 8 49.18 2.167 43.34 11.86%
16 8 50.77 2.167 44.94 11.49%
17 8 40.40 2.167 34.56 14.44%
18 8 40.49 2.167 34.65 14.41%
19 8 43.06 2.167 37.22 13.55%
the artificial identification with greatly improved effi-ciency of tree barrier modeling and can be applied to large-scale tree barrier modeling of transmission lines.
Abbreviations
caffe:Convolutional architecture for fast feature embedding; Rcnn: Region-based convolutional neural networks; UAV: Unmanned aerial vehicle
Acknowledgements
The authors acknowledge support from the technology project of Guangdong power grid (key technologies research on intelligent inspection of Multi- rotor UAVs in transmission lines) under Grant No.
GDKJXM20162155(030600KK52160027).
Funding
Technology project of Guangdong power grid (key technologies research on intelligent inspection of Multi- rotor UAVs in transmission lines) under Grant No. GDKJXM20162155 (030600KK52160027).
Availability of data and materials
Patrol Center of Guangdong power grid.
Authors’contributions
ZLH built the model of image recognition of transmission tower, TH carried out the tree barrier modeling and finished the case studies, YHZ made the comparison between caffe and other mainstream frameworks, XYL and WJW drafted the manuscript and polished it. All authors read and approved the final manuscript.
Authors’information
Zhuangli Hu(1991-), female, master’s degree in electrical engineering, work in Foshan power supply bureau, Guangdong Power Grid Company. Major in high voltage cable technology, power system energy saving and planning. Tong He(1973-), male, master’s degree in electrical engineering, senior engineer in Foshan power supply bureau, Guangdong Power Grid Company. Major in UAV applications, power system optimization dispatch.
Yihui Zeng(1985-), male, master’s degree in electrical engineering, senior engineer in Foshan power supply bureau, Guangdong Power Grid Company. Major in UAV applications, image recognition technology and integrated status monitoring of power system.
Xiangyuan Luo(1978-), male, bachelor’s degree in electrical engineering, senior engineer in Foshan power supply bureau, Guangdong Power Grid Company. Major in high-voltage cable technology and cable project management.
Jiawen Wang(1995-), female, bachelor’s degree in electrical engineering and automation, master candidate of Hunan University. Major in electrical engineering.
Sheng Huang (1988-), male, Ph.D. degree in Hunan University, Changsha, China, in 2016. He is currently a Post Ph.D. with the Center for Electric and Energy, Department of Electrical Engineering, Technical University of Denmark. Major in renewable power generation, multi-terminal HVDC con-trol, wind farms control.
Jianming Liang(1985-), male, bachelor’s degree in electrical engineering, senior technician in Foshan power supply bureau, Guangdong Power Grid Company. Major in high-voltage cable technology and cable project management.
Qinzhang Sun(1980-), bachelor’s degree in electrical engineering, senior technician in Foshan power supply bureau, Guangdong Power Grid Company. Major in high-voltage cable fault detection and high-voltage cable operation and maintenance management.
HengbinXu(1992-), male, bachelor’s degree in communication engineering, work in Foshan power supply bureau, Guangdong Power Grid Company. Major in cable operation and maintenance, test and maintenance. Bin Lin(1991-), male, master’s degree in electrical engineering from Chongqing University, work in Foshan power supply bureau, Guangdong Power Grid Company. Major in high voltage cable technology and high-voltage cable condition monitoring.
Competing interests
The authors declare that they have no competing interests.
Author details
1Foshan power supply bureau, Guangdong Power Grid Company, No. 1
South Road, Fenjiang, Foshan, China.2College of Electrical and Information Engineering, Hunan University, Changsha, China.3Department of Electrical Engineering, Technical University of Denmark, 2800 Kongens Lyngby, Denmark.
Received: 5 March 2018 Accepted: 30 April 2018
References
1. Gantz, J., & Reinsel, D. (2011).Extracting value from chaos. Proceedings of IDC iView(pp. 1–12).
2. Rumsfeld, J. S., Joynt, K. E., & Maddox, T. M. (2016). Big data analytics to improve cardiovascular care: promise and challenges.Nat Rev Cardiol, 13, 350–359.
3. Swan, M. (2013). The quantified self: Fundamental disruption in big data science and biological discovery.Big Data, 1(2), 85–99.
4. Provost, F., & Fawcett, T. (2013). Data science and its relationship to big data and data-driven decision making.Big data, 1(1), 51–59.
5. Halu, A., Scala, A., & Abdulakhiyami, M. C. G. (2016). Data-driven modeling of solar-powered urban microgrids.Science, 2(1), 1–9.
6. Li, C., He, L., Cao, Y., Xiao, G., Zhang, W., & Liu, X. (2014). Carbon emission reduction potential of rural energy in China.Renew Sust Energ Rev, 29, 254–262. 7. Fang, B., Tan, Y., Li, C., & Cao, Y. Energy sustainability under the framework
of telecoupling.Energy, 106, 253–259.
8. Mladen Kezunovic, Le Xie, Santiago Grijalva. (2013). The role of big data in improving power system operation and protection. Bulk Power System Dynamics and Control - IX Optimization, Security and Control of the Emerging Power Grid (IREP).
9. Wang, D., & Sun, Z. (2015). Big Data Analysis and Parallel Load Forecasting of Electric Power User Side.Proceed CSEE, 35(3), 527–537 (in Chinese). 10. Diamantoulakis, P. D., Kapinas, V. M., & Karagiannidis, G. K. (2015). Big Data
Analytics for Dynamic Energy Management in Smart Grids.Big Data Res, 2(3), 94–101.
11. DongxiaZhang, XinMiao, LipingLiu, YanZhang, KeyanLiu.(2015). Research on Development Strategy for Smart Grid Big Data. Proceed CSEE, 35(1), 2–12 (in Chinese).
12. Liu, D., DongxiaZhang, H. S., Ma, S., Li, B., & Zhu, C. (2015). Construction of Stability Situation Quantitative Assessment and Adaptive Control System forLarge-scale Power Grid in the Spatio-temporal Big Data Environment. Proceed CSEE, 35(2), 268–276 (in Chinese).
13. LeCun, Y., Bengio, Y., & Hinton, G. (2015). Deep learning.Nature, 521, 436–444. 14. Schmidhuber, J. (2015). Deep learning in neural networks: An overview.
Neural Netw, 61, 85–117.
15. Hinton, G., Deng, L., Yu, D., et al. (2012). Deep neural networks for acoustic modeling in speech recognition: The shared views of four research groups. IEEE Signal Process Mag, 29(6), 82–97.
16. Hinton, Geo5ffery E., & Salakhutdinov, R. R. (2006). Reducing the dimensionality of data with neural networks.Science, 313(5786), 504–507. 17. Liu James, N. K., Yanxing, H., Jia, Y. J., & Wai, C. P. (2014). Deep Neural
Network Based Feature Representation for Weather Forecasting (pp. 1–7). Athens: Proceedings on the International Conference on Artificial Intelligence (ICAI).
18. Arel, I., Rose, D. C., & Thomas, P. (2010). Karnowski. Deep Machine Learning-A New Frontier in Learning-Artificial Intelligence Research.IEEE Comput Intell Mag, 5(4), 13–18.
19. Lv, Y., Duan, Y., Kang, W., Li, Z., & Wang, F.-Y. (2015). Traffic Flow Prediction With Big Data: A Deep Learning Approach.IEEE Trans Intell Transp Syst, 16(2), 865–873.
20. Shin, J.-H., Yi, B.-J., Kim, Y.-I., & Yang, I.-K. (2010). Development of Power Distribution Facility Map Input System Using Automatic Image Recognition Technology.IEEE Transact Power Deliv, 25(1), 231–237.
21. Er, M. J., Wu, S., Lu, J., & Toh, H. L. (2002). Face recognition with radial basis function (RBF) neural networks.IEEE Trans Neural Netw, 13(3), 697–610. 22. Yu, H., Wang, L., & Wang, K. (2012). Application of Image Processing
Technology and Neural Network in Power Equipment Identification.China Comput Commun, 10, 122–123 (in Chinese).
24. YanpengHao, G. L., YiweiXue, J. Z., & ZunweiShi, L. L. (2014). Wavelet Image Recognition of Ice Thickness on Transmission Lines.High Volt Eng, 40(2), 368–373 (in Chinese).
25. Li, Z. t., YanpengHao, L. L., & LinYang, C. F. (2011). Image Recognition of Ice Thickness on Transmission Lines Using Remote System.High Volt Eng, 37(9), 2288–2293 (in Chinese).
26. Planning and DevelopmentDepartment of China Power Enterprise. (2016). National Power Industry Statistical Bulletin.http://www.cima.org.cn/article. asp?classid=3&id=18778(in Chinese).
27. Ten years ago there was a bigger snow but it also made today's "infrastructure madness" in China. http://www.lswb.com.cn/p/20180127/ 34210.shtml. (in Chinese).
28. Tree barrier modeling with tilt photography in Guangdong Power Grid.
https://mp.weixin.qq.com/s?__biz=MzA5NDQ0NDA2NA==&mid=265209513 0&idx=1&sn=dec1803042cef65f365acbc34061b901&chksm=8ba9edd5bcde 64c348522b1bc7c18d67fe7155ae40519dac3543420918148e26008723f7 9024&mpshare=1&scene=23&srcid=0127qLw1PdebsUPuwzQycuaB#rd. 29. Guangdong Power Grid. (2017).Defect classification principle and control
requirements of tree barrier of different voltage levels of the transmission lines 2017. Guangzhou, China: [in Chinese].