SOFTWARE
ADMETlab: a platform for systematic
ADMET evaluation based on a comprehensively
collected ADMET database
Jie Dong
1,2,3†, Ning‑Ning Wang
1†, Zhi‑Jiang Yao
1, Lin Zhang
3, Yan Cheng
1, Defang Ouyang
5, Ai‑Ping Lu
4and Dong‑Sheng Cao
1,4*Abstract
Current pharmaceutical research and development (R&D) is a high‑risk investment which is usually faced with some unexpected even disastrous failures in different stages of drug discovery. One main reason for R&D failures is the efficacy and safety deficiencies which are related largely to absorption, distribution, metabolism and excretion (ADME) properties and various toxicities (T). Therefore, rapid ADMET evaluation is urgently needed to minimize failures in the drug discovery process. Here, we developed a web‑based platform called ADMETlab for systematic ADMET evalua‑ tion of chemicals based on a comprehensively collected ADMET database consisting of 288,967 entries. Four function modules in the platform enable users to conveniently perform six types of drug‑likeness analysis (five rules and one prediction model), 31 ADMET endpoints prediction (basic property: 3, absorption: 6, distribution: 3, metabolism: 10, elimination: 2, toxicity: 7), systematic evaluation and database/similarity searching. We believe that this web platform will hopefully facilitate the drug discovery process by enabling early drug‑likeness evaluation, rapid ADMET virtual screening or filtering and prioritization of chemical structures. The ADMETlab web platform is designed based on the Django framework in Python, and is freely accessible at http://admet .scbdd .com/.
Keywords: ADMETlab, ADMET, Drug‑likeness, ADMET database, Drug discovery, Cheminformatics
© The Author(s) 2018. This article is distributed under the terms of the Creative Commons Attribution 4.0 International License (http://creat iveco mmons .org/licen ses/by/4.0/), which permits unrestricted use, distribution, and reproduction in any medium, provided you give appropriate credit to the original author(s) and the source, provide a link to the Creative Commons license, and indicate if changes were made. The Creative Commons Public Domain Dedication waiver (http://creat iveco mmons .org/ publi cdoma in/zero/1.0/) applies to the data made available in this article, unless otherwise stated.
Background
Current pharmaceutical research and development is a high-risk investment that is characterized by a com-plex process including disease selection, target iden-tification, lead discovery and optimization, as well as preclinical and clinical trials. Although millions of active compounds have been found, the number of new drugs approved didn’t increase drastically in recent years [1–3]. Besides the non-technical issues, the efficacy and safety deficiencies could account for the main stagnation which is related largely to absorp-tion, distribuabsorp-tion, metabolism and excretion (ADME)
properties and various toxicities (T). ADME covers the pharmacokinetic issues determining whether a drug molecule will get to the target protein in the body, and how long it will stay in the bloodstream. Parallel evalu-ation of efficiency and biopharmaceutical properties of drug candidates has been standardized, and exhaustive studies of ADMET processes are nowadays routinely carried out at early stage of drug discovery to reduce the attrition rate. This is because the majority of clini-cal trial failures have been due to ADMET issues, not from a lack of efficacy. Since this is the most costly point to have a failure, ADMET-related research could save much time and money if they can divert even one clinical trial failure [4, 5]. Moreover, the current experimental methods for ADMET evaluation are still costly and time-consuming, and they need a lot of animal testing which is usually inadequate when managing hundreds of compounds in the early stage
Open Access
*Correspondence: oriental‑[email protected]
†Jie Dong and Ning‑Ning Wang contributed equally to this work 1 Xiangya School of Pharmaceutical Sciences, Central South University, No. 172, Tongzipo Road, Yuelu District, Changsha, People’s Republic of China
of drug discovery. In order to minimize failures, com-putational strategies are sought by medicinal chemists to predict the fate of drugs in organism, and to early identify the risk of toxicity [6, 7]. ADMET-related in silico models are commonly used to provide a fast and preliminary screening of ADMET properties before compounds are further investigated in vitro [8–11]. Currently, there are several free and commercial com-putational tools for predicting ADMET properties. However, these tools are not yet very accurate. Moreo-ver, most of existing computational tools are individual models which focus on specific ADMET properties and few can evaluate different ADMET properties simultaneously due to the limited data size and meth-ods [12–14].
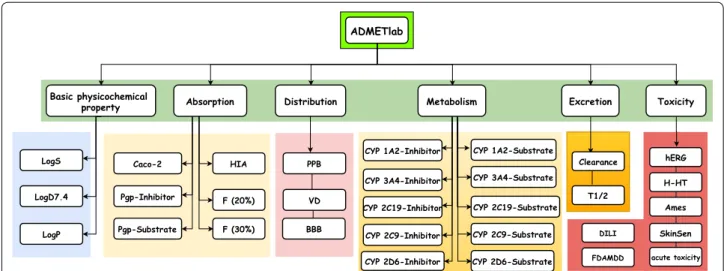
In order to facilitate the ADMET evaluation, we developed a web platform called ADMETlab based on a comprehensively collected database which inte-grates the existing ADMET and basic physicochemi-cal-related endpoints as many as possible (see Fig. 1). Four main modules are designed to conveniently assess ADMET properties: drug-likeness evaluation, ADMET prediction (31 endpoints assessment), sys-tematic ADMET evaluation for single chemical and database/similarity searching based on ADMET data-base with 288,967 entries. Compared with other online platforms, our proposed ADMETlab incorporated more ADMET endpoints and improved model perfor-mance for some endpoints based on large and struc-turally diverse data sets. These modules are deployed in a user-friendly, freely available web interface (http:// admet .scbdd .com/) and we recommend it as a valu-able tool for medicinal chemists in the drug discovery process.
Implementation
Development environment
ADMETlab consists of two main components: “ADMET database” and “Web platform”. They share a common running environment. We deployed an elastic compute service (ECS) server of Aliyun to run the whole project. The number of CPU cores and memory are automatically allocated to the running instances on demand, which ensures the elastically stretchable computing capabil-ity. In this project, Python was chosen as the main pro-gramming language because of its considerable libraries
for the scientific computation. We use Python-RDKit
[15], Pybel to wrap molecules; [16] use Chemopy [17]
ChemDes [18] and BioTriangle [19] to calculate molecu-lar descriptors and fingerprints; use Scikit-learn to build models of different algorithms; [20] use Numpy [21],
Pandas to wrap calculating results into numeric values or files [22]. Django is chosen as a high-level Python web framework which allows for the rapid development and clear design. According to its model visualization-control (MVC) design pattern, the whole system is divided into three main components: the backend calculating pro-gram, the back-end control program and the front-end
visualization program. At the backend, uWSGI + Nginx
worked as the web server software, The MySQL data-base was used for data storage and retrieval. It should be noted that ‘ADMET database’ and ‘Web platform’ shared a common database instance. At the front end, the web-site is designed in accordance with W3C standards based on HTML, CSS, and JavaScript languages.
User interface
ADMETlab provides a convenient and easy-to-use interface for users. The user interface of ADMETlab
consists of four main modules: “Webserver”, “Search”, “Documentation” and “Help”. “Webserver” is the main entrance for users to use “Web platform”, which includes three sub modules: “Druglikeness Evaluation”, “ADMET Prediction” and “Systematic Evaluation”. “Druglikeness Evaluation” module enables users to cal-culate 5 commonly used druglikeness rules and pro-vides a druglikeness model. This model can not only find out the active compounds from chemical entities but also distinguish the potential drug candidates from active compounds. “ADMET Prediction” module pro-vides 31 models to predict 31 ADMET related proper-ties. Users need to choose one model to obtain results for one or multiple molecules, which is suitable for screening target molecules of a specific endpoint. “Sys-tematic Evaluation” predicts all-sided pharmacokinetic properties of a specific promising compound and users will have an overall understanding of this compound. “Search” module is the interface for ADMET database, which enables users to perform accurate search, range search and similarity search. “Documentation” mod-ule provides detailed information about data, method-ologies and results of ADMETlab. The “Help” module describes examples about how to use the ADMETlab platform.
Input/output
The Input/Output system is mainly responsible for the input or output of the strings, commands and files.
ADMETlab uses the functions like file, open, write,
getcwd and setcwd from Python I/O system to accom-plish the file reads and writes. For “Druglikeness
Eval-uation” and “ADMET Prediction” module, SMILES and
SDF are acceptable molecular file types. These two
modules provide three kinds of input ways: by
input-ting SMILES, by uploading files and by drawing
mol-ecules from the JME editor. The outputs of them are
interactive data table and CSV file. The interactive
data table for five rules contains evaluation values for each point; each of the items can be expanded to see the detailed information and structures. Interactive data table for the model prediction results contains predicted values and structures. All the data tables allow for searching and ranking by the values. For
“Systematic Evaluation” module, SMILES is
accept-able molecular format, and the output is rendered as
HTML page which contains basic information about
the query molecule and predicted values of all the
end-points. For “Search” module, the SMILES and related
parameters are set for input; the output is rendered as
HTML page which contains interactive data table of all satisfied items.
Methods
Data collection
The data of ADMETlab consisted of two parts. The first part was collected from peer-reviewed publications through manually filtering and processing. Note that this part will also be then used to the modeling process. The second part was collected from ChEMBL [23], EPA [24]
and DrugBank databases [25]. The corresponding basic
information and experimental values were collected at the same time. All the obtained data were checked and washed by molecular operating environment (MOE, ver-sion 2016) and then divided into six classes (basic, A, D, M, E and T) and a series of subclasses according to their endpoint meanings. After the format standardization and combination, 288,967 entries were obtained and then were input into the database. More detailed descrip-tion can be found in the “Documentadescrip-tion” secdescrip-tion of the website.
Data set preparing
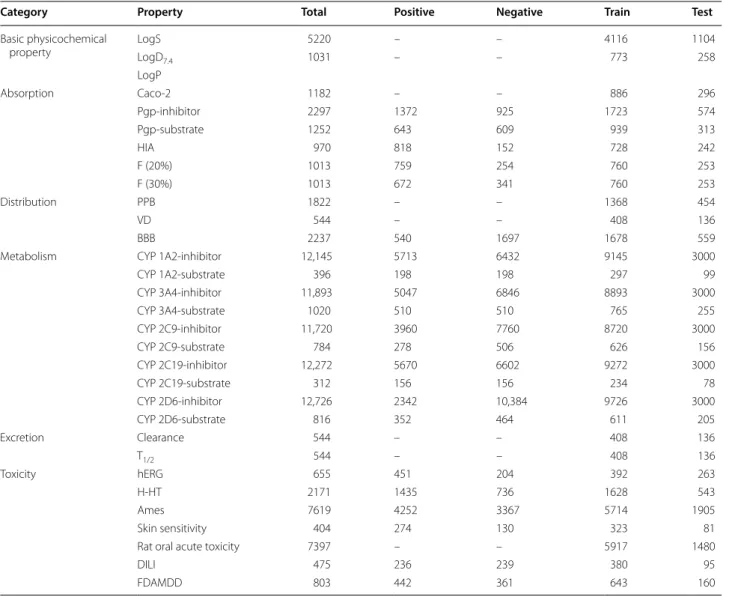
In the data collection process, we finally obtained 31 datasets for ADMET modeling from the first part of data. For these datasets, the following pretreatments were carried out to guarantee the quality and reliability of the data: (1) removing compounds that without explicit description for ADME/T properties; (2) for the classifica-tion data, reserve only one entity if there are two or more same compounds; (3) for the regression data, if there are two or more entries for a molecule, the arithmetic mean value of these values was adopted to reduce the random error when their fluctuations was in a reasonable limit, otherwise, this compound would be deleted; (4) Wash-ing molecules by MOE (disconnectWash-ing groups/metals in simple salts, keeping the largest molecular fragment and add explicit hydrogen). After that, a series of high-quality datasets were obtained. According to the Organization for Economic Co-operation and Development (OECD) principles, not only the internal validation is needed to verify the reliability and predictive ability of models, but also the external validation [11]. Therefore, all the data-sets were divided into training set and test set according to the chemical space distribution by “Diverse training set split” module from ChemSAR [26]. In this step, we set a threshold that 75% compounds were used as training set and the remaining 25% as test set. The detailed infor-mation for these datasets can be seen in Table 1.
Descriptor calculation
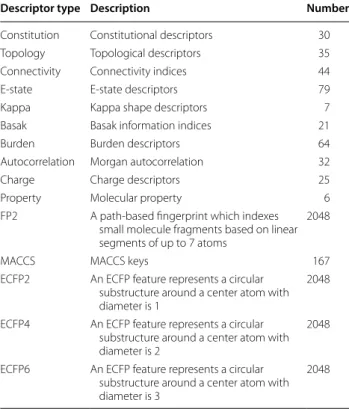
descriptors and 403 descriptors in total. All the descrip-tors were calculated by using Chemopy—a python pack-age built by our group. These continuous descriptors were used to build regression models. The fingerprints include FP2, MACCS, ECFP2, ECFP4 and ECFP6, which were calculated by using ChemDes [18] and BioTriangle
[19]. These fingerprints were used to build classification models. All descriptors were firstly checked to ensure that the values of each descriptor are available for molec-ular structures. The detailed information of these men-tioned descriptors can be seen in Table 2.
Descriptor selection
To build those regression models, we need to select proper descriptors. Before further descriptor selection, three feature pre-selection steps were performed to eliminate some uninformative descriptors: (1) remove
descriptors whose variance is zero or close to zero; (2) remove descriptors, the percentage of whose identical values is larger than 95% and (3) if the correlation of two descriptors is large than 0.95, one of them was randomly removed. The remaining descriptors were used to further perform descriptor selection and QSAR modeling. For these molecular descriptors, further descriptor selection need be carried out to eliminate uninformative and inter-ferential descriptors. In this study, we utilize the internal descriptor importance ranking function in random forest (RF) to select informative descriptors [27]. The descriptor selection procedure is performed as follows: Firstly, all descriptors were applied to build a model. The number of estimators of RF was set as 1000; the mtry was set as √p , the other parameters were set as defaults, and five-fold cross-validation was used to evaluate the model. These involved descriptors were sorted according to
Table 1 The statistical results of the datasets for modeling
Category Property Total Positive Negative Train Test
Basic physicochemical
property LogSLogD 5220 – – 4116 1104
7.4 1031 – – 773 258
LogP
Absorption Caco‑2 1182 – – 886 296
Pgp‑inhibitor 2297 1372 925 1723 574
Pgp‑substrate 1252 643 609 939 313
HIA 970 818 152 728 242
F (20%) 1013 759 254 760 253
F (30%) 1013 672 341 760 253
Distribution PPB 1822 – – 1368 454
VD 544 – – 408 136
BBB 2237 540 1697 1678 559
Metabolism CYP 1A2‑inhibitor 12,145 5713 6432 9145 3000
CYP 1A2‑substrate 396 198 198 297 99
CYP 3A4‑inhibitor 11,893 5047 6846 8893 3000
CYP 3A4‑substrate 1020 510 510 765 255
CYP 2C9‑inhibitor 11,720 3960 7760 8720 3000
CYP 2C9‑substrate 784 278 506 626 156
CYP 2C19‑inhibitor 12,272 5670 6602 9272 3000
CYP 2C19‑substrate 312 156 156 234 78
CYP 2D6‑inhibitor 12,726 2342 10,384 9726 3000
CYP 2D6‑substrate 816 352 464 611 205
Excretion Clearance 544 – – 408 136
T1/2 544 – – 408 136
Toxicity hERG 655 451 204 392 263
H‑HT 2171 1435 736 1628 543
Ames 7619 4252 3367 5714 1905
Skin sensitivity 404 274 130 323 81
Rat oral acute toxicity 7397 – – 5917 1480
DILI 475 236 239 380 95
their importance, and then the last two descriptors were removed and the rest were used to rebuild the model and a new descriptor order was obtained. Repeat this step until the last two remaining descriptors were left, and at last we get a series of models based on different numbers of descriptors. Among them, we can choose a best fea-ture combination according to the number of descriptors and the error value of the model.
Modeling algorithms
In this study, six different modeling algorithms were applied to develop QSAR regression or classification models for ADME/T related properties: random forests (RF), support vector machine (SVM), recursive parti-tioning regression (RP), partial least square (PLS), naïve Bayes (NB) and decision tree (DT).
RF is an ensemble of unpruned classification or regres-sion trees created by using bootstrap samples of the training data and random feature selection in tree induc-tion, which was firstly proposed by Breiman in 2001 [28,
29]. SVM is an algorithm based on the structural risk
minimization principle from statistical learning theory. Although developed for classification problems, SVM can also be applied to the case of regression [30]. RP has been developed since the 1980s and it is a statistical method for multivariable analysis. RP creates a decision tree that
strives to correctly classify members of the population by splitting it into sub-populations based on several dichot-omous independent variables. The process is termed recursive because each sub-population may in turn be split an indefinite number of times until the splitting process terminates after a particular stopping criterion is reached [31]. PLS is a recently developed generaliza-tion of multiple linear regression (MLR), it is of particu-lar interest because, unlike MLR, it can analyze data with strongly collinear, noisy, and numerous X-variables, and also simultaneously model several response variables [32,
33]. NB is a simple learning algorithm that utilizes Bayes rule together with a strong assumption that the attributes are conditionally independent, given the class. Coupled with its computational efficiency and many other desir-able features, NB has been widely applied in practice [34]. DT is a non-parametric supervised learning method used for classification and regression. The goal is to cre-ate a model that predicts the value of a target variable by learning simple decision rules inferred from the data
fea-tures [35]. Among these six methods, the RF, SVM, RP
and PLS were used for regression model building; the RF, SVM, NB and DT were applied to build those classifica-tion models. Before the modeling building, all related parameters of some algorithms should be optimized. They are (estimators, mtry) for RF, (Sigma, C) for SVM (rbf) and (n_components) for PLS separately. The cross validation method based on grid search was adopted to obtain optimized parameter sets. Specifically, for RF we tried the estimators of 500 and 1000; the mtry was opti-mized through two stages: firstly, use 20 as the step length
and (1, n_features) as the range, and then use 2 as the
step length and (mtryʹ − 50, mtryʹ + 50) as the range while
mtryʹ− 50 > 0 and mtryʹ + 50 ≤ n_features. The mtryʹ was the result of stage 1. Similarly, for SVM (rbf) two stages were applied to optimize the parameter sets. Firstly, the coarse grid-search process used: C= {start: 2^(− 5), end: 2^(15), step: 2^(2)} and Sigma = {start: 2^(− 15), end: 2^(3), step: 2^(2)}. Secondly, the finer grid-search process used 2^(0.25) as the step length to optimize the results from stage 1. For PLS, the best n_components was opti-mized from 1 to 100.
For some unbalanced datasets, the obtained mod-els may be biased if general modeling processes were applied. To obtain some more balanced classification models, we proposed two new methods to achieve this goal: (1) Samplesize parameter in RF. When this param-eter is set to 100, it means that 100 positive compounds and 100 negative compounds were randomly selected to build a tree in each modeling process and this process repeated many times to guarantee that every compound in the training set could be used in the final RF model. The use of this method guarantees that the number of
Table 2 The molecular descriptors that were used in modeling process
Descriptor type Description Number
Constitution Constitutional descriptors 30
Topology Topological descriptors 35
Connectivity Connectivity indices 44
E‑state E‑state descriptors 79
Kappa Kappa shape descriptors 7
Basak Basak information indices 21
Burden Burden descriptors 64
Autocorrelation Morgan autocorrelation 32
Charge Charge descriptors 25
Property Molecular property 6
FP2 A path‑based fingerprint which indexes small molecule fragments based on linear segments of up to 7 atoms
2048
MACCS MACCS keys 167
ECFP2 An ECFP feature represents a circular substructure around a center atom with diameter is 1
2048
ECFP4 An ECFP feature represents a circular substructure around a center atom with diameter is 2
2048
ECFP6 An ECFP feature represents a circular substructure around a center atom with diameter is 3
positive samples and negative samples is relatively bal-anced in each bootstrap sampling process. (2) The ran-dom sampling method was applied for the positive compounds (if positive samples are much more than negative samples) in each modeling process and this pro-cess was repeated 10 times. Finally, a consensus model was obtained for further application based on these 10 classification models. Besides, The Cohen’s kappa coef-ficient can be used as a performance metric to evaluate the results of models based on unbalanced dataset. Here we calculated the coefficient for the 7 unbalanced models (see the “Documentation”). Considering the barely satis-factory results of some properties such as VD, CL, T1/2
and LD50 of acute toxicity, the percentage of compounds
predicted within different fold errors (Folds) was applied to assess model performance. They are defined as follows: fold = 1 + |Ypred − Ytrue|/Ytrue. A prediction method with
an average-fold error < 2 was considered successful.
Performance evaluation
To ensure the obtained QSAR model has good generali-zation ability for a new chemical entity, fivefold cross-validation and a test set were applied for this purpose. For fivefold cross-validation, the whole training set was split into five roughly equal-sized parts firstly. Then the model was built with four parts of the data and the prediction error of the other one part was calculated. The process was repeated five times so that every part could be used as a validation set. For these regression models, six commonly used parameters were applied to evaluate their quality: the square correlation coef-ficients of fitting (RF2); the root mean squared error of
fitting (RMSEF); the square correlation coefficients of
cross-validation (Q2); the root mean squared error of
cross validation (RMSEcv), the square correlation
coef-ficients of test set (RT2); the root mean squared error of
test set (RMSET). As to these classification models, four
parameters were proposed for their evaluation: accu-racy (ACC); specificity (SP); sensitivity (SE); the area under the ROC curve (AUC). Their statistic definitions are as follows:
R2F =1− ˆyi−yi
2
(yi− ¯y)2
RMSEF = 1
N
N
1=1
yi− ˆyi2
Q2=1− yˆ(v)i−yi
2
(yi− ¯y)2
where yiˆ and yi are the predicted and experimental values
of the ith sample in the data set; y¯ is the mean value of
all the experimental values in the training set; ˆy(v)i is the predicted value of ith sample for cross validation; N is the number of samples in the training set. TP, FP, TN and FN represent true positive, false positive, true negative and false negative, respectively.
Results and discussion
Drug‑likeness analysis
This drug-likeness analysis module is designed for users to filter those chemical compounds that are not likely to be leads or drugs. The module includes five commonly used drug-likeness rules (Lipinski, Ghose, Oprea, Veber, and Varma) and one well-performed classification model [36–40]. The classification model consisting of 6731 positive samples from DrugBank and 6769 negative sam-ples from ChEMBL with IC50 or Ki values < 10 μm was constructed based on the random forest method and MACCS fingerprint, with classification accuracy of 0.800 and AUC score of 0.867 by external test set. By means of drug-likeness analysis, users can preliminarily screen out some promising compounds that are likely to be leads or drugs in the early stage of drug discovery.
RMSEcv=
1
N N
1=1
yi− ˆy(v)i2
R2T =1− yiˆ −yi
2
(yi− ¯y)2
RMSET =
1
N N
1=1
yi− ˆyi2
ACC= TP+TN
TP+TN+FP+FN
SP= TN
TN+FP
SE= TP
ADMET prediction
To quickly evaluate various ADMET properties, a series of high-quality prediction models were generated and validated. Totally, there are 9 regression models (LogP was from RDKit directly) and 22 classification models with improved performance in this platform (basic prop-erty: 3, absorption: 6, distribution: 3, metabolism: 10, elimination: 2, toxicity: 7). Different methods, different representations and large datasets, to our best knowl-edge, were applied to obtain these optimal models (see Additional file 1). For some unbalanced datasets (e.g., HIA, CYP2C9-Substrate, CYP2D6-Substrate) or hard-to-predict endpoints (e.g., CL, T1/2, acute toxicity), several useful strategies were proposed to improve prediction ability of models (see Additional file 1). For example, res-ampling strategy and ensemble techniques are applied to cope with those unbalanced data. The parameter adjust-ing class balance in the random forest algorithm is opti-mized to obtain balanced models. For each property, the detailed explanation and corresponding suggestion are provided for users to give a meaningful understanding of prediction results. This module allows the batch predic-tion and users can realize rapid ADMET screening or fil-tering based on these specific prediction models.
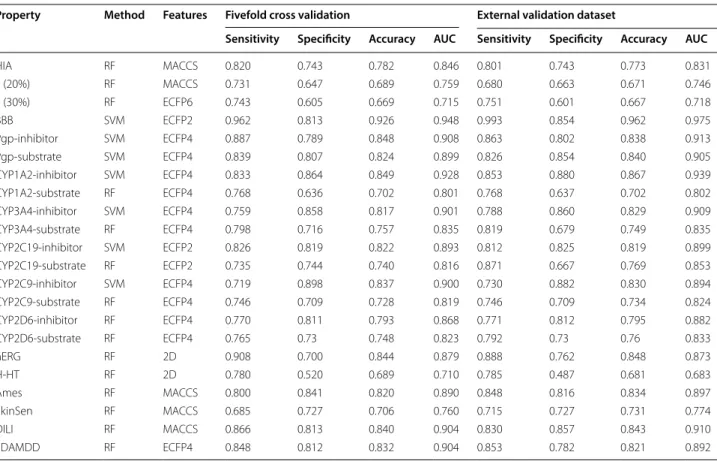
The performances of the models are shown in Tables 3,
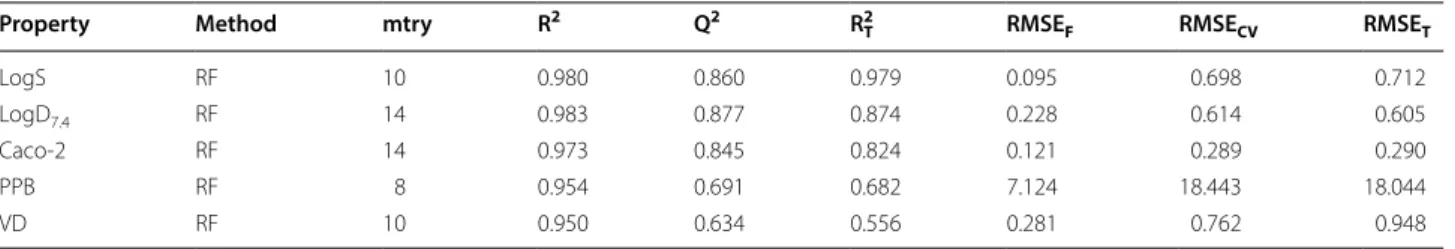
4 and 5. From the results we can see: (1) Most of the models obtained a good performance; LogS, LogD7.4 and
Caco-2 got a Q2 > 0.84; 86% of the classification models
got accuracy > 0.7; 50% of the classification models got accuracy > 0.8. All the models had a better or compara-ble performance compared with previous works in peer-reviewed publications, which was discussed in detail in the Additional file 1. (2) There were still few models got a
low Q2 or accuracy like PPB, VD, F20 and F30, while these
models have been also improved by using larger data-set or good modeling strategies compared with previous published ones. (3) For obvious unbalanced datasets: F20, F30, CYP2C9-Substrate and CYP2D6-Substrate, their best performance models were not the same with those in Table 5. From the results in Additional file 1 we found that the SE was about twice as much as SP, which led to an ineffective classifier. This phenomenon was caused by the unbalanced datasets. After it was processed with the strategies mentioned above, the SE and SP became very close. To F20, the SE/SP of the best model was
opti-mized to 0.731/0.647 (RF + MACCS) from 0.907/0.450
(SVM + MACCS). The F30, CYP2C9-Substrate and
CYP2D6-Substrate were also improved by this way. From the results of Cohen’s kappa coefficient, we can see that after the processing using our strategies, the consistency is quite acceptable. 4) RF method showed a best ability to build regression models of datasets in Tables 3 and 4; SVM and RF methods combined with ECFP4 performed best in most cases in datasets of Table 5.
Systematic ADMET evaluation
For a specific compound, this module provides a con-venient tool for systematic ADMET evaluation by pre-dicting all-sided pharmacokinetic properties and thus users will have an overall understanding of ADMET properties of this compound. By inputting a molecule, “Predicted values”, “Probability”, “Suggestion”, “Meaning & Preference” and “Reference” will be shown according to different endpoints. For regression models the “Pre-dicted values” is shown as numeric values with com-monly used units. For classification models the number of “+” or “−” were used to represent the “Predicted val-ues” according to the “Probability”. This will give a more clear and intuitive representation instead of a numeric character. For each endpoint, the reasonable recom-mendation (“Suggestion”) for ADMET is also provided. According to these given suggestion, users can extract some rational compounds with multiple reasonable profiles and further optimize their chemical structures in a purposeful way to make them more potential to be
Table 3 The best regression models for some ADMET related properties (Part 1)
Property Method mtry R2 Q2 R T
2 RMSE
F RMSECV RMSET
LogS RF 10 0.980 0.860 0.979 0.095 0.698 0.712
LogD7.4 RF 14 0.983 0.877 0.874 0.228 0.614 0.605
Caco‑2 RF 14 0.973 0.845 0.824 0.121 0.289 0.290
PPB RF 8 0.954 0.691 0.682 7.124 18.443 18.044
VD RF 10 0.950 0.634 0.556 0.281 0.762 0.948
Table 4 The best regression models for some ADMET related properties (Part 2)
Property Method Features mtry Twofold rate
(CV/test) Threefold rate (CV/ test)
CL RF 2D 10 0.760/0.816 0.877/0.897
T1/2 RF 2D 12 0.762/0.699 0.897/0.824
drugs. Besides, the “Meaning & Preference” summa-rizes the key points of knowledge-based rules for each endpoint and category standards from the “Reference”. This strongly assists researchers to evaluate ADMET of the specific compound in a systematic way.
Database searching
Based on the comprehensive ADMET database, the data-base searching and similarity searching were provided for users. With an input of molecular structures or phar-macokinetic properties, the matched compounds in the database can be listed in the result table. For the basic searching, two approaches are provided: accurate search-ing by SMILES, CAS registry number or IUPAC name; range searching via the range of molecular weight, AlogP, hydrogen bond acceptor or hydrogen bond donor. For similarity searching, different structural similarity crite-rions can be chosen to search similar compounds to the input structure. Here, we provide five kinds of finger-prints to represent molecular information and two kinds of similarity metrics for similarity search. According to these results, users can not only evaluate ADMET prop-erties for a new compound but also obtain some useful hints about its structure optimization.
Features
Currently, there have been several tools that contribute to ADMET analysis in different ways. However, ADMET-lab has some unique and good features: (1) Providing a largest database containing direct ADMET data val-ues. The database collected 288,967 entries from dif-ferent data sources, each of which not only records the “ADMET values”, “Class”, “Subclass” and “Structure” but also 18 annotations like “IUPACName”, “Description” and “Reference”. (2) Comparative large datasets of most properties. For modeling of each property, the datasets was manually collected and integrated from reliable peer-reviewed publications and databases as many as possible. This guarantees a large and structurally diverse dataset and the broader application domain than other ones. (3) Better and robust SAR/QSAR models. For each endpoint, we employed different algorithms combined with differ-ent represdiffer-entations and obtained comparable or better models than other tools which have been discussed in the Additional file 1. (4) Providing systematic analysis and comparison. It should be noted that not just one prop-erty affects the behavior of drugs in body. Usually we are looking for molecules that possess relatively good per-formance through every stage of ADME/T. ADMETlab
Table 5 The best classification models for some ADME/T related properties
Property Method Features Fivefold cross validation External validation dataset
Sensitivity Specificity Accuracy AUC Sensitivity Specificity Accuracy AUC
HIA RF MACCS 0.820 0.743 0.782 0.846 0.801 0.743 0.773 0.831
F (20%) RF MACCS 0.731 0.647 0.689 0.759 0.680 0.663 0.671 0.746
F (30%) RF ECFP6 0.743 0.605 0.669 0.715 0.751 0.601 0.667 0.718
BBB SVM ECFP2 0.962 0.813 0.926 0.948 0.993 0.854 0.962 0.975
Pgp‑inhibitor SVM ECFP4 0.887 0.789 0.848 0.908 0.863 0.802 0.838 0.913
Pgp‑substrate SVM ECFP4 0.839 0.807 0.824 0.899 0.826 0.854 0.840 0.905
CYP1A2‑inhibitor SVM ECFP4 0.833 0.864 0.849 0.928 0.853 0.880 0.867 0.939
CYP1A2‑substrate RF ECFP4 0.768 0.636 0.702 0.801 0.768 0.637 0.702 0.802
CYP3A4‑inhibitor SVM ECFP4 0.759 0.858 0.817 0.901 0.788 0.860 0.829 0.909
CYP3A4‑substrate RF ECFP4 0.798 0.716 0.757 0.835 0.819 0.679 0.749 0.835
CYP2C19‑inhibitor SVM ECFP2 0.826 0.819 0.822 0.893 0.812 0.825 0.819 0.899
CYP2C19‑substrate RF ECFP2 0.735 0.744 0.740 0.816 0.871 0.667 0.769 0.853
CYP2C9‑inhibitor SVM ECFP4 0.719 0.898 0.837 0.900 0.730 0.882 0.830 0.894
CYP2C9‑substrate RF ECFP4 0.746 0.709 0.728 0.819 0.746 0.709 0.734 0.824
CYP2D6‑inhibitor RF ECFP4 0.770 0.811 0.793 0.868 0.771 0.812 0.795 0.882
CYP2D6‑substrate RF ECFP4 0.765 0.73 0.748 0.823 0.792 0.73 0.76 0.833
hERG RF 2D 0.908 0.700 0.844 0.879 0.888 0.762 0.848 0.873
H‑HT RF 2D 0.780 0.520 0.689 0.710 0.785 0.487 0.681 0.683
Ames RF MACCS 0.800 0.841 0.820 0.890 0.848 0.816 0.834 0.897
SkinSen RF MACCS 0.685 0.727 0.706 0.760 0.715 0.727 0.731 0.774
DILI RF MACCS 0.866 0.813 0.840 0.904 0.830 0.857 0.843 0.910
allows users to evaluate most aspects of ADME/T process of one specific molecule, which gives users a full impres-sion and leads to constructive suggestions of molecular optimization. (4) Supporting diverse similarity searching approaches. (5) Supporting batch computation. Calculat-ing the properties for a sCalculat-ingle molecule is of little use for a chem- or bio-informatician who is dealing with ample data especially in virtual screening. ADMETlab supports the batch computation by uploading files. (6) Providing a convenient user-friendly interface. The rich prompts and robust verification systems in ADMETlab ensure a good user experience.
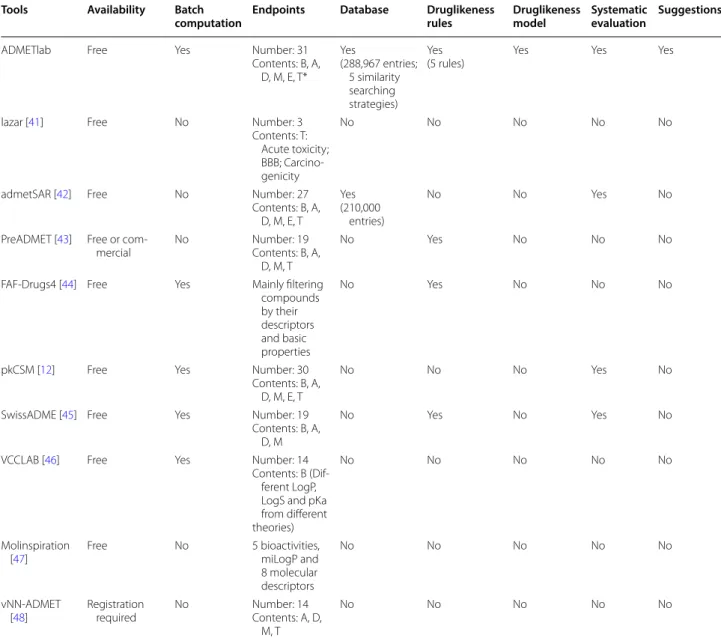
In order to give a more clear comparison we have listed all related web tools as possible as we know in Table 6. In the table we described their advantages/shortcomings and compared them with ADMETlab: (1) The “Similar-ity searching”, “Druglikeness model” and “Suggestion” functionalities are unique features of ADMETlab. (2) It seems that some tools are similar with ADMElab. There is no doubt that all of them contribute to ADMET prop-erties prediction; however, they are quite different from ADMETlab both in methods and functionalities. Take admetSAR for example, the admetSAR built 22 classifica-tion models and 5 regression models with SVM methods,
Table 6 Web tools related with ADMET prediction
*The “B, A, D, M, E, T” refers the contents in the “Documentation” section of our website. A tool that marked “A” means it covers some endpoints of class “A”, not all endpoints of class “A”
Tools Availability Batch
computation Endpoints Database Druglikeness rules Druglikeness model Systematic evaluation Suggestions
ADMETlab Free Yes Number: 31
Contents: B, A, D, M, E, T*
Yes
(288,967 entries; 5 similarity searching strategies)
Yes
(5 rules) Yes Yes Yes
lazar [41] Free No Number: 3
Contents: T: Acute toxicity; BBB; Carcino‑ genicity
No No No No No
admetSAR [42] Free No Number: 27
Contents: B, A, D, M, E, T
Yes (210,000
entries)
No No Yes No
PreADMET [43] Free or com‑
mercial No Number: 19Contents: B, A, D, M, T
No Yes No No No
FAF‑Drugs4 [44] Free Yes Mainly filtering compounds by their descriptors and basic properties
No Yes No No No
pkCSM [12] Free Yes Number: 30
Contents: B, A, D, M, E, T
No No No Yes No
SwissADME [45] Free Yes Number: 19
Contents: B, A, D, M
No Yes No Yes No
VCCLAB [46] Free Yes Number: 14
Contents: B (Dif‑ ferent LogP, LogS and pKa from different theories)
No No No No No
Molinspiration
[47] Free No 5 bioactivities, miLogP and 8 molecular descriptors
No No No No No
vNN‑ADMET
[48] Registration required No Number: 14Contents: A, D, M, T
while ADMETlab systematically compared different methods (SVM, RF, NB, RP, PLS, DT) to get a proper method for each endpoint. In admetSAR, all compounds were represented using MACCS keys while ADMETlab systematically compared different descriptors and fin-gerprints (11 descriptor groups and 5 kinds of finger-prints) to get a more proper representation. It should be noted that the regression models based on SVM and MACCS keys are usually not very reliable in predicting continuous endpoints such as logS, logD, Caco-2 etc. Besides, ADMET combined larger datasets for most of the endpoints which represented broader chemical space. Moreover, ADMETlab provided batch computa-tion which enables to screen libraries for qualified mol-ecules. Another example is SwissADME, and it calculates 19 endpoints; however, it doesn’t calculate five kinds of CYP450 substrates, bioavailability, Clearance, T1/2, VD, Pgp-inhibitor, Caco-2, HIA, PPB and any toxicity end-points. So, ADMETlab is very different from these tools and can be used as a new systematic ADMET evaluation platform owing to these unique features.
Conclusion
ADMETlab provides a user-friendly, freely available web platform for systematic ADMET evaluation of chemicals based on a comprehensively collected database consist-ing of 288,967 entries. In this study, a series of well-per-formed prediction models were constructed based on different representation patterns and different modeling methods. With the assessment results, users can give an overall understanding of ADMET space, realize vir-tual screening or filtering and even obtain some hints about structure optimization. Additionally, some high-quality ADMET-related datasets are provided as bench-mark datasets to improve the ADMET prediction. In the future, we will continue to improve the server as follows: (1) More practical models for new ADMET properties should be added, such as cytotoxicity and renal toxic-ity models. (2) Some hard-to-predict models should be further optimized, such as CL and T1/2 models. (3) The database should be updated regularly. (4) Integrated anal-ysis based on ADMET profiles should be added to per-form ADMET space analysis. In conclusion, we believe that this web platform will hopefully facilitate the drug discovery process by enabling the early evaluation, rapid ADMET virtual screening or filtering and prioritization of chemical structures.
Additional file
Additional file 1. The detailed modeling process and results of the ADMET properties.
Authors’ contributions
JD and DSC designed and implemented the platform. JD, NNW and DSC wrote and revised the manuscript. NNW collected and prepared all the datasets. ZJY, LZ and NNW helped in preparing figures and tables, testing and validating the results. APL, DO and YC helped in giving suggestions to improve the platform. All authors read and approved the final manuscript.
Author details
1 Xiangya School of Pharmaceutical Sciences, Central South University, No. 172, Tongzipo Road, Yuelu District, Changsha, People’s Republic of China. 2 Hunan Key Laboratory of Grain‑oil Deep Process and Quality Control, College of Food Science and Engineering, National Engineering Laboratory for Deep Processing of Rice and Byproducts, Central South University of Forestry and Technology, Changsha, People’s Republic of China. 3 Hunan Key Labora‑ tory of Processed Food for Special Medical Purpose, Central South University of Forestry and Technology, Changsha, People’s Republic of China. 4 Insti‑ tute for Advancing Translational Medicine in Bone & Joint Diseases, School of Chinese Medicine, Hong Kong Baptist University, Hong Kong SAR, People’s Republic of China. 5 State Key Laboratory of Quality Research in Chinese Medi‑ cine, Institute of Chinese Medical Sciences (ICMS), University of Macau, Macau, People’s Republic of China.
Competing interests
The authors declare that they have no competing interests.
Availability and requirements
Project name: ADMETlab. Project home page: http://admet .scbdd .com and https ://githu b.com/ifyou ngnet /ADMET lab. Operating system(s): Platform independent. Programming language: Python, JavaScript, HTML, CSS. Other requirements: Modern internet browser supporting HTML5 and JavaScript. The recommended browsers: Safari, Firefox, Chrome, IE (Ver. > 8). License: http://creat iveco mmons .org/licen ses/by‑nc‑sa/4.0/. Any restrictions to use by non‑academics: License needed.
Funding
This work is financially supported by the National Key Basic Research Program (2015CB910700), the National Natural Science Foundation of China (Grants Nos. 81402853, 81501619), the Program for Science &Technology Innovation Talents of Hunan Province (2017TP1021), the Project of Innovation‑driven Plan in Central South University. The studies meet with the approval of the university’s review board.
Publisher’s Note
Springer Nature remains neutral with regard to jurisdictional claims in pub‑ lished maps and institutional affiliations.
Received: 13 February 2018 Accepted: 16 June 2018
References
1. Mullard A (2014) 2013 FDA drug approvals. Nat Rev Drug Discov. 13(2):85–89
2. Mullard A (2017) 2016 FDA drug approvals. Nat Rev Drug Discov. 16(2):73–76
3. Fordyce CB, Roe MT, Ahmad T, Libby P, Borer JS, Hiatt WR et al (2015) Cardiovascular drug development: is it dead or just hibernating? J Am Coll Cardiol 65(15):1567–1582
4. Cheng F, Li W, Liu G, Tang Y (2013) In silico ADMET prediction: recent advances, current challenges and future trends. Curr Top Med Chem 13(11):1273–1289
5. Wang Y, Xing J, Xu Y, Zhou N, Peng J, Xiong Z et al (2015) In silico ADME/T modelling for rational drug design. Q Rev Biophys 48(4):488–515 6. Wishart DS (2007) Improving early drug discovery through ADME model‑
ling: an overview. Drugs R&D 8(6):349–362
8. Hou T (2015) Theme title: in silico ADMET predictions in pharmaceutical research. Adv Drug Deliver Rev. 86:1
9. Tao L, Zhang P, Qin C, Chen SY, Zhang C, Chen Z et al (2015) Recent pro‑ gresses in the exploration of machine learning methods as in silico ADME prediction tools. Adv Drug Deliver Rev. 86:83–100
10. Wang N, Huang C, Dong J, Yao Z, Zhu M, Deng Z et al (2017) Predicting human intestinal absorption with modified random forest approach: a comprehensive evaluation of molecular representation, unbalanced data, and applicability domain issues. RSC Adv. 7(31):19007–19018
11. Wang NN, Dong J, Deng YH, Zhu MF, Wen M, Yao ZJ et al (2016) ADME properties evaluation in drug discovery: prediction of Caco‑2 cell perme‑ ability using a combination of NSGA‑II and boosting. J Chem Inf Model 56(4):763–773
12. Pires DEV, Blundell TL, Ascher DB (2015) pkCSM: predicting small‑ molecule pharmacokinetic and toxicity properties using graph‑based signatures. J Med Chem 58(9):4066–4072
13. Davies M, Dedman N, Hersey A, Papadatos G, Hall MD, Cucurull‑Sanchez L et al (2015) ADME SARfari: comparative genomics of drug metabolizing systems. Bioinformatics 31(10):1695–1697
14. Dong J, Wang NN, Liu KY, Zhu MF, Yun YH, Zeng WB et al (2017) ChemBCPP: a freely available web server for calculating commonly used physicochemical properties. Chemometr Intell Lab Syst 171:65–73 15. Landrum. RDKit: open‑source cheminformatics. Release 2014.03.1. 2010 16. O’Boyle NM, Morley C, Hutchison GR (2008) Pybel: a Python wrapper for
the OpenBabel cheminformatics toolkit. Chem Cent J 2(1):1–7 17. Cao D, Xu Q, Hu Q, Liang Y (2013) ChemoPy: freely available python pack‑
age for computational biology and chemoinformatics. Bioinformatics 29(8):1092–1094
18. Dong J, Cao D, Miao H, Liu S, Deng B, Yun Y et al (2015) ChemDes: an integrated web‑based platform for molecular descriptor and fingerprint computation. J Cheminform 7(1):60
19. Dong J, Yao ZJ, Wen M, Zhu MF, Wang NN, Miao HY et al (2016) BioTrian‑ gle: a web‑accessible platform for generating various molecular repre‑ sentations for chemicals, proteins. DNAs/RNAs and their interactions. J Cheminform 8(1):34
20. Pedregosa F, Gramfort A, Michel V, Thirion B, Grisel O, Blondel M et al (2012) Scikit‑learn: machine learning in Python. J Mach Learn Res. 12(10):2825–2830
21. van der Walt S, Colbert SC, Varoquaux G (2011) The NumPy array: a struc‑ ture for efficient numerical computation. Comput Sci Eng 13(2):22–30 22. Mckinney W (2017) Python for data analysis: data wrangling with Pandas,
NumPy, and IPython. O’Reilly Media, Inc., Sebastopol
23. Gaulton A, Hersey A, Nowotka M, Bento AP, Chambers J, Mendez D et al (2017) The ChEMBL database in 2017. Nucleic Acids Res 45(D1):D945–D954
24. EPA. https ://www.epa.gov/. Accessed at 2018 Jan 15
25. Wishart DS, Knox C, Guo AC, Shrivastava S, Hassanali M, Stothard P et al (2006) DrugBank: a comprehensive resource for in silico drug discovery and exploration. Nucleic Acids Res. 34(SI):D668–D672
26. Dong J, Yao ZJ, Zhu MF, Wang NN, Lu B, Chen AF et al (2017) ChemSAR: an online pipelining platform for molecular SAR modeling. J Cheminform 9(1):27
27. Breiman L (2001) Random forests. Mach Learn 45(1):5–32
28. Cao D, Yang Y, Zhao J, Yan J, Liu S, Hu Q et al (2012) Computer‑aided prediction of toxicity with substructure pattern and random forest. J Chemometr 26(1):7–15
29. Cao D, Hu Q, Xu Q, Yang Y, Zhao J, Lu H et al (2011) In silico clas‑ sification of human maximum recommended daily dose based on
modified random forest and substructure fingerprint. Anal Chim Acta 692(1–2):50–56
30. Cao D, Dong J, Wang N, Wen M, Deng B, Zeng W et al (2015) In silico tox‑ icity prediction of chemicals from EPA toxicity database by kernel fusion‑ based support vector machines. Chemometr Intell Lab. 146:494–502 31. Strobl C, Malley J, Tutz G (2009) An introduction to recursive partitioning:
rationale, application, and characteristics of classification and regression trees, bagging, and random forests. Psychol Methods 14(4):323–348 32. Wold S, Sjostrom M, Eriksson L (2001) PLS‑regression: a basic tool of
chemometrics. Chemometr Intell Lab. 58(2):109–130
33. Cao D, Xu Q, Liang Y, Chen X, Li H (2010) Prediction of aqueous solubility of druglike organic compounds using partial least squares, back‑ propagation network and support vector machine. J Chemometr. 24(9):584–595
34. Jiang W, Shen Y, Ding Y, Ye C, Zheng Y, Zhao P et al (2018) A naive Bayes algorithm for tissue origin diagnosis (TOD‑Bayes) of synchronous mul‑ tifocal tumors in the hepatobiliary and pancreatic system. Int J Cancer 142(2):357–368
35. Xia Y, Liu C, Da B, Xie F (2018) A novel heterogeneous ensemble credit scoring model based on bstacking approach. Expert Syst Appl 93:182–199
36. Lipinski CA, Lombardo F, Dominy BW, Feeney PJ (2001) Experimental and computational approaches to estimate solubility and permeability in drug discovery and development settings. Adv Drug Deliver Rev. 46(1–3):3–26
37. Ghose AK, Viswanadhan VN, Wendoloski JJ. A knowledge based approach in designing combinatorial and medicinal chemistry libraries for drug dis‑ covery: 1. Qualitative and quantitative definitions of a drug like molecule. In: Abstracts of papers of the American Chemical Society, vol. 217, no. 1; 1999. p. U708.
38. Oprea TI (2000) Property distribution of drug‑related chemical databases. J Comput Aid Mol Des. 14(3):251–264
39. Veber DF, Johnson SR, Cheng HY, Smith BR, Ward KW, Kopple KD (2002) Molecular properties that influence the oral bioavailability of drug candi‑ dates. J Med Chem 45(12):2615–2623
40. Varma MVS, Obach RS, Rotter C, Miller HR, Chang G, Steyn SJ et al (2010) Physicochemical space for optimum oral bioavailability: contribution of human intestinal absorption and first‑pass elimination. J Med Chem 53(3):1098–1108
41. Lazar, https ://www.predi ctive ‑toxic ology .org/. Accessed at 2018 Jan 15 42. Cheng F, Li W, Zhou Y, Shen J, Wu Z, Liu G et al (2012) admetSAR: a
comprehensive source and free tool for assessment of chemical ADMET properties. J Chem Inf Model 52(11):3099–3105
43. PreADMET. https ://pread met.bmdrc .kr/. Accessed at 2018 Jan 15 44. Lagorce D, Bouslama L, Becot J, Miteva MA, Villoutreix BO (2017) FAF‑
Drugs4: free ADME‑tox filtering computations for chemical biology and early stages drug discovery. Bioinformatics 33(22):3658–3660
45. Daina A, Michielin O, Zoete V (2017) SwissADME: a free web tool to evalu‑ ate pharmacokinetics, drug‑likeness and medicinal chemistry friendliness of small molecules. Sci Rep UK 7:42717
46. Tetko IV, Gasteiger J, Todeschini R, Mauri A, Livingstone D, Ertl P et al (2005) Virtual computational chemistry laboratory ‑ design and descrip‑ tion. J Comput Aid Mol Des. 19(6):453–463
47. Molinspiration, http://www.molin spira tion.com/. Accessed at 2018 Jan 15 48. Schyman P, Liu R, Desai V et al (2017) vNN web server for ADMET predic‑